i
ASSESSMENT OF PROFIT EFFICIENCY AMONG SWEET
YELLOW PASSION FRUIT FARMERS IN MBEERE SOUTH,
EMBU COUNTY
Mwita Amos Chacha
A152/25630/2013
BSc. Agribusiness Management & Trade at Kenyatta University
A thesis submitted in partial fulfillment of the degree of Master of
Science (Agribusiness management and Trade), at Kenyatta
University.
iii DEDICATION
I dedicate this work to my mentors Dr. MainaMwangi, Dr. NewtonNyairo and
iv ACKNOWLEDGEMENT
My sincere thanks go to Kenyatta University for awarding me a MSc. scholarship to enable me further my studies. My gratitude also goes to my supervisors; Dr.
MainaMwangi and Dr. Newton Nyairo for their constructive criticism, tremendous guidance, and insightfulness that has helped me completethis thesis. I specially
thank Dr. MainaMwangi for the invaluable research financial support he extended to me through KAPAP project that enabled me to carry out this research, May God bless him.I also thank Stanley Karanja and Professor Job Nmadu for their support
in the use of Frontier 4.1 efficiency analysis software, may God bless them too. I would also like to thank all my lecturers in the department of Agribusiness
management for the knowledge and skills I have gained. My gratitude also goes to my course mate Christopher whom together with we encouraged each other and
v
Table of contents
DECLARATION ... i
DEDICATION ...ii
ACKNOWLEDGEMENT ... iv
Table of contents ...v
List of tables ... viii
List of figures ... ix
OPERATIONAL DEFINATION OF TERMS AND CONCEPTS ... x
List of Appendices ... xi
ABBREVIATIONS... xii
ABSTRACT ... xiii
CHAPTER ONE: INTRODUCTION ... 1
1.1 Background Information ... 1
1.2 Yellow Passion fruit production ... 3
1.3 Institutional Arrangements ... 5
1.4 Marketing of passion fruit ... 7
1.6 Agribusiness Financing... 10
1.7 Statement of the problem ... 12
1.8 OBJECTIVES ... 12
1.9 Hypotheses ... 13
1.10 Research question ... 13
1.11 Significance of the study ... 13
CHAPTER TWO: LITERATURE REVIEW ... 15
2.0 Introduction ... 15
2.1 Approaches used in efficiency ... 15
2.2 Measurement of profit efficiency ... 16
vi
2.3 Criticism and research gap ... 22
2.4 Theoretical framework ... 23
2.5 Conceptual Framework ... 27
CHAPTER THREE: METHODOLOGY ... 30
3.0 Introduction ... 30
3.1 Study Area ... 30
3.2 Research design ... 32
3.3 Sample size and Target population ... 32
3.4 Data analysis ... 33
CHAPTER FOUR: RESULTS ... 38
4.0 INTRODUCTION ... 38
4.1 Profit efficiency descriptive results ... 38
4.1 Descriptive results of Socio-economic and Institutional characteristics of Mbeere South district ... 39
4.2 Normality Test... 46
4.3 Determination of profit efficiency ... 46
4.4 Factors influencing Profit efficiency among sweet yellow passion fruit farmers in Mbeere South District... 48
4.5 Comparison of Profit efficiency scores to selected Socio-economic and Institutional Characteristics... 49
CHAPTER FIVE: DISCUSSION ... 52
5.0 Introduction ... 52
5.1 Determination of Profit efficiency ... 52
5.2 Estimates of the Stochastic Frontier Profit Function ... 53
5.3 Factors influencing efficiency ... 54
5.4 Comparison of Socio-economic and Institutional characteristics to Profit efficiency ... 60
CHAPTER SIX: CONCLUSION AND RECOMMENDATIONS ... 65
REFERENCES ... 69
vii
viii List of tables
Table 1: Main fruits grown in Kenya ... 2
Table 2: Description of the study area ... 31
Table 3: Hypothesized signs of variables ... 37
Table 4: Profit Efficiency levels ... 38
Table 5: Descriptive results of Socio-economic and Institutional characteristics of Mbeere South Sub-County ... 40
Table 6: Off-farm (Off-swy) economic activities ... 43
Table 7: Marketing channel ... 45
Table 8: Stochastic frontier profit function results for Mbeere South ... 47
Table 9: Inefficiency Model Results for Mbeere South ... 48
ix
List of figures
x
OPERATIONAL DEFINATION OF TERMS AND CONCEPTS
Small scale farmers- are farmers that have 0.01 to 3.00 ha of their land under sweet yellow passion fruit production.
Profit efficiency- refers to the ability of a sweet yellow passion fruit farmer expending an optimally balanced level of profit from production resources (ranges from 0 to 1). It indicates production efficiency.
High market value crop- refers to high value crops that fetch high prices per unit. Sweet yellow passion fruit is a high value crop in this study.
Inefficiency- refers to a farmer who is not operating on the profit frontier.
xi List of Appendices
Annex 1: Stochastic frontier profit function results for Mbeere South district ... 83
Annex 2: Inefficiency Model Results for Mbeere South District ... 84
Annex 3: Kernel density estimate ... 85
Annex 4: Kernel density super-imposed on normal curve ... 86
xii ABBREVIATIONS
EAG……… East African Growers
EAGA…………. East African Growers Association GDP……… Gross Domestic Product
HCDA………….. Horticultural Crops Development Authority
KAPAP………… Kenya Agricultural Productivity and Agribusiness Programme KALRO………… Kenya Agricultural and Livestock Research Organization
KBDS…………... Kenya Business Development Services Kgs………... Kilogrammes
KShs……… Kenyan Shillings
MLE……… Maximum Likelihood Estimation MoA………. Ministry of Agriculture
MT………... Metric tonnes
OLS………. Ordinary Least Squares
xiii ABSTRACT
1 CHAPTER ONE: INTRODUCTION 1.1 Background Information
Agriculture contributes 26% of Kenya‟s GDP and accounts for 75% of employment(MoAL&F, 2015). The horticulture industry in Kenya has been very
successful in the last one and a half decades. This sub-sector has grown to become a major employer and foreign exchange earner (HCDA, 2013). The subsector also directly employs over 4 million people, mainly in rural areas with the majority
being women and the youth. By positively creating employment, the sector thus helps in alleviating poverty and in wealth creation. It is ranked the second most
important foreign exchange earner in Kenya after tourism (HCDA, 2008).
The total value of horticultural exports in 2014 was 84 billionKshshaving exported 220,000 MT of produce. On the other hand, the domestic value was 201 billion
Kshsoccupying an area of 684,912 ha with a total production quantity of 8.4 million tons. There was a 16% increase in quantity exported as compared to 2013. The increase in quantity and value was due to the increase of vegetables, fruits and
processed fruits exports,(Directorate, 2014).
In 2014, fruits contributed Kshs 51.5 billion accounting for 22% of the domestic
value of horticultural produce(Directorate, 2014). The area under fruit cultivation was 161,472ha with a production of 4.2 million tons. Although the area under fruit
2
report categorizes the main fruits grown in Kenya to be the tropical and temperate fruits. These are grown in order of importance as;
Table 1: Main fruits grown in Kenya
Fruit Percentage
Banana 37.6%
Mangoes 19.6%
Pineapples 12.1%
Avocado 9.8%
Paw paw 5.4%
Oranges 4.6%
Watermelon 4.2%
Passion fruit 3.7%
Source: HCDA (2013)
The potential of most fruits remain unexploited. However, there is potential for growth due to increasing demand both in the domestic and export market for fresh
fruits and fruit produce such as juices and concentrates (HCDA, 2013). For the past decade, over 90% of all fruit and vegetable production was consumed domestically, and the domestic market accounted for over 90% of the total growth
3
According to COLEACP (2011), Kenya exports around 1000 tonnes of passion fruit per year.
Passion fruit in 2013 was found to account for 3.7% in the main fruits grown in Kenya category. This is very low considering its market demand and nutritious
value in the country. There are two main varieties of the passion fruit; the purple and the yellow varieties, with the yellow being distinguished as P. edulis f. flavicarpa. The yellow passion fruit has a yellow rind and larger fruit, more acid
flavor, resistant to nematodes and Fusarium wilt, and has brown seeds, it is resistant to most pests and diseases (COLEACP, 2011). According to
Wangungu(2013), the Kenyan passion fruit has emerged as a high market value crop influenced by the establishment of the (Kevian and Valley orchards among
others), and the expansion of existing (Delmonte and Coca cola) large scale processors of fruit juice to include passion fruit juice into their products.
1.2 Yellow Passion fruit production
Mostly, passion fruit is round or oval, 4-6cm diameters. Vines commence cropping at 6 months of age and reach full bearing in 18 months. The vines have a
productive life of 3 to 4 years. According to Kormelinck (2012), new plantings should be made on a continuous 3 year rotation to maintain production. He further
4
does well in the upper midland to upper highland zones (1200-1800m) while as the yellow passion fruit does well in the lower midland to lower lowland zones (up to
1200m). Further, the fruit does well in optimum temperatures, where the production of purple and yellow passion is between temperatures of 18-25 degrees
Celsius and 25-30 degrees Celsius respectively, (Kormelinck, 2012).
According to Carvalho et al., (2011), in order to improve the profitability of yellow passion fruit cultivation, the development of technologies to increase yield
productivity, especially those pertaining to the mineral nutrition and irrigation and fertilization is essential. BAOBAB (2012), points out challenges that smallholder
farmers face in the production of passion fruit to be low volumes of produced fruits by individual smallholder which is uneconomical to sell individually;
pressure to sell to middlemen even at lower prices; poor post-harvest handling due to lack of skills and capacity to maintain good post-harvest quality; pests and diseases, particularly die back disease.
Smallholder farmers in Kenya begun growing passion fruit as a result of the support gained from the Kenyan government, private foundations and bilateral and
multilateral donors since the early 2000s. The gross value of an acre of passion fruit with a good harvest was estimated to be Ksh. 600,000 ($8,000), or 12 times
5
primary goal was to encourage farmers to produce more mangoes and yellow passion fruits which can access international markets with required residue levels.
Karuga (2013) states that yellow passion fruit farmers have realized higher profits due to lower growing costs since the purple passion fruit requires spraying six
times each fruit season, compared to three times a season for the yellow variety. The new variety has doubled fruit incomes, with industrial fruit processors opting for the yellow passion fruit over the purple passion fruit because it is sweeter, less
acidic and bigger with more juice.
1.3 Institutional Arrangements
The horticulture sector which is made up of fruits and vegetables is characterized by a wide array of institutional arrangements such as smallholder farmers selling
in spot markets, implicit and explicit contracts, personalized relationships with traders, farmer organizations, medium and large scale farming and vertically integrated producer-exporter relationships. Therefore, the Kenyan government has a role of facilitating institutional innovation by providing market information,
establishment of standards, provision of extension services and in the mediation of disputes, (Minot & Ngigi, 2004)
6
improve the conditions of passion fruit farmers. Some of the institutions that are working with smallholder passion fruit farmers in Embu County include East
African Growers Ltd (EAGA), through a project called „fruit quality enhancement project’ which they implemented by the support of Kenya Business development
Services Program (KBDS Kenya), funded by USAID; where HCDA acted as a regulatory body overseeing signing of contracts, (Strohm et al., 2006). Further; according to Strohm et al., (2006), farmers signed a one year contract with EAGA
Ltd which set a fixed price for passion fruits that meet quality requirements. EAGA Ltd paid the farmer groups fortnightly by cheque (but sometimes also in
cash) based on the produce collection note. Collective action is another form of institutional arrangement in the fruit sub-sector more so in the passion fruit industry. Most farmers participate in collective action/institutional arrangements
that help them to reduce transaction costs where the government is not involved in the marketing of horticultural products, (Ondieki et al, 2013). In a study by
Ondieki et al., (2013), eight institutional arrangements were identified in Kirinyaga County. These arrangements were found to be characterized by spot markets to contractual forms of relation and farmers participated in them as
individuals or as part of a group.
According to USAID (2014), most of the services such as extension services and
7
public and private sector partnerships with local NGOs, Universities, government agencies, input suppliers, processors and exporters.
1.4 Marketing of passion fruit
Poor market access by cereal and passion fruit farmers has consistently denied
producers profits while as middlemen and brokers have emerged as the most beneficiaries. In most rural set ups, farmers organize themselves into commodity groups that help them in bulking their produce, bargaining collectively and
negotiating for better prices for their produce. Through these groups, farmers achieve economies of scale further reducing transportation and handling costs for
the individual farmers, (BAOBAB, 2012).
According to Kormelinck (2012), East African Growers (EAG) Ltd. a private
company that deals in the exportation of horticultural produce, developed contractual relations with a passion fruit farmers‟ group in Migori County.
Through this relation, the firm guarantees the group a ready market at a competitive price. It provided market linkages, inputs and logistics to the passion
fruit farmers. Further, Kormelinck (2012) pointed out that the firm had a demand of 16 tons weekly of the passion fruit group, whereas the contracted farmers could
8 1.5 Marketing information
In Sub-Saharan Africa where smallholder farmers are the majority that live in
isolated rural areas; they lack access to markets for their produce and are deprived of agricultural marketing information. These farmers also have limited technical
skills, poor access to information and training that can help them boost their marketing capabilities. The access of agricultural markets and marketing information is very essential in promoting competitive markets and improving the
agricultural sector, (Magesa et al, 2014). According to FAO (2011), farmers‟ throughout the world‟s need for information to ensure effective and profitable
marketing is great.
This is because information enables farmers to plan their production more in line
with market demand, plan their harvest schedules at the most profitable periods and also make decisions on which markets to send their produce; plus also enhance their negotiations for better prices with traders, (Magesa et al., 2014). The
provision of basic marketing information aims at increasing the efficiency of agricultural markets and contribute towards mitigating the issues associated with
market failure based on asymmetric access to basic market information, (Ferris et al, 2008).Therefore the lack of marketing information contributes to failure by
9
According to FAO (2011), farmers can use marketing information to reduce risks associated with marketing by knowing prices which in turn helps in deciding if it
is worth in sending their produce to the market; decide whether to sell or store the produce or not as they wait for better prices; and where to sell and check on the
prices he or she is getting. Marketing information also helps farmers in deciding whether to grow-out-of-season by using modern technologies which offer opportunities to harvest when prices are highest and also in deciding whether to
grow different crops. According to Shepherd (1997), farmers with good information can compare the prices they are being offered by middlemen at the
farm gate with those in the market. Further, price information is more important to those farmers that send their produce “on consignment” to agents and or whole
sellers in the market thus enabling them not to get conned by agents or
wholesalers. According to (FAO, 2015), efficient market information has great benefits to farmers, traders and policy makers. If the information is up-to-date, it
has the capacity to facilitate spatial distribution of agricultural products from rural areas to urban areas and between urban markets. This is through the sending of price signals from urban traders or consumers to rural producers concerning
quantities and varieties required.
Dissemination of price information and market news is achieved through various
10
(Shepherd, 1997). According to (Svensson & Yanagizawa, 2008), due to up-to-date market information aired on radio, traders in Kawangware relayed the
information to farmers in Timboroa in Kenya which saw a large supply of potatoes from Timboroa the following market day. Further, one trader observed that
farmers were fixing prices on the information obtained from the broadcast.
1.6 Agribusiness Financing
In the Kenyan agribusiness subsector, smallholder farmer financing is one of the factor that limits increased productivity, production and profitability. Agricultural
credit is important as it enables farmers to purchase inputs, adoption of technology and finance production activities leading to increased farm income. According to Yegoh (2014), agricultural credit is considered a temporary substitute for lack of
personal savings by farmers that acts as a catalyst in the process of agricultural production and productivity. In past studies done, it has been shown that the
growth rate of agricultural investment is less compared to the growth rate of other economic sectors hence implying that agricultural financing can be a crucial factor
needed to develop rural agricultural economies in developing countries, (Yegoh, 2014).
In Kenya, credit-based arrangements with marketing and processing companies
can serve as an important element in improving the chances of smallholders to participate in the production of high value crops,(IFAD, 2003). Therefore, the use
micro-11
finance institutions, banks, farmer groups, marketing or processing companies is essential in improving farm incomes and farmer living standards. However, the
literature does not show whether sweet yellow passion fruit farmers do get credit or not.
In EmbuCounty, sweet yellow passion fruit farming is of great importance as it provides a means of livelihood in the semi-arid area. This has made some organizations to start programmes that support farmers so as to make passion fruit
farming worthwhile as well as profitable. These organizations such as Kamurugu development initiative located in Mbeere South, offer training in areas such as
group organization, value addition, and improved production skills with the sole aim of accessing the available markets for better returns. These efforts point
towards the elimination of constraints that smallholder sweet yellow passion face with the goal of helping them reap from sweet yellow production. Further, the development of a passion fruit supply chain is very important as it affects a farmer‟s profits. Smallholder farmers are faced with the choice of choosing one
market channel against another since they offer different prices. The channels also
expose the farmers to transaction costs such as searching for the best channel/buyer and bargaining for the best price. Socio-economic factors such as aging, group membership also affect a farmer‟s yields, (Minai, 2014). These
12 1.7 Statement of the problem
Passion fruit has emerged as an important high value horticultural crop in Kenya. The sweet yellow passion variety has beenadopted in Mbeere South sub-county
due to its adaptation to the hot arid conditions, it‟s tolerant to moisture stress, pests and diseases and a ready market for the fruit. The potential for passion fruit to
create more employment opportunities, create wealth as well as improve the livelihoods of smallholder farmers and other value chain actors in Embu County is enormous.Despite much promotion by extensionists, farmers have been dropping
the enterprise due to dismal profits.The cause of the varying profits has not been empirically established.Therefore to gain an understanding on the performance
efficiency of smallholder sweet yellow passionfruit farmers, this research will seek to assess the profit efficiency levels of farmers in Mbeere South as well as the
identified socio-economic and institutional characteristics which could be causing profit efficiency variation.
1.8 OBJECTIVES
General objective
The overall objective of this study was to assess the socio-economic and
institutional factors that affect profit efficiency of smallholder yellow passion fruit farmers in MbeereSouth, Embu County.
13
1. To analyze profit efficiency of smallholder yellow passion fruit farmers in Mbeere South, Embu County.
2. To determine the influence of socio-economic and institutional factors to profit efficiency of smallholder yellow passion fruit farmers in Mbeere
South, Embu County.
3. To measure the use of agricultural credit among smallholder yellow passion fruit farmers in Mbeere south, Embu County.
1.9 Hypotheses
1. There is significant difference in the profit efficiency levels of sweet yellow passion fruit producers in Mbeere South Sub-county .
2. Socio-economic and institutional factors have a significant influence on
profit efficiency of yellow passion fruit production and profitability.
1.10 Research question
1. What is the number of smallholder yellow passion fruit producers that use agricultural credit in their sweet yellow passion fruit production activities?
1.11 Significance of the study
Despite the economic potential of sweet yellow passion fruit and its ability to generate income and create employment for the rural women and youths in the
14
which will be essential in the fight against hunger, poverty and unemployment by contributing to policy in the sub-sector. The findings will indicate the profit
efficiency levels that the efforts to promote passion fruit production and marketing by the KAPAP project have achieved. This information will be useful to farmers
15
CHAPTER TWO: LITERATURE REVIEW
2.0 IntroductionThis chapter reviews relevant literature that is important for the purposes of this study. The reviewed literature covers the major issues in yellow passion fruit farming as well as methods of measuring profit efficiency plus also identifying the
causes of profit inefficiency. Acritical review of empirical studies on profit efficiency is also included. Thence, the research gap is eventually identified.
2.1 Approaches used in efficiency
Efficiency is estimated through the use of two different methods. These methods
can either be deterministic where all deviations from the frontier are attributed to inefficiency or stochastic which has the capacity to allow for the discrimination
between random errors and differences in inefficiency.
According to Kibaara(2005), a serious criticism of the deterministic frontier model
is that there is no account taken of the possible influences measurement errors or other statistical noise might have upon the frontier and therefore all deviations from the frontier are assumed to be as a result of inefficiency of the firms being
considered. This therefore ignores the possibility that a firm‟s performance could be affected by factors that are beyond the firm‟s control. This then will result in
efficiency estimates being lower than those estimated by a stochastic frontier, because the estimates will be estimated in such a fashion that no output values may
16
Therefore in this study, stochastic frontier approach was selected due to its ability to take measurement errors or other statistical noise into account when estimating
efficiency.
2.2 Measurement of profit efficiency
According to Ali & Flinn(1989), profit efficiency is the ability of a farm to achieve the highest possible profit, given the input prices and levels of fixed factors.
According to Abdulai & Huffman (1998), the concept of efficiency has three components: technical, allocative and economic. Technical efficiency is defined as
the ability to achieve a higher level of output given similar levels of inputs. Allocative efficiency deals with the extent to which farmers make efficiency decisions by using inputs up to the level at which their marginal contribution to
production value is equal to the factor cost while on the other hand; technical and allocative efficiencies are components of economic efficiency. Rahman (2003)
explains out that the concepts of allocative and technical efficiency are measured by the use of a frontier production function which can be deterministic or
stochastic. A deterministic frontier production function explains that all deviations from the frontier are attributed to inefficiency where as in the stochastic frontier production function; it is possible to discriminate between random errors and the
differences in efficiency. Therefore, the profit function approach combines the concepts of technical, and allocative efficiency in the profit relationships and any
17
It has been argued that using a production function approach to measure efficiency may not be appropriate when farmers face different prices and have different
factor endowments, therefore the estimation of efficiency should incorporate farm-specific prices and levels of fixed factors (Ali & Flinn, 1989). According to
Battese & Coelli(1995), the stochastic profit function is one of the models that measure profit efficiency. The advantage of this model is that it allows the estimation of farm specific efficiency scores and the factors explaining the
efficiency differentials among farmers in a single stage estimation procedure. This is done in a two stage method, with the first being the estimation of the efficiency
levels on farmer characteristics to explain the differences in efficiency, (Abdulai & Huffman, 1998).
2.2 Critical review of empirical studies on factors influencing profit efficiency One of the studies done in Kenya on profit efficiency was on milk by (Nganga et
al, 2010), which was mainly concentrated in the Central province of Kenya, one of the highest milk producing regions in the country. In this study, profit efficiency
level was estimated at 60% using the stochastic profit frontier model. The farm specific variables that explained inefficiency were farming experience, a higher level of education, and farm size tended to be more profit efficient. This study
18
Ojo et al, (2009)in their study on small scale cowpea profit efficiency using stochastic profit frontier approach, found out that age of the farmer, farmer‟s
educational level, and farming experience in years significantly influenced profit efficiency level positively. However, the researcher in this study failed to assess
the implication of family size as compared to (Oguniyi, 2008) in his study on cocoyam where it was found that households with large family size exhibited higher profit efficiency in relation to small households.
In the study of rice farming in Bangladesh, Rahman(1996) found out that the mean level of profit efficiency was 77% among the Bangladeshi rice farmers. The
efficiency differences were explained largely by infrastructure, soil fertility, experience, extension services, tenancy and share of non-agricultural income.
Farmers who owned their own land were more profit efficient at 78% compared to 76% those with leased land. Farmers who used developed technologies and those that were located at fertile farms, had access to extension services, had more
experience were more profit efficient compared to those that were not. This study however did not investigate whether the size of farmers‟ households had an
influence on profit efficiency of the enterprise as compared to (Nmadu & Garba, 2013).
19
with Ali & Flinn(1989); andRahman(2003) who found that off-farm income, training (extension), higher number of years spent in school by the farmers had a
positive impact to profit efficiency. This study also failed to find out whether the farmers had access to/use of agricultural credit, since the cost of inputs was found
to have a negative effect on profit efficiency.
Ogunniyi(2011) in an analysis of profit efficiency of maize in Oyo state, Nigeria used a stochastic frontier profit function. The study results reported profit
efficiency levels of the farmers between 1% and 99.9% with a mean of 41.4 percent. The determinants to the profit efficiency were found to be education,
experience, and non-farm employment. This is due to the fact that farmers with higher education tend to be more profit efficient than those that are not since they
are able to read and get information on agricultural trends and new technologies; further, farmers with more experience and off-farm income tended to be more profit efficient since more income makes it possible to purchase inputs for
production. These study results were consistent with those of (Rahman, 2003).
Karafillis & Papanagiotou(2009) in a study on innovation and profit efficiency on
olive farmers used a stochastic frontier profit function: translog approach. The study results showed a mean profit efficiency level of 61.5% which increased
20
In the study of impact of infrastructure on profit efficiency of vegetable farming in west Java Indonesia by Rachmina et al., (2014); it was found out that factors
affecting vegetable farming profits were seed price, chemical fertilizer price, wage and non-land capital accumulation. In this study profit efficiency level was found
to have an average of 53%.This study however failed to look at institutional or socio-economic factors that could be influencing the profit efficiency levels of the farmers.
Tuffour(2014)assessed profit efficiency of broiler production in Accra, Ghana. The results indicated a mean profit efficiency level of 54% among the commercial
broiler producers in the Accra region of Ghana. Further, farm experience was revealed to significantly reduce economic inefficiency thereby increasing
efficiency whilst sole-proprietorship status of the farmer was found to significantly increase economic inefficiency thereby decreasing economic efficiency. However, factors such as credit access, marketing information access, and trust on trader
price and group membership were not included in the study as part of factors contributing to inefficiency.
In another study by Kolawale (2006) to analyze the determinants of profit efficiency among small scale rice farmers in Nigeria, he used stochastic frontier
21
Most recently,Bamiro et al., (2013) in the study of poultry profit efficiency in Peri-urban Lagos, Nigeria employed translog profit frontier model. Profit efficiency in
the study ranged from 11-97% with a mean of 72%. Further, the results revealed that gender, family farm, finance, fulltime employment, and number of broilers
significantly determined profit efficiency. In the study, the researcher did not specify which kind of finance was used either borrowed, from savings or from sale of poultry and its products.
In Malawi, Assa et al (2012) employed stochastic frontier analysis to measure the profit efficiency of sampled Irish potato farms and to assess the determinants of
profit inefficiency in the Dedza district of Malawi. The efficiency indices ranged from 0.31 to 0.99 with an average of 0.74%. The study found variables such as
farming experience, frequency of weeding, degree of specialization, extension visits, credit status and non-farm employment to negatively influence profit inefficiency; these results were consistent with those of Abdulai & Huffman,
(1998)where as age affected profit inefficiency positively which is consistent with the findings of Abu et al.,(2012), and (Mussa et al., 2012).
Minh & Long (2009) undertook a study to determine efficiency estimates for the agricultural production in Vietnam where they employed the use of parametric and
22
efficiency. This study however did not employ stochastic frontier analysis approach to determine efficiency. The study also failed to undertake an analysis of
factors that could be influencing inefficiency in the study area.
Okoruwa et al.(2009) in the study of relative economic efficiency of farms in rice
production where they used a profit function approach in North Central Nigeria. The study findings showed sex/gender and rice production system to significantly influence economic/profit efficiency. The two variables negatively influenced
inefficiency. The study however did not analyze the influence of credit access and use, group membership and trust on trader price‟s influence of inefficiency.
2.3 Criticism and research gap
In view of the reviewed literature, no study has been found to have assessed profit efficiency and socio economic and institutional factors such as credit access and use, trust on trader price, market information access and use, market channel,
farming experience and extension contact influencing profitability of sweet yellow passion fruit. Most studies done on passion fruit in the previous past had been on
diseases and pests affecting the crop, production and technical efficiency. These studies include Wangungu (2013),Karani(2013), Ramos et al., (2012) and (Saptarini et al, 2013).
23
causes of profit inefficiency, marketing channels preferred by the producers, as well as identified institutional attributes of the farmers.
2.4 Theoretical framework
The theoretical framework is based on the stochastic profit frontier approach in the examination of smallholder farmers‟ profit efficiency of sweet yellow passion
fruit.
Kolawole (2006), defined profit efficiency as profit gained from operating on the profit frontier while taking into consideration farm-specific prices and other
factors. The technique that was applied in this study included stochastic frontier profit function which was in line with Nmadu & Garba (2013), Ojo et al (2009)
and Oguniyi (2008) who adopted Battese & Coelli, (1995)‟s model to postulate a profit function that is assumed to behave in a manner consistent with the stochastic concept. According to Nmadu and Garba (2013), the model commences by
considering a stochastic profit function with a multiplicative disturbance term of the form:
Π = f(Pi,Zikβi)ei(Ei)……… (1)
Where; Π = normalized profit defined as gross revenue less variable cost divided
by output price, Pi= normalized price of variable inputs by the farm divided by
24
ei= error term used, Ei= stochastic disturbance term consisting of two independent elements v and µ.
Where; Ei = vi+µi……….. (2)
vi‟ is assumed to be independent and identically distributed random errors having normal N (0, σ²) distribution independent of the µi while the µi is the one-sided
disturbance form used to represent profit inefficiency and is assumed to be
non-negative truncation of the half normal distribution N (µ , σ²µ).
Nmadu and Garba (2013), the model can be used to estimate the individual profit efficiency of the respondents as well as the determinants of profit efficiency. The
frontier of the farm is given by combining equation 1 and 2 as presented in equation 3:
Π= f (Pi, Zik, β) e(µ+𝑣)……….. (3)
The profit efficiency of an individual farmer is defined as the ratio of predicted actual profit to the predicted maximum profit for a best practical passion fruit
farmer and this is represented in equation (4).
Profit efficiency (EΠ) = π =exp[π(p,z) exp (lnV) exp (lnµ)-θ ………(4) π𝑚𝑎𝑥exp [ π(p,z)] exp (lnV)θ
Where π= predicted actual profit, π𝑚𝑎𝑥 = predicted maximum profit.The profit
25
function of µi and vi. The profit efficiency E(π) takes the value between 0 and 1.
Therefore if iµ=0, that is lying on the frontier, the farmer has potential maximum
profit given the price he faces and the level of fixed factors of production, while if µi>0, the farmer is inefficient and operates on lower profit as a result of
inefficiency.
Following Nmadu and Garba (2013), Coelli and Ojo et al (2009), the stochastic frontier function with behavioural inefficiency components will be used to
estimate all parameters together in one step maximum likelihood estimation procedure. The explicit Cobb-Douglas functional form for the yellow passion fruit
producers in the study area will be therefore specified explicitly as presented below in equation (5):
Lnπ = βo+β1lnZi+β2lnP1𝑖+β3lnP2𝑖+β4lnP3𝑖+β5 lnP4𝑖+ β6 lnP5𝑖+ (vi- µi)………..(5)
Where π= normalized profit function computed as the total revenue less variable cost per output price, Zi= farm size (ha), P1= normalized price of fertilizer (Kshs),
P2𝑖= normalized price of labour (Ksh per man day of labour), P3𝑖 =normalized
price of seed (Kshs per Kg of seed), P4𝑖= normalized price of agrochemical (Kshs
per litre of agro-chemical), P5𝑖= normalized price of irrigation (cost of irrigation per day), βo=Intercept/constant, β1-β6= parameters to be estimated, µi=
26
the profit inefficiency effects which are assumed to be independent of vijs such that µij‟s are the non-negative truncation (at zero) of the half normal distribution
with mean µi and Variance (σ²v). Where µi is defined by the following equation (6):
µi=δ0+δ1G1𝑖+δ2G2𝑖+δ3G3𝑖+δ4G4𝑖+δ5G5𝑖+δ6G6𝑖+δ7G7𝑖+δ8G8𝑖+δ9G9𝑖+δ10G10𝑖+ δ11G11𝑖+δ12G12𝑖 … (6)
Where µi= profit inefficiency of the ith farmer, G1𝑖= age of the ith farmer in years,
G2𝑖= level of education of the ith farmer (years spent in school), G3𝑖= farming
experience of the ith farmer in years, G4𝑖= household size of the ith farmer, G5𝑖=
extension contact and use ( number of meetings during production), G6𝑖= Gender (I for male, 0 for female), G7𝑖= credit status of the ith farmer(1 for access, 0 for
otherwise), G8𝑖= Status of membership to a group or cooperative society of the ith
farmer (1 for membership,0 for otherwise)δ9G9𝑖= Trust on trader price, δ10G10𝑖=
Access to market information, δ11G11𝑖= Access to off- sweet yellow passion farm
income, δ12G12𝑖= Market channel, ,. δ1𝑖-δ12𝑖= Unknown parameters to be
27 1.5Conceptual Framework
Input – Output Direction of influence
Influence effect
Figure 1: Conceptual Framework
Source: Modified from Cobb and Douglas (1928), Sibiko (2013) and Karani (2013) Policy outcome
Production factors:
Cost of fertilizer, cost of
agrochemical, cost of seedlings, cost of labour, cost of irrigation water, farm size
Socio economic factors: Age of the farmer, household size, level of education, sex, access to off- sweet yellow passion income,
Institutional attributes:
Credit access and use, Trust on trader price, market information access, market channel, farming experience, extension contact, group membership
Productivity levels
Profit Efficiency Levels
Significantly improved incomes
28
The above conceptual framework was based on the production theory, by applying the stochastic frontier profit function. The conceptual framework was organized in
stipulations of feedback and influence mechanisms of farm level profit efficiency levels. It focuses on input-output transformation efficiency, policy
recommendations, and effects. The production factors ( price of seedlings, farm size, price of fertilizers, price of agrochemicals, expenditure on labour and cost of irrigation) were used as inputs in the sweet yellow passion fruit production
activities. It was therefore expected as more inputs were applied by a farmer; fruit yields would increase but on the other hand result to a negative effect in cases of
overuse. Optimality was therefore a crucial factor in deciding the level of inputs that were to be applied. The profit efficiency levels were affected y the efficiency of production of a farmer. The socio-economic and institutional factors were expected to influence a farmer‟s efficiency. The socio-economic factors expected
to influence efficiency of a farmer included; age, household size, level of
education, gender, access to off-sweet yellow passion income, while the institutional factors included credit access and use, trust on trader price, market information access, market channel, farming experience, extension contact, and
group membership. The profit efficiency and its influencing factors were anticipated to influence policy which the study had proposed to recommend. The
29
also anticipated. The improved income levels among sweet yellow passion fruit farmers anticipated to have a feedback effect on profit efficiency, institutional and
socio-economic factors through improved and informed use of inputs, the alteration of the current socio-economic aspects of the farmers and institutional
30 CHAPTER THREE: METHODOLOGY 3.0 Introduction
This chapter highlights the important aspects of the research methodology for this study. This part covers the study area, the sampling design, research instruments, and data analysis. Further, this part identifies and justifies the study area selected
as well as the data analysis tools that were applied in the research.
3.1 Study Area
This study was carried out in Mbeere-South, Embu County which is among the major sweet yellow passion fruit producing Counties in the country. Sweet yellow
passion fruit is better suited in Mbeere South due to its reported adaptation to the climatic conditions in the area. The farmers in the study area face different
institutional and socio-economic factors which makes them more suitable for this study. The area is also one of the Counties selected for the implementation of the
KAPAP project which aims at improving incomes for smallholder farmers as well as other value chain actors through enhanced productivity of passion fruit. The various parameters that describe the county well are as shown in the following
31 Table 2: Description of the study area
Parameter Embu Source
Area (km2) 1,321.50 www.embu.go.ke2014
Altitude (m.asl) Above 1200 Kenya Decides
Rainfall in mm 500-1495 Kenya Decides (2012)
32
The above map shows the study area: Mbeere South Sub-county 3.2 Research design
This study used both primary and secondary data. In this study, smallholder farmers were considered in obtaining primary data. Primary data that was obtained from questionnaires was used to obtain information on institutional and
socio-economic characteristics of the producers. Secondary data was obtained from publications and institutions such as MoA and HCDA and was used for literature
review and in the discussion after data collection and analysis. Mbeere South was purposively identified as the area where this study wasconducted due to its favourable climate and also being the major area where the KAPAP project had
been implemented. A systematic random sampling method was used to select two locations from each division in the Sub-county. Systematic random sampling at an
interval of one respondent was used to select a sample from each division for the study that is every second sweet yellow passion fruit farmer was selected.
3.3 Sample size and Target population
The target population was defined by the smallholder farmers producing yellow
passion fruit mainly in Mbeere south, Embu County which was estimated to be less than 5000 yellow passion fruit farmers according to Kamurugu development
initiative field office statistics. In this study, the following formula was used to calculate the sample size(Kothari, 2004).
33 𝑒2
n= the desired sample size
q=1-p (1-0.05)
Z= the standard normal deviation at confidence level (95%) which is 1.96
e= acceptable error (precision)
P= is the proportion of the population with the desired characteristics in the target population which was 0.05 of the total population. The total population of Mbeere
South constituency was 130,185 (National census 2009). Therefore, from the above formula the sample size was determined as follows.
1.962 (0.05) (0.95) = 73 0.052
Computing the above equation gives an estimated sample size of 73. However due
to some cases of incomplete questionnaires the sample size was boostedto 90, to reduce cases of non-response and spoilt questionnaires. A total of 79 questionnaires were used in the analysis.
3.4 Data analysis
The sweet yellow passion fruit production data such as cost of inputs for agrochemicals, fertilizer, irrigation, labour, and seedlings; farm size, amount of
34
objective one which was to assess the profit efficiency of smallholder farmers. Famers‟ socio-economic and institutional factors such as gender, credit access,
membership to a group, trust on trader price, access to market information, market channel, access to off-farm income, extension contact, farming experience, age of
the farmer, level of education and household size data was collected to help in meeting objective two which was to determine the influence of socio-economic and institutional factors to profit efficiency.
Objectives one and two were analyzed simultaneously using stochastic frontier analysis (SFA) method by running the model on Frontier 4.1 version software.
Data for the first objective was analyzed using the Stochastic Frontier Profit function model to determine the relationship between profitability and output,
output price and input price. Profit efficiency of each selected farmer was also determined. Objective two was analyzed using an inefficiency model where profit inefficiency (µ) is the dependent variable while the inefficiency factors are the
independent variables.
Using Frontier 4.1 version software and STATA, the stochastic frontier profit
model that was used is as shown in equation 5:
Lnπ =lnβo+lnβ1Zli+lnβ2P1𝑖+lnβ3P2𝑖+lnβ4P3𝑖+lnβ5P4𝑖+lnβ6P5𝑖+ (vi-µi)………..(5)
35
π= normalized profit function computed as the total revenue less variable cost per
output price, Zi= farm size (ha), P1= normalized price of fertilizer (Kshs), P2𝑖= normalized price of labour (Ksh per man day of labour), P3𝑖 =normalized price of
seed (Kshs per Kg of seed), P4𝑖= normalized price of agrochemical (Kshs per litre
of agro-chemical), P5𝑖= normalized price of irrigation (cost of irrigation water in Kshs/litre), βo=Intercept/constant, β1-β6= parameters to be estimated, µi=
non-negative (Zero mean and constant variance) random variable called profit
inefficiency effect associated with the profit efficiency of the ith farmers. The Inefficiency model is as shown in equation 6:
µi=δ0+δ1G1𝑖+δ2G2𝑖+δ3G3𝑖+δ4G4𝑖+δ5G5𝑖+δ6G6𝑖+δ7G7𝑖+δ8G8𝑖+δ9G9𝑖+δ10G10𝑖+ δ11G11𝑖+δ12G12𝑖……(6)
Where:
µi= is the inefficiency of the ith farm
δ= Parameters to be estimated
Gis= The factors influencing inefficiency; these include gender, credit use,
membership to a group or cooperative, trust on trader price, access to market information, market channel, access to off-farm income, extension contact & use, farming experience, age of the farmer, level of education, household size. This
36
Lambda which is {σu/σv} was computed to evaluate the goodness of fit and also
to determine the correctness of the specified normal half-normal distribution assumption. Further, gamma {γ} also referred to as variance ration that is [σ2u/σ2u+σ2v] or [σ2u/σ2
] was computed to evaluate the inefficiency level in the
variance parameters that range from 0 to 1.
The analysis for objective one and two followed a three step estimation method using Frontier version 4.1 Software and STATA. The factors determining
inefficiency were estimated by the use of the Maximum likelihood estimation method (MLE) using the frontier model which is the second stage approach. The
MLE estimated all the parameters as it is mostly preferred due to its consistent estimates compared to Ordinary least squares (OLS)(Aigner et al, 1977). This was
by running a multi regression analysis of the variables influencing inefficiency using MLE approach.
Objective three was analyzed by using STATA to derive descriptive statistics to
measure.
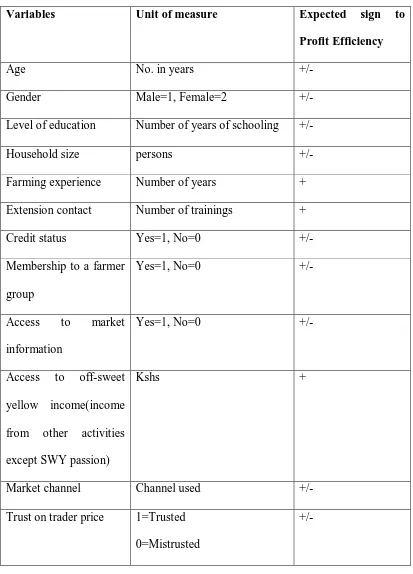
The description of the hypothesized signs of the inefficiency variables Gisand
37 Table 3: Hypothesized signs of variables
Variables Unit of measure Expected sign to
Profit Efficiency
Age No. in years +/-
Gender Male=1, Female=2 +/-
Level of education Number of years of schooling +/-
Household size persons +/-
Farming experience Number of years +
Extension contact Number of trainings +
Credit status Yes=1, No=0 +/-
Membership to a farmer group
Yes=1, No=0 +/-
Access to market information
Yes=1, No=0 +/-
Access to off-sweet
yellow income(income from other activities except SWY passion)
Kshs +
Market channel Channel used +/-
Trust on trader price 1=Trusted 0=Mistrusted
38 CHAPTER FOUR: RESULTS
4.0 INTRODUCTION
This chapter reports the results of the study. Descriptive statistics and statistical inference has been used in the analysis. The descriptive statistics results for the production, socio-economic, institutional characteristics and profit efficiency
scores are presented in this section. Further, validation tests, stochastic frontier profit function and the inefficiency model results are presented.
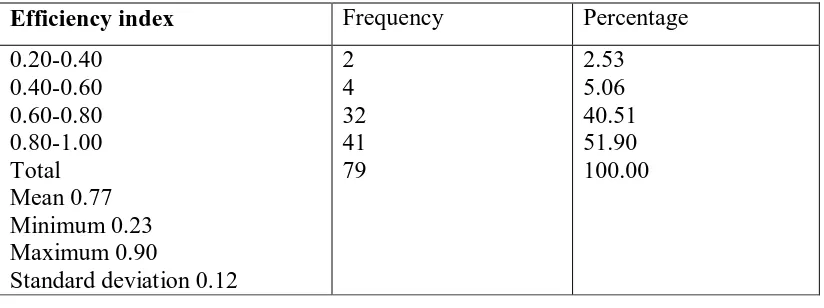
4.1 Profit efficiency descriptive results
The results of profit efficiency were analyzed and were computed by use of
frequency percentages as presented in table 4 and figure 5.
In the study, 51.90% of the farmers attained over 80% profit efficiency
levels. Only 2.53% of the farmers had recorded 20-40% profit efficiency levels, 5.06% of the farmers recorded a profit efficiency of 40-60% while 40.51%
recorded profit efficiency of 60-80%. From the table it is shown that the mean profit efficiency was 77%, minimum of 23% and a maximum of 90% respectively.
Table 4: Profit Efficiency levels
Efficiency index Frequency Percentage
0.20-0.40 0.40-0.60 0.60-0.80 0.80-1.00 Total Mean 0.77 Minimum 0.23 Maximum 0.90
Standard deviation 0.12
39 Source: Own survey, 2015
Figure 2: Profit efficiency range of sweet yellow passion fruit smallholder farmers in Mbeere South
4.1 Descriptive results of Socio-economic and Institutional characteristics of Mbeere South district
The socio-economic characteristics are age in years of the farmer, level of education, farming experience, extension contact, household size and non- sweet
yellow passion income (income from other activities apart from sweet yellow production).
The age of the head of a household is considered an important factor in efficiency determination, since it determines if a household benefits from the experience of an older person or base its decisions on a risk taking attitude of a younger farmer.
The age of the youngest farmer and the oldest farmer was 19 and 66 respectively.The mean age of the farmers was 43.09 implying that most farmers
2.53 5.06
40.51
51.9
20-40 40-60 60-80 80-100
percentage
P
ro
fit
Ef
fic
ie
nc
y
40
from the sample were middle aged. Approximately 25, 46, 29% were youths (19-35), middle aged (36-50) and the elderly (>50) respectively.
Table 5: Descriptive results of Socio-economic and Institutional characteristics of Mbeere South Sub-County
Variable Mean Std. Dev. Min Max
Age in years 43.09 12.19 19 66
Level of education (years of schooling)
10.20253 3.770261 0 16
Farming experience (years)
2.040633 1.163393 .11 6
Extension contact (number of trainings)
2.696203 4.389248 0 30
Non-passion income (KShs.)
32,565.82 56,796.06 0 400,000
Household size
(number of persons)
5.316456 2.267633 1 13
Source: Own survey 2015
The above table presents results for selected socio-economic variables descriptive
statistics.
Another characteristic of importance is the level of education attained by the head
41
number of years spent in school. The mean number of years spent in school was 10 years with a minimum of 0 and a maximum of 16 years. For 0 it means that some
head of households did not gain any formal education while 16 years means that somehousehold heads had completed university education. However, considering
the mean of 10 years, it means that most sweet yellow passion fruit farmers had acquired secondary school education basing it to the Kenyan education system. The respondents who were owners of sweet yellow passion fruit orchards
constituted 72.2% males and 27.8% females.
The average household size was 5 persons;the smallest household had 1 person
while the biggest household had 13 persons. The sampled farmers had a mean experience of 2 years farming experience on sweet yellow passion production, the
least being0.11 and the highest being 6 years‟ experience of farming sweet yellow passion fruit. The average number of trainings or average of extension contact attended by farmers was 2.69, with the least being 0 and the maximum being 30.
Sweet yellow passion fruit farmers were trained by governmental extensionists, farmer groups and Non-governmental extension officers such as the Wilmar
company extension officers in which they mostly sold their fruits to.
In Mbeere South Sub-County, 72.2% of the sampled farmers were male while
42
passion fruit farming activities. Of the 13% farmers who used credit; 5% accessed credit from throughlending models, 3% got their credit from microfinance
institutions, 2% from cooperative societies and the others from commercial banks. The farmers who never used credit in their farming activities cited various reasons
such as lack of collateral(23.9%), inaccessibility of credit (24.6%), high interest rates charged by banks (13%), lack of financial training (such as financial management) on credit (18%), 20%of the farmers did not feel the need for credit
in their sweet yellow production activities.These results helped in meeting objective three.
In the study area, 93.7% farmers had access to off-farm income (non-sweet yellow farm income), while 6.3% had no access. The off- farm income (non-sweet
43
Table 6: Off-farm (Off-swy) economic activities
Economic Activity Percentage
Miraa production 40%
Business 22%
Subsistence farming 19%
Formal employment 18%
Dairy farming 1.3%
The farmers engaged themselves in miraa farming to generate income. In the district, among the selected sweet yellow farmers; 39.7% were producing miraa,
21.8% were business people, 19.2% were subsistence farmers producing other crops such as maize, watermelons and tomatoes, 17.9% had formal employment
while 1.3% engaged in dairy farming.
Results indicate that 64.56 sweet yellow farmers were members to a farmer group
while 35.44 were non-members to any farmer group. The farming experience was averagely 2.04 years while the lowest experience in months was 11 while the
highest experience was six years. This can be attributed to the fact that sweet yellow passion fruit farming is a new passion fruit variety and technology that is being adopted by farmers as an agribusiness venture.Approximately 67% farmers
responded to have accessed agricultural marketing information in their agribusiness trading activities while the remaining percentage did not access any
44
3, it was found out that67% trusted accessed marketing information, and 33% mistrusted the accessed marketing information.
From the results, a high percentage of farmers trusted marketing information at 67%.
Figure 3: Trust on marketing information
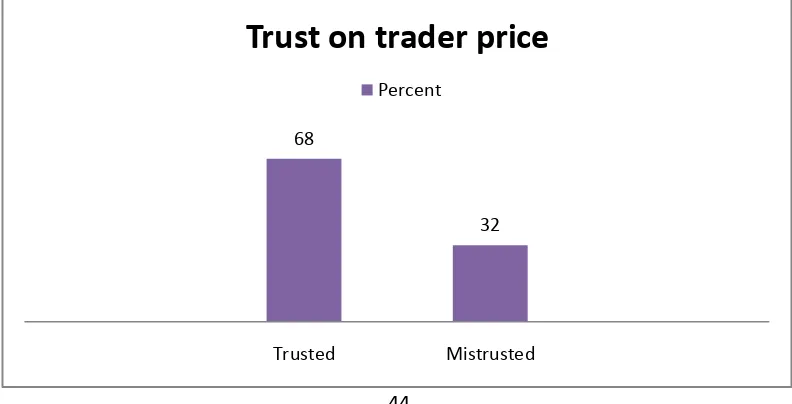
From figure 3, the study area farmers‟ trust on the prices was that68% % trusted
the prices while 32% mistrusted the prices. 67
33
Trusted Mistrusted
Trust to marketing Information
Percent
68
32
Trusted Mistrusted
Trust on trader price
45 Figure 4: Trust on trader price
Marketing channel
The results indicated that 68% passion fruit farmers sold their fruits to more than one buyer. The most popular channels used were contracted buyer (Wilmar),
middlemen and local buyers (at spot market) and sales at the farm gate.
Table 7: Marketing channel
Marketing channel proportion (%)Average price (Kshs) Home/farmgate 16.550
Middlemen 17.5 90
Spot market 17.560
Contracted buyer 47.486
Source: Own survey 2015
As shown in table 6: 47.4% of farmers sold their fruits to a contracted buyer
(Wilmar), 17.5% sold their fruits to middlemen and spot markets, while 16.5% farmers sold their fruits at the farm gate to neighbours. From the table, farmers got an average price of 50 Kshs at the farm gate, 90 Kshs from middlemen, 60 Kshs at
46
130Kshs while the average price was 76 Kshs. The best price was offered by the contracted buyer depending with the weight of the fruits of each farmer.
4.2 Normality Test
A kernel density function was plotted in Stata to assess the correctness of the normality assumption as shown in annex 3. A normal curve was then super imposed on the kernel density curve to test for normality as shown in annex 4.
Therefore, the normality figure in annex 2 is a confirmation that µ had a normal distribution. Profit efficiency estimation in the study was therefore made possible.
4.3 Determination of profit efficiency
Stochastic frontier profit function model results
In the stochastic frontier profit function model of the study area, farm size under sweet yellow passion, cost of fertilizer, and cost of seedlings variables were
significant. The log likelihood for the fitted model of the study area was -80.15 and the chi-square was 73.51 and strongly significant at 1% level. Farm size had a
positive and significant relationship with sweet yellow passion fruit normalized profit at 5% significance level. The cost of fertilizer and cost of seedlings both had
a positive relationship with normalized profit and were significant at 1% significance level. The cost of agrochemicals and the cost of irrigation had a negative relationship to normalized profit while the cost of labour showed a
47
The stochastic frontier profit function model results for Mbeere South district are as shown on table8 and annex 1.
Table 8: Stochastic frontier profit function results for Mbeere South Variable Coefficient Standard error P>t lnfarmsize.07** .03 0.035
lncosfertilizer.41*** .09 0.000 lncosagrochem-.05.100.589
lncosseedlings.35*** .09 0.000 lncoslabour.05 .070.479lncosirrigation-.10.12 0.411 cons8.12***.520.000
lnsig2v-1.76**.530.001 lnsig2u .37 .300.217 Variance parameters
Sigma_V{σv} .42 .11
Sigma_U{σu} 1.20 .18
Sigma2 {σ2} 1.61 .38 Lambda {λ}2.89
Gamma {γ} 0.89 Log likelihood -80.15 Mean Profit efficiency 77%
NB: Values in parentheses are t-ratios, ** significant at 5%, *** significant at 1%.
The profit efficiency (PE) of smallholder sweet yellow passion fruit farmers ranged from 23% to 90% with a mean PE of 77%in the study area.
48
lambda {λ} value was 2.894 while the estimated gamma {γ} was 0.894 as shown
in Table8 and Annex 1.
4.4 Factors influencing Profit efficiency among sweet yellow passion fruit farmers in MbeereSouth District
Farming experience variable was negative and significant at 5% while group membership variable was also negative but significant at 10% level of significance. Access to marketing information was negative and significant at 10% level of significance. In addition, age, level of education, extension contact, sex, market channel, and trust on trader price negatively influenced profit inefficiency. Household size, credit status and access to off- sweet yellow passion fruit income positively influenced profit efficiency.
Table 9: Inefficiency Model Results for Mbeere South
Variable Coefficient Standard error P-value Age -.07 .050.156
Gender -1.021.060.336
Level of education -.05.13 0.722 Household size.27 .18 0.145 Farming experience-1.19*.620.054 Extension contact-.13 .09 0.158 Credit status .67 1.15 0.559 Group membership-2.77*1.54 0.073 Trust on trader price.07.81 0.930
Access to market information -1.60*.94 0.091 Access to off-swy income 2.01 1.49 0.178 Market channel-1.10 1.03 0.288
49
4.5Comparison of Profit efficiency scores to selectedSocio-economic and Institutional Characteristics
The results of profit efficiency versus socio-economic and institutional characteristics are presented in table 10.
The age variable of farmers showed some different performance in terms
of profit efficiency. Farmers between the ages of 18-29 were the least profit efficientat 73.79% while farmers between the agesof 49-56 had the highest profit
efficiency level of 81.08% and were the most efficient. Male farmers had a profit efficiency of 79.34% compared to female farmers who had 70.43% profit efficiency; therefore male farmers were more efficient. Farmers who had formal
education and those without formal education performed quite differently in terms of profit efficiency levels. Farmers without formal education had the least profit
efficiency of 70.07%, those with primary education had 78.67% profit efficiency, those with secondary level education had 79.56%, those with tertiary (certificate/diploma) level of education had 75.91%, and those with university
level of education had 74.78% profit efficiency. This therefore clearly indicated that farmers with secondary school education were more efficient.
Farmers who were members of a farmers‟ group association were more profit efficient (81.08%) than those who were non-members (69.16%). Farmers