INVESTIGATION OF SIX ARRAY GEOMETRIES FOR FOCUSED ARRAY HYPERTHERMIA APPLICATIONS
K. H. Sayidmarie* and A. M. Abdulkhaleq
Department of Communication Engineering, College of Electronic Engineering, University of Mosul, Iraq
Abstract—The focusing properties of six array configurations in the form of square, square with interlaced elements, square ring, cross (+) shape, cross (X) shape, and square ring plus diagonals shape arrays are investigated. The performance parameters, such as field distribution in the focal region, size of the focal spot, depth of field, level of field at focal point, and sidelobe structure, are compared. Computer simulations using MTALAB environment are performed in
the investigations. The square ring and square ring plus diagonals
configurations show favorable focusing properties. The resultant field patterns will help to find the arrays usefulness for hyperthermia and imaging applications.
1. INTRODUCTION
The subject of focusing electromagnetic radiation has made significant advances in the last few decades. Increased interest has been shown, and diverse applications have been described. One of the applications is into non-contact microwave sensing where a confined focused beam is needed for precise sensing in industrial [1] and ground penetration
radar applications [2]. Microwave local hyperthermia has been an
important theme in medical applications, where localizing power in the tumor region without overheating surrounding normal tissues is to be achieved [3–6]. Another development incentive of this kind of antennas comes from the concept of wireless power transmission [7]. Phased array systems are interesting as they can offer flexibility and many degrees of freedom to the designers of the focused array systems. The array geometry, element spacing and applied excitation to the
Received 6 January 2012, Accepted 1 February 2012, Scheduled 8 February 2012
array elements have been utilized by the designers to optimize the performance of the focused array. The features of concern in focused arrays are: the size of the focused field (focal spot), in terms of the wavelength, in the planes parallel to as well as normal to the array, the shape of field variation along the normal to the array measured by depth of field (DOF) figure. The other feature is the sidelobe level of the pattern in the focal plane.
The required features from a focused array system can be different
for various applications. For industrial and underground imaging
systems, the focused spot in the plane parallel to the focused array should be as small as the required resolution of the system. However, in local hyperthermia applications, maximum power deposition is required across the tumor tissue without heating adjacent healthy tissues. The level of the field at the skin is of a major concern, and it should not exceed safety limits. With focused arrays this can be easily accomplished rather than by single antennas. On the contrary, RFID applications may not require minimum spot size at the RFID tag. One of the important requirements of the wireless power transmission systems is a precise and durable location of the focal spot, with low
sidelobe level, so that higher efficiency is achieved. The required
characteristics from a focused array depend on the array configuration
and the operating wavelength. Thus it is important to find which
configuration can accomplish the requirement at a given frequency. The imaging properties of three array configurations, filled planar, quad, and crossed array, have been studied for radar imaging applications [8]. The same array configurations were later investigated for focused local hyperthermia [9]. Their performances were compared under the two conditions of either equal number of elements, or equal size of the array, when investigated as focused arrays in lossy medium [9].
A small focused array antenna using microstrip 4 × 4 patch
elements to achieve the desired sidelobe levels in the Fresnel region based on Dolph-Chebyshev design was investigated, and the measured and computer calculated near fields were compared to verify the accuracy of the design [10]. Another recent application is into Radio Frequency Identification (RFID) readers systems, where it is required
to localize radiation within the wanted region. The performance
obtained from such reader using an 8×8 elements circularly-polarized
focused microstrip array operating in the (2.4–2.48) GHz was presented in [11].
The performance parameters such as field distributions around the focal point, size of focal spot, depth of field, level of field at focal point, and sidelobe structure are compared. Computer simulations using MTALAB environment are used in the investigations.
2. ANALYSIS OF FOCUSED ARRAYS
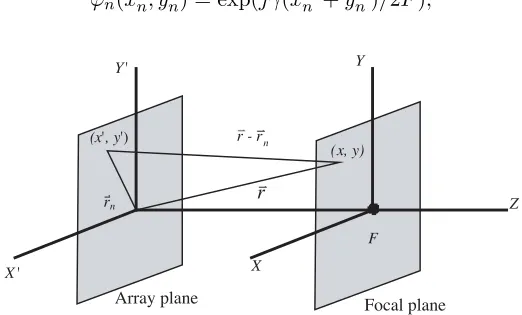
Figure 1 shows the geometry for a focused array in the near field region. An expression for the near field of the focused array can be derived following the analysis of Guo [12]. The antenna array is treated as localized current distributions due to small apertures. Then it can be shown that the normalized electric field is given by:
E(r) = N
n=1 Cn
r−rnexp[−jγ(r−rn)] (1)
whereγ is the propagation constant,r,rn,are vectors representing the
observation point and the center of thenth array element respectively
with respect to the array center, as shown in Figure 1. The factor
Cn=Inexp(jϕn) is the complex weighting of thenth element which is
necessary to focus the array. The phase ϕn is chosen such that the
elements of the array produce constructive interference at the design
focal point of distance F from array center. The In values are chosen
according to the required amplitude tapering to control the sidelobe level. In order to achieve a spot beam on the normal to the array at a
focal distanceF from the array antenna, the following quadratic phase
distribution need to be used [10, 13]:
ϕn(xn, yn) = exp(jγ(xn2+yn2)/2F), (2)
F (x', y')
Y' X' Z (x, y) Y X r
Array plane Focal plane
r - rn
rn
where (xn,yn) are the coordinates of thenth element of the array. Note that the phase factor in Eq. (2) has opposite sign to that in Eq. (1) to eliminate the quadratic phase term in order to achieve focusing of the radiated wave.
3. COMPUTER SIMULATIONS
A general computer program was written in MATLAB environment to calculate the electrical field distribution in the near field region of the array antenna. The six array geometries considered here are: filled
square, filled square with interlaced elements, cross (+) shape, cross (X) shape, square ring, and square ring plus diagonals shape as shown in Figure 2. In these arrays the vertical and horizontal separations between elements were kept equal to half wavelength, thus the number of elements in the six arrays will be quite different. The inputs to the general MATLAB program are the various parameters of the arrays, such as array type, number of elements at rows and columns, the spacing between elements, focal distance, as well as dimensions of the
investigated near field region. The program starts by calculating the phase excitations of the elements (according to Eq. (2)) required to
focus the beam at the given focal distance F. After that the field
distribution across the wanted region is calculated. The elements are
assumed to have uniform amplitude excitations (In= constant). The
calculated distributions are across the planes: parallel to the array, perpendicular to the array, and field variation along the normal to the array. Various important parameters characterizing the arrays can be found from these field distributions.
For a fair comparison of performances, each of the six investigated
arrays were assumed to have a common square size of 4.5 × 4.5
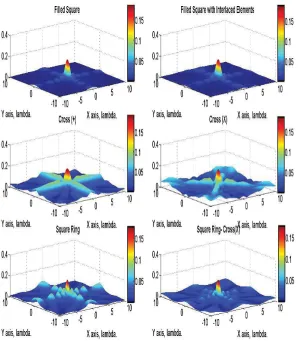
wavelengths, elements with spacing of half wavelength, and focal distance of 5 wavelengths in the first case of the comparisons. Thus the number of elements for the filled square, filled square with interlaced elements, cross (+) shape, cross (X) shape, square ring, and square ring plus diagonals shape arrays were: 100, 95, 20, 20, 36, and 52, respectively. Figure 3 shows normalized field variations across the focal plane (parallel to the array plane) at distance of 5 wavelengths from array, as obtained for the six arrays. The concentration of the radiated power at the center of the plane is evident. It can be seen that the field structures have even symmetry with respect to the principal axis. However the arrays having (X)-shape, and square-ring plus diagonals shape also show symmetry in pattern with respect to axes rotated by
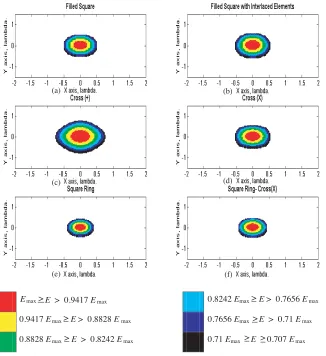
45◦ as compared to those of other arrays. In Figure 4 a closer look
at the field distributions is given, where the main beam, defined by
the field values ≥ 0.707 of the maximum value, is shown. It can be
seen that the filled array has a 3 dB spot size of 0.84λ×0.84λ, which
is close to the derived value for the 3 dB or Half Power Beam Width HPBW [13]:
HPBW = 0.866λF/D (3)
where D is the size of the array, F the focal distance, and λ the
wavelength. However, the ring array has achieved the smallest beam
size of (0.52λ×0.52λ ) followed by ring-X-shape array. Table 1 shows
detailed parameters of the arrays and of the field distributions across the focal region.
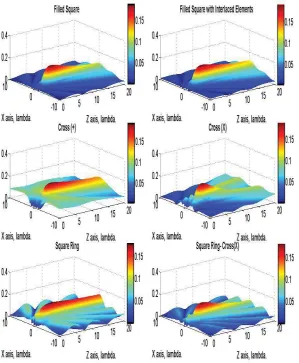
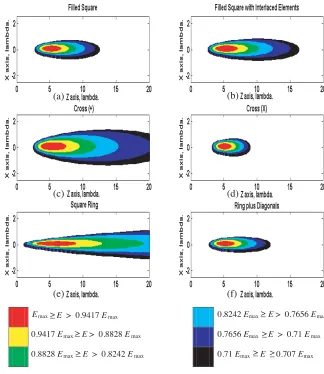
Figure 5 shows normalized field variations across the XZ-plane
(normal to the array plane) as obtained for the six arrays. The
concentration of the radiated power at the focus is evident. It can be seen that the field structures have even symmetry with respect to the normal to the array. In Figure 6 a closer look at the field distributions
is given where the field, defined by the values ≥ 0.707 maximum, is
Emax E > 0.9417 Emax 0.8242 Emax E > 0.7656 Emax
0.9417 Emax E > 0.8828 Emax 0.7656 Emax E > 0.71 Emax
0.8828 Emax E > 0.8242 Emax 0.71 Emax E 0.707 > Emax
>
>
>
>
>
>
(a) (b)
(c) (d)
(e) (f)
Figure 4. Normalized field in the main beam across the focal plane
(E≥0.707 Emax) at distance of 5 wavelengths from array, as obtained
for the six arrays: (a) filled, (b) interlaced, (c) (+)-shape, (d) X-shape, (e) ring, and (f) ring plus diagonals.
Table 1 shows detailed parameters of the field distributions across the focal region.
Figure 5. Normalized field variation across the plane normal to the array as obtained for the six arrays: (a) filled, (b) interlaced, (c) (+)-shape, (d) X-(+)-shape, (e) ring, and (f) ring plus diagonals.
decay. The X-shaped array has the fastest field decay. The obtained Depth Of Field (DOF) values of the investigated arrays are listed in Table 1. The DOF for the ring array was found to be 101 wavelengths. The DOF value is not evident on Figure 7 since the field does not decay
down to 0.707 Emax in the shown range of normal distance.
95, 20, 20, 36, and 52), the maxima of field at the focal points are expected to be also different, since a larger number of elements
is supposed to yield higher field level at the focal point. When
the achieved maxima are normalized to the corresponding number of array elements (dividing field maxima by number of elements in the corresponding array), the results were found almost equal and ranging between 0.1775 and 0.1925 for the six arrays at the focal distance of 5 wavelengths as shown in Table 1. These numbers should have a limit of
unity when the 1/r decay factor of the radiated field is neglected and
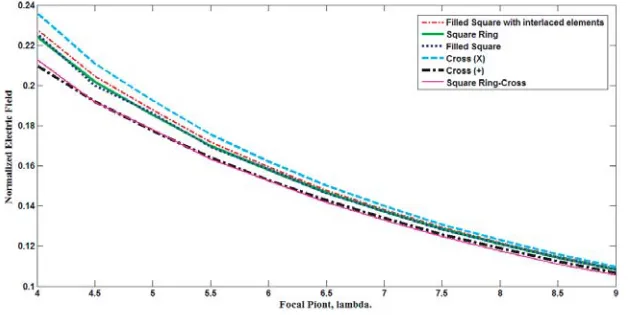
full constructive addition of the element contributions occurs. The variation of normalized maxima of field at focal points was plotted against the design focal distance as shown in Figure 8. The six arrays have the same trend of variation, and the overall variation has a form
close to 1/F. This result is due to the normal 1/rdecay of the elements
contributions at the focal point resulting in smaller maxima at farther focal points.
For further investigations, the six arrays, of size 4.5 × 4.5
wavelengths, were focused at various distances, and the Depth Of Field (DOF) was calculated. Figure 9 shows variations of the DOF with the design focal distance. It can be seen that the X-shaped array has the lowest value of DOF. The shown relations between DOF and focal distance exhibit relation similar to the parabolic function. Such a relation was derived for uniformly distributed filled array in [14] as :
DOF = 7λ
F D
2
(4)
where F is the focal distance, D is the size of array, and λ is the
wavelength. The DOF estimated by Eq. (4), assuming D= 4.5λ, was
calculated and plotted on Figure 9. It can be seen that it is close to
Table 1. Parameters of the investigated arrays for design focus at
F = 5 wavelengths, and array size of 4.5×4.5 wavelengths.
Type No. of
elements Peak/No. of elements Spot size (λ) DOF (λ) Sidelobe level (dB)
Filled 100 0.18538 0.84 9.09 12
Interlaced 95 0.18797 0.995 12.62 12.2
+ cross 20 0.19254 1.684 18.3 5.39
X cross 20 0.18634 0.951 5.44 5.27
Ring 36 0.17752 0.52 101 5.88
Ring plus
Emax E > 0.9417 Emax 0.8242 Emax E > 0.7656 Emax
0.9417 Emax E > 0.8828 Emax 0.7656 Emax E > 0.71 Emax
0.8828 Emax E > 0.8242 Emax 0.71 Emax E 0.707 > Emax
>
>
>
>
>
>
(a) (b)
(c) (d)
(e) (f)
Figure 6. Normalized variation of the field in the normal plane to
array as defined by (E ≥ 0.707Emax) as obtained for the six arrays:
(a) filled, (b) interlaced, (c) (+)-shape, (d) X-shape, (e) ring, and (f) ring plus diagonals.
level was calculated, and its variation for various focal distances is shown in Figure 10. It can be seen that the filled and interlaced square
arrays have sidelobes at around −12 and−13 dB below the maximum
at the focal point, approaching the limit of −13.4 dB of the uniform
array in the far-field. However, the cross(X), cross(+), and square ring arrays have higher sidelobes as these arrays have sparsely distributed
Figure 7. Normalized field variations along normal axis to the investigated arrays when they are focused at 5 wavelengths.
Figure 9. Variations of the depth of field with the focal distance for
the investigated arrays of size 4.5×4.5 wavelengths. The relation given
by Eq. (4) is also shown.
Figure 10. Variations of the sidelobe level with the focal distance for the investigated arrays.
4. CONCLUSIONS
The focusing properties of six array configurations in the form of square filled, square with interlaced elements, square ring, cross (+) shape, cross (X) shape, and square ring with diagonals arrays are investigated. The performance parameters, such as field distribution in the focal region, depth of field, level of field at focal point, and sidelobe structure, are compared. The arrays showed different performances, as the addition of elements contributions results in different distributions around the focal point due to various spatial array configurations. The square ring and square ring plus diagonals configurations showed favorable focusing properties. The ring array has slowest variation along the array normal followed by cross(+)-shaped array, however the ring array has the smallest spot size in plane parallel to the array. A good compromise between the required small focal spot in each of the parallel plane and perpendicular plane to the array was shown by the ring plus diagonals array. This array shows also about 9 dB sidelobe level, which is rather high, caused by the relatively small number of elements, as compared to those of the filled arrays. Such a level can be further reduced either by implementing aperture taper, or by using more elements. The resultant field distributions of the investigated arrays will help to assess the arrays usefulness for hyperthermia and imaging applications
REFERENCES
1. Bogosanovic, M. and A. G. Williamson, “Microstrip antenna array with a beam focused in the near-field zone for application
in noncontact microwave industrial inspection,” IEEE Trans.
Instrum. Meas., Vol. 56, No. 6, 2186–2195, Dec. 2007.
2. Daniels, D. J.,Ground Penetrating Radar, 2nd Edition, IET, 2004.
3. Anderson, A. P., et al. “Feasibility of focused microwave array
system for tumor irradiation,” Electronics Letters, Vol. 15, No. 1,
564–565, 1979.
4. Durney, C. H. and M. F. Iskandar, “Antennas for medical
applications,” Antenna Hand Book: Theory, Applications, and
Design, Ch. 24, Van Nostrand, New York, 1988.
5. Loane, J. T. and S. Lee, “Gain optimization of a near-field focusing
array for hyperthermia applications,” IEEE Transactions on
Microwave Theory and Techniques, Vol. 37, 1629–1635, Oct. 1989. 6. Iero, D., Isernia, T., and A. F. Morabito, “Optimal constrained
assessment on realistic phantoms,” Progress In Electromagnetics Research, Vol. 102, 125–141, 2010.
7. McSpaddan, J. O. and J. C. Mankins, “Space solar power programs and microwave wireless power transmission technology,”
IEEE Microwave Magazine, Vol. 3, No. 4, 46–57, Dec. 2002. 8. Bennett, J. C., et al., “A novel radar array and its imaging
properties,” IEEE Transactions on Antennas and Propagation,
Vol. 27, No. 4, 567–574, 1979.
9. Ismail, M. S. and K. H. Sayidmarie, “Investigation of three array
geometries for focused array hyperthermia,”Proceedings of ISAP
’92, Sapporo, Japan, 1992.
10. Karimkashi, S. and A. A. Kishk, “Focused microstrip array
antenna using a Dolph Chebyshev near-field design,” IEEE
Transactions on Antennas and Propagation, Vol. 57, No. 12, 3813– 3820, Dec. 2009.
11. Buffi, A., A. A. Serra, P. Nepa, H-.T. Chou, and G. Manara, “A
focused planar microstrip array for 2.4 GHz RFID readers,”IEEE
Transactions on Antennas and Propagation, Vol. 58, No. 5, 1536– 1544, May 2010.
12. Guo, T. C., et al., “A local field study of a water-immersed
microwave antenna array for medical imagery and therapy,”IEEE
Transactions on Microwave Theory and Techniques, Vol. 32, No. 8, 844–854, 1984.
13. Sherman, J. W., “Properties of focused aperture in the Fresnel
region,”IRE Transactions on Antennas and Propagation, Vol. 10,
No. 4, 399–408, Jul. 1962.
14. Graham, W. J., “Analysis: And synthesis of axial field patterns
of focused apertures,” IEEE Transaction on Antennas and