Unilateral Mini NMR Sensor Used for Assessing the Aging Status
of the Sheds of Composite Insulators
Yunfeng Xia1, Zheng Xu2, *, Jianhua Huang1, Jianhua Lin1, and Dengjie Yu2
Abstract—The number of composite insulators used in power transmission lines increases year by year. To detect and assess the aging status accurately concerns the security and stability of the power system. In order to achieve nondestructive testing of the sheds of composite insulators, a unilateral mini Nuclear Magnetic Resonance (NMR) sensor is proposed in this paper. The design of the magnet body and the optimization of the RF coil are presented. The Carr-Purcell-Meiboom-Gill (CPMG) sequence was employed to record the 1H relaxation curves of the sheds of three composite insulators from 110 kv lines with different service years. The curves were fitted to both single exponential function and inverse Laplace transformation functions. The results demonstrate that an increase of service year of the insulator results in a decrease of the effective transverse relaxation time (T2eff). It is indicated
that the sensor has a potential to assess the aging status of the composite insulators.
1. INTRODUCTION
Due to the light weight, excellent anti-flashover performance and high mechanical strength, composite insulators [1, 2] have been widely used in high voltage transmission lines. Composite insulators are typically composed of a central rod made of fiber reinforced plastic and an outer weather shed made of silicone rubber. The sheds therein are used for protecting the central rod from the moisture in the air and providing a sufficiently long leakage current path. In service under the power grid overvoltage and the corrosion of the natural environment [3, 4] (pollution, acid rain, high temperature, etc.), the surfaces of the sheds become sclerous and chalked over time and the hydrophobicity on which degrades. These phenomena will cause the decline of insulating performance of composite insulator sheds and frequent creeping accidents thus threatening the stable operation of the power system. Assessing the aging status of the sheds accurately and replacing the over-aged composite insulators in time are therefore critical to ensuring the safe and stable operation of the power system.
Several methods have been reported for assessing the aging status [5] of the sheds of composite insulators, such as direct observation method [6, 7], water spray classification [8–10], leakage current method [11–13], contact angle method [14], thermally stimulated current method [15–17], etc. Direct observation method and water spray classification are easily influenced by the subjective judgment of maintenance personnel and therefore unstable. Leakage current method is also unreliable since the factors affecting the current are complicated and random. Contact angle method and thermally stimulated current method are destructive and generally used for off-line measurements in laboratory. So far, there is no nondestructive method to assess the aging status of the composite insulator sheds accurately in practical engineering.
Traditional NMR technologies have been used to investigate the aging and degradation of polymer materials in laboratory [18]. Due to its portability and non-destructive, portable low-field NMR has been
Received 9 April 2015, Accepted 9 June 2015, Scheduled 19 June 2015
* Corresponding author: Zheng Xu ([email protected]).
1 Dongguan Power Supply Bureau, Guangdong Power Grid Co., Ltd., Dongguan 523000, China. 2 State Key Laboratory of Power
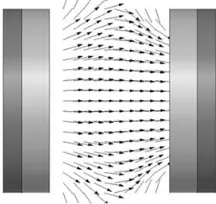
successfully employed for detecting the aging status of rubber materials [19] in practical engineering. In [20], our team has introduced a portable low-field NMR sensor for assessing the aging status of the sheds of composite insulators at project site. The measurement results show that the sensor can successfully distinguish the aging status of composite insulators with different service years. However, the static magnetic fieldB0 of the sensor is generated by two magnet discs (Figure 1), and the distance
between the two magnets needs to be adjusted according to the thickness of the sheds of different insulators. The RF circuit therefore has to be retuned since the distribution of B0 changes with the
distance, and it increases the difficulty of the measurement at project site. In addition, the B0 is very
inhomogeneous which results in low signal to noise ratio (SNR).
Figure 1. The structure of the magnet body of the portable low-field NMR sensor in [20]. The magnet body consists of two magnets, and theB0 is between them.
Since the aging status of the upper surface of the sheds is higher than the lower surface, the upper surfaces are more interesting for the measurements. To solve the above drawbacks of the portable low-field NMR sensor, we propose a unilateral mini NMR (UMR) sensor in this paper for investigating the aging status of the composite insulators. This UMR sensor has more uniformB0 and does not need to
adjust its structure in the measurements. To obtain high SNR, we also improve the structure of the RF coil. In the following text, the structure of the sensor, measurements on composite insulators and the results are described in detail.
2. UMR SENSOR
The sensor (Figure 2(a)) mainly consists of three cubic magnets, an aluminum shell and an RF coil with its tuning and matching circuit. The magnets are used to generate the static magnetic field B0.
The aluminum shell is to assemble the magnets, and the RF coil with its tuning and matching circuit is to transmit the excitation pulses and receive the NMR signals of the samples. An illustration of the UMR sensor testing the composite insulator sheds is shown in Figure 2(b).
(a) (b)
2.1. Structure of the Magnet Body
It is well known that more uniformB0means more hydrogen excited so that higher SNR can be obtained.
The aim of the design of magnet structure is to generate a relatively homogeneous B0. Meanwhile, for
a non-destructive measurement at project site, we must take the portability into account during the design process of the sensor. In this work, the magnet structure (Figure 2(a)) of the sensor was designed to consist of three magnet blocks (SmCo YXG-32L, Shanghai CJ Magnet Industry Co., Ltd.) with the same size. In consideration of the distance between the two adjacent sheds and the size of sheds, the dimension of each magnet was set as 10 mm (y)×10 mm (z)×30 mm (x).
As shown in Figure 2(a), the magnetization orientation of the magnets was fixed. The relative position of the three magnets was adjusted to optimize the homogeneity of the B0 in the region of
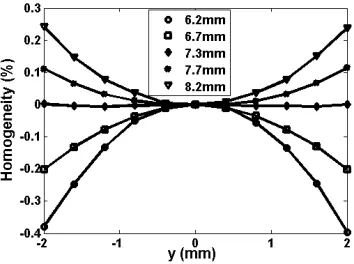
interest (a 4 mm×4 mm×4 mm area which is 5 mm above the surface of the central magnet), and the optimal structure of the magnet body was determined after. The optimization process was described in the reference [21] in detail. For the optimal magnet structure, Figure 3 shows the variation of B0
along y axis at different z simulated by Maxwell 3D (Ansoft, Pittsburgh, PA, USA). It can be seen that the B0 along y axis at z = 7.3 mm is the most homogeneous. Thus, we chose the xy plane at
z= 7.3 mm to be the optimal plane for the upper surface of the test sheds and the orientation ofB0 on
this plane is alongy axis. Figure 4(a) shows the distribution of the simulatedB0 on the optimal plane,
and Figure 4(b) is onxz plane at y= 0 where the homogeneity is 0.5%.
Figure 3. The variation of the simulatedB0 alongy axis at different z when x= 0.
(a) (b)
Figure 4. (a) The distribution of the simulated B0 on the optimal plane. (b) The distribution of the
simulated B0 on xz plane at y= 0.
2.2. Design of RF Coil
As discussed above, the plane with most homogeneous B0 was 7.3 mm away from the surface of the
central magnet. Due to the RF fieldB1 decreasing rapidly with the distance from the surface of the RF
was then placed 6.8 mm away from the central magnet. A flat rectangular spiral coil was employed to generate B1 perpendicular to B0 (along y axis). TheB0 strength of the optimal plane was 117.83 mT,
according to Larmor formula, and the excitation frequency was therefore set to be 5.017 MHz.
In NMR, when the other conditions such as the excited volume of the sample, the current through the RF coil and the static magnetic fieldB0 are the same, and the SNR can be expressed (Formula (1))
by the strength of B1 and the AC resistance of the coil [22]. Therefore, the performance of RF coil
directly determines the quality of the NMR signals.
SNR ∝ √B1
R (1)
Usually in UMR, the SNR is much lower than in the traditional NMR. In order to get reliable and stable results, the SNR of the measurements is desired to be as high as possible. In 2.1, the magnet structure was arranged to get the most homogeneousB0 in the region of interest, and in this section the
size and turns of the RF coil were adjusted to optimize the SNR. The distance between two adjacent wires and the width of the wires were fixed to be 0.5 mm.
Since there is no simple analytical relation among B1, R and the structural parameters of the
RF coil, we can only calculate B1 and R to optimize the structure of coil by simulating in Maxwell
3D separately. Figure 5 shows B1 distribution on the optimal plane of three RF coil with different
parameters. According to Formula (1), the SNR is proportional to the ratio of B1 to square root of
R. Therefore, the relative SNR of each coil can be calculated from the simulation results. BecauseB1
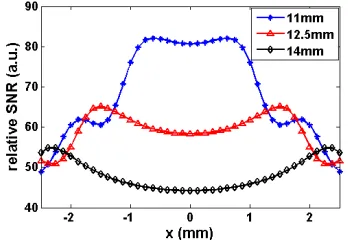
is symmetrically distributed on the optimal plane, Figure 6 only shows the relative SNR of the three coils along x axis. Comparing both the strength and homogeneity ofB1, it can be observed thatB1 in
Figure 5(b) is the best. The parameters of the optimal coil are as follows: the size is 12.5 mm×12.5 mm; the coil has two layers with 5 turns at each layer; the thickness of the PCB is 2 mm.
Figure 7 shows the orientations ofB0andB1on the optimal plane, and most ofB0are perpendicular
to B1 which means B1 efficiently used.
(b) (c)
(a)
Figure 5. RF field distribution on the optimal plane of three RF coils of different size with the optimal turns, (a) 11 mm×11 mm, (b) 12.5 mm×12.5 mm, (c) 14 mm×14 mm.
Figure 6. The relative SNR along x axis on the optimal plane of three RF coils of Figure 5 calculated from the simulation.
Figure 7. The orientations of B0 (blue) and B1
50 Ω C C coil L coil R C m t m
Figure 8. The tuning and matching circuit of the RF coil.
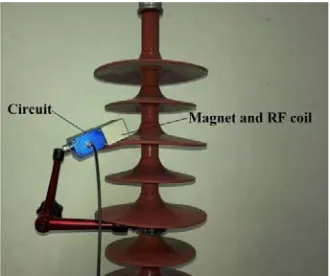
Figure 9. A photo of the UMR sensor (including the nonmagnetic clamp) measuring the shed of the composite insulator sample.
The impedance of the optimal RF coil was 0.486 +j11.18 ohms. A circuit (shown in Figure 8) was connected to the RF coil, and the composition of them was the RF probe. In order to guarantee the best excitation and reception, the resonance frequency of the RF probe was tuned to 5.017 MHz, and the impedance of the RF probe was matched to 50 ohms. For our RF coil, the capacitances Cm andCt were 310 pF and 1875 pF, respectively.
The optimized UMR sensor measuring the shed of the composite insulator sample is shown in Figure 9. The weight of the whole sensor (including the nonmagnetic clamp) is 0.556 kg and, the size is 13 cm×14 cm×5 cm which is compact and portable.
3. EXPERIMENTAL RESULTS AND DISCUSSIONS
All measurements were carried out with a Kea2 console (Magritek, Wellington, New Zealand), connected to a RF power amplifier (TOMCO Technologies, Australia) under the room temperature.
The test samples were the sheds of the composite insulators (used for 2 years, 8 years and 11 years) under 110 kv lines from the same area. Before the measurements, the surfaces of the samples were cleaned with detergent and dried. The employed pulse sequence was CPMG sequence [23] shown in Figure 10, wheredwas the pulse width, TE was the echo time,A180◦ andA90◦ were the power amplitude
of 180◦ pulse and 90◦ pulse.
In all the measurements, the parameters of CPMG sequence were kept the same as follows: dis 6µs, TE was 140µs, the number of echoes was 3000, the repetition time was 1.5 s,A90◦ was−20 dB and
A◦180 was −14 dB. For UMR experiment, due to the inhomogeneity ofB0, the peak envelop of CPMG
echoes (Figure 10) has exponential decrease with the efficient transverse relaxation timeT2eff.
90 o
180 o
Echo signa
RF pulse sequence
d
0.5 TE TE
Echo signal peak envelope
180 o 180
l
o 180 o
90 A o 180 A o
Figure 10. CPMG sequence employed for the measurements.
32 64 128 256 512 1024
0 10 20 30 40 50
Number of scans
SNR (dB)
Since the strength ofB0 of UMR is usually low, and the quantity of the excited hydrogen is small,
the number of scans of the measurements requires to be more than traditional NMR to get acceptable SNR. Theoretically the larger the number of scans is, the larger the SNR will be. But increasing the number of scans will also increase the measurement time, and long measurement time is undesirable in practical engineering. In order to research the relationship between the number of scans of the measurements and the SNR, we employed composite insulator shed serviced for 11 years as the sample. The CPMG measurements were taken with different numbers of scans, and the ratio of the average value of the first ten echo-peaks to the average value of the last ten echo-peaks was defined as SNR. Figure 11 shows the relationship between SNR and number of scans. It can be observed in Figure 11 that the increment of SNR was not much with the number of scans more than 128. So the number of scans was set to be 128 to get good SNR as well as acceptable measurement time.
The composite insulator samples were detected for three times respectively. Figure 12 shows the peaks of CPMG echoes from the composite insulator used for 11 years.
The measured echo amplitudes Mn of the CPMG sequence can be expressed in terms of the distribution of relaxation times [24], f(T2eff), by
Mn=
dT2efff(T2eff)e−nT E/T2eff +Noise (2)
whereTE was the echo time andnthe number of echo. The extraction of the distributionf(T2eff) from
the experiment data Mn is an ill-conditioned problem. The data processing of all the measurements was performed with the Contin program [25] which uses an inverse Laplace transform to yield theT2eff
distribution. The regularization parameter α was determined to be 1.32 from the L-curve method. Figure 13 shows theT2eff distributions of the three insulator samples. It can be observed that theT2eff
distribution curve of each sample has one peak which means only one main T2eff of each sample. We
considered the peak of theT2eff distribution curve was theT2eff of each sample.
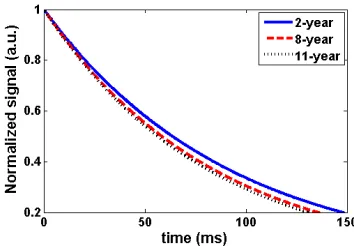
According to the results from the inverse Laplace transform, for the sake of simplicity, the CPMG decays of all the measurements were analyzed in terms of a single exponential fit (red curve in Figure 12):
M(t) =Ae−t/T2eff +Noise (3)
The results of all the measurements are demonstrated in Table 1. Figure 14 shows the normalized
Figure 12. The peaks (black dot) of the CPMG echoes obtained from the shed of the composite insulator used for 11 years, and the red curve is single exponential decay fitted from the peaks.
Figure 13. The T2 distribution obtained by the
inverse Laplace transform of the three samples.
Table 1. The results of all the measurements.
Service time AveragedT2eff Variation of T2eff
Figure 14. The exponential decay curves of the three insulator samples with normalized signal amplitude.
Table 2. T2eff of three simples obtained by single exponential fitting and inverse Laplace transform.
Service time T2eff-single exponential fitting T2eff-inverse Laplace transform
2 years 90.1µs 87.7µs
8 years 83.8µs 83.8µs
11 years 82.5µs 82.8µs
amplitude of the fitted exponential decay curves of the three samples. It can be obtained intuitively that the T2eff of the samples decreases with the service time.
In order to compare theT2eff obtained from single exponential fitting with theT2eff obtained from
inverse Laplace transform more clearly, we recorded them in Table 2. It can be observed that the results obtained from the single exponential fit and the inverse Laplace transform agree well with each other, and theT2eff from both methods decreases with the service time of the sample. Especially the result of
8-year and 11-year samples were almost the same.
4. CONCLUSIONS
The mini UMR sensor designed in this paper is small, light weight and can achieve nondestructive testing at project site to judge the aging status of composite insulator sheds. The effective transverse relation time T2eff tested by the sensor decreased with the service time of the insulators. The results
encourages deep research of more samples from different environments.
Although the sensor designed in this paper can measure the transverse relation time quickly, the static magnetic field may be affected by the temperature. It is a barrier to obtain a stable effective transverse relation time of the sample at the project site where the temperature varies with time. The future work will focus on improving the temperature stability of the static magnetic field of the sensor by purchasing low temperature coefficient magnets or adding negative temperature coefficient magnetic materials on the magnets.
ACKNOWLEDGMENT
This work was supported by the National Natural Science Foundation of China (51377182), and the Scientific Research Foundation of State Key Lab of Power Transmission Equipment and System Security (2007DA10512713103). Yunfeng Xia thanks Jiamin Wu for helping on building the sensor and Pan Guo for assisting on paper writing.
REFERENCES
1. Looms, J. S. T., “Insulators for high voltages,” The Institution of Engineering and Technology, 1988.
3. Cui, J. L. and Z. Y. Su, “The application and prospect of silicone rubber composite insulators in China,”China Power, Vol. 32, No. 1, 38–41, 1999.
4. Yong, J., Q. H. Shen, F. Q. Zhao, et al., “The application and prospect of silicone rubber composite insulators in China,” China Electric Power, Vol. 32, No. 1, 38–41, 1990.
5. Amin, M., M. Akbar, and M. Salman, “Composite insulators and their aging: An overview,” Science in China Series E: Technological Sciences, Vol. 50, No. 6, 697–713, 2007.
6. Song, W., L. J. Zhao, C. R. Li, et al., “The development of online detection technology of composite insulators,”High Voltage Engineering, Vol. 31, No. 5, 30–32, 2005.
7. Hui, H., S. Wang, B. Yang, et al., “Research on the evaluation methods of the operating status and aging characteristics of composite insulators,”Shaanxi Electric Power, Vol. 40, No. 1, 64–66, 2012. 8. Tu, Y. P., C. H. Chen, Y. L. Tong, et al., “The evaluation methods of aging characteristics of
operating composite insulators,” High Voltage Engineering, Vol. 38, No. 10, 2522–2527, 2012. 9. Yan, B. and Z. H. Wang, “The analysis of the aging properties of silicone rubber composite
insulators materials,” Insulation Materials, Vol. 4, 58–60, 2009.
10. STRI Guide 92/1, “Hydrophobicity classification guide,” Swedish Transmission Research Institute, 1992.
11. Yang, Z. G., S. H. Wang, F. C. Lv, et al., “Design and application of leakage current measurement system for polluted insulator,”Electric Power Science and Engineering, Vol. 26, No. 1, 14–18, 2010. 12. Chen, W. G., W. P. Wang, and Q. Xia, “Research on multi-fractal characteristics of leakage current for contamination discharge of insulators,”Transactions of China Electro-technical Society, Vol. 28, No. 1, 50–56, 2013.
13. Kumagai, S. and N. Yoshimura, “Leakage current characterization for estimating the conditions of ceramic and polymeric insulating surfaces,” IEEE Transactions on Dielectrics and Electrical Insulation, Vol. 11, No. 4, 681–690, 2004.
14. Bai, H., J. L. Hu, J. Li, et al., “Hydrophobicity evaluation of composite insulators using the dynamic contact angle,” High Voltage Engineering, Vol. 36, No. 12, 3021–3027, 2010.
15. Tong, Y. L., “Study on the aging characteristic of composite insulator based on TSC,” North China Electric Power University Master’s Degree Thesis, Jun. 2011.
16. Liang, Y., L. J. Ding, and C. R. Li, “Primary research on the diagnosis of aging silicone rubber insulator using thermally stimulation current,” Proceedings of the CSEE, Vol. 27, No. 21, 7–12, 2007.
17. Zhang, H., Y. P. Tu, and Y. L. Tong, “Study on aging characteristics of silicone rubber shades of composite insulators based on TSC test,”Proceedings of the CSEE, Vol. 32, No. 19, 169–174, 2012. 18. Bl¨umich, B., S. Anferova, F. Casanova, K. Kremer, J. Perlo, and S. Sharma, “Unilateral NMR: Principles and applications to quality control of elastomer products,” Testing and Measuring, Vols. 7–8, 346–349, 2004.
19. Bl¨umich, B., J. Perlo, and F. Casanova, “Mobile single-sided NMR,”Progress in Nuclear Magnetic Resonance Spectroscopy, Vol. 52, 197–269, 2008.
20. Xu, Z., S. J. Zhao, and P. Guo, “A portable sensor used for assessing the aging status of silicone rubber insulator,”Applied Magnetic Resonance, Vol. 44, 1405–1417, 2013.
21. Xu, Z., K. K. Meng, and J. Y. Cheng, “Highly uniform singled-sided portable NMR sensor and its application in assessing the aging level of silicone rubber insulators,” International Journal of Applied Electromagnetic Mechanics, Vol. 47, 777–790, 2015.
22. Hoult, D. I. and R. E. Richards, “The signal-to-noise ratio of the nuclear magnetic resonance experiment,” Journal of Magnetic Resonance, Vol. 24, No. 1, 71–85, 1976.
23. Haacke, E. M., R. W. Brown, M. R. Thompson, et al., Magnetic Resonance Imaging: Physical Principles and Sequence Design, A John Wiley and Sons, New York, 1999.
24. Hurlimann, M. D., “Well logging,” Encyclopedia of Magnetic Resonance, John Wiley & Sons Ltd., 2012.