Western University Western University
Scholarship@Western
Scholarship@Western
Electronic Thesis and Dissertation Repository
9-29-2017 2:00 PM
The role of muscle strength and voluntary activation on
The role of muscle strength and voluntary activation on
symptomatic fatigue in multiple sclerosis
symptomatic fatigue in multiple sclerosis
Shannon P. Davidson
The University of Western Ontario
Supervisor
Dr. Timothy J. Doherty
The University of Western Ontario
Graduate Program in Kinesiology
A thesis submitted in partial fulfillment of the requirements for the degree in Master of Science © Shannon P. Davidson 2017
Follow this and additional works at: https://ir.lib.uwo.ca/etd
Recommended Citation Recommended Citation
Davidson, Shannon P., "The role of muscle strength and voluntary activation on symptomatic fatigue in multiple sclerosis" (2017). Electronic Thesis and Dissertation Repository. 4943.
https://ir.lib.uwo.ca/etd/4943
ABSTRACT
This study investigated the role of muscle strength and voluntary activation (VA) on
symptomatic fatigue in individuals with multiple sclerosis (MS). Nine women with
relapsing-remitting or secondary-progressive MS (mean age, 43yrs) were compared to nine healthy women
(mean age, 37yrs). Symptomatic fatigue was assessed using the Modified Fatigue Impact Scale
(MFIS), Fatigue Severity Scale, and Visual Analogue Fatigue Scale. Functional capacity was
assessed with a 6-Minute Walk Test (6-MWT). Muscle strength and VA were determined using
twitch interpolation applied to the right dorsiflexor muscles during maximal voluntary isometric
contractions (MVIC). Muscle fatigue was assessed during a sustained submaximal contraction.
Distance during the 6-MWT, muscle strength and VA were significantly lower in the MS group.
MFIS scores were negatively associated with muscle strength and VA. The MS group was more
easily fatigued, as measured by MVIC. In conclusion, symptomatic fatigue is associated with
muscle fatigue and weakness in individuals with MS.
Keywords: Multiple Sclerosis (MS); Interpolated twitch technique (ITT); Voluntary activation
ACKNOWLEDGEMENTS
I would like to gratefully acknowledge the many individuals who made this thesis
possible by contributing their knowledge, skills, and support along my journey as a graduate
student.
First and foremost, I want to thank my supervisor, Dr. Tim Doherty. Tim, thank you for
your continual guidance and support throughout my research. You have provided me with
incredible opportunities to further my understanding of how the human neuromuscular system
works. Thank you for providing an enriched environment to learn in, I always looked forward to
coming into the lab!
Furthermore, I owe much gratitude to my supervisory committee members Dr. Sarah
Morrow and Dr. Charles Rice for their invaluable assistance in the preparation of my thesis. A
special thank you to Dr. Sarah Morrow; your tireless assistance with patient recruitment was the
key to the success of my MS study. I am sincerely grateful for having the opportunity to attend
MS clinics and learn from you.
My gratitude extends to my lab member, Neal, for taking me under your wing. Your
companionship & humor made each day enjoyable, both inside and outside the lab. I wish you all
the best in your PhD!
To my softball coach, Dr. Peter Lemon and his wife Mary-Ellen, thank you for being my
home away from home. You have put infinite hours into our softball program and myself as an
individual. Thank you for your academic guidance when on the road, extending your lab when I
To my parents Paul and Bonnie, siblings Shane and Jennilee, cousin Lindsay, and my
boyfriend David, thank you for your unwavering love and support. You kept me going through
the tough times of research, and I feel so fortunate to have been able to share my experiences
with you all each step of the way.
Most importantly, I would like to thank the participants who volunteered to take part in
this research. In particular, I extend my deepest gratitude to the participants with MS and their
families who gave their time and energies to contribute.
TABLE OF CONTENTS
ABSTRACT ... i
ACKNOWLEDGEMENTS ... ii
TABLE OF CONTENTS ... iv
LIST OF TABLES ... vi
LIST OF FIGURES ... vii
LIST OF APPENDICES ... viii
LIST OF ABBREVIATIONS ... ix
GLOSSARY OF TERMS ... x
CHAPTER 1: Fatigue in the Neuromuscular System 1.0 GENERAL INTRODUCTION ... 1
1.01 Multiple Sclerosis ... 1
1.02 The Motor System... 4
1.03 Fatigue in the Neuromuscular System ... 6
1.04 Fatigue in MS ... 8
1.05 Quantifying Fatigue in MS ... 10
1.06 Anatomy ... 12
1.1 REFERENCES ... 16
CHAPTER 2: Quantitative assessment of muscle strength and fatigue in individuals with MS 2.0 INTRODUCTION ... 22
2.1 METHODS ... 24
2.1.1 Study Participants ... 24
2.1.2 Measures of Fatigue ... 25
2.1.3 Measurement of Isometric Strength and Fatigue ... 27
2.1.4 Measurement of Voluntary Activation ... 28
2.1.5 Statistical Methods ... 29
2.2 RESULTS ... 30
2.2.1 Demographics ... 30
2.2.2 Fatigue Questionnaires and 6-MWT ... 33
2.2.3 Force Measurement and Fatigue Test ... 36
2.3 DISCUSSION ... 44
2.4 LIMITATIONS ... 50
APPENDIX A ... 57
APPENDIX B ... 59
APPENDIX C ... 61
APPENDIX D ... 62
APPENDIX E ... 63
LIST OF TABLES
Table 1. Subject Characteristics ... 31
Table 2. History of MS Participants ... 32
Table 3. Fatigue Scales ... 35
Table 4. Baseline Quantitative Parameters ... 37
LIST OF FIGURES
Figure 1.1. Nerve Fibre (neuron) from a healthy individual and person with MS ... 2
Figure 1.2. Clinical types of MS ... 3
Figure 1.3. Dorsiflexor muscles of the leg ... 13
Figure 2.1. Schematic representation of the study protocol... 25
Figure 2.2. Schematic representation of the experimental setup ... 29
Figure 2.3. Distance walked during the 6-minute walk test ... 39
Figure 2.4. Correlation between 6-minute walk times and MFIS scores ... 40
Figure 2.5. Strength of the DF muscles ... 41
Figure 2.6. Voluntary activation of the DF muscles ... 42
LIST OF APPENDICES
APPENDIX A ... 57
APPENDIX B ... 59
APPENDIX C ... 61
APPENDIX D ... 62
LIST OF ABBREVIATIONS
CNS- central nervous system
DF- dorsiflexor
DMTs- disease-modifying therapies
FSS- fatigue severity scale
ITT- interpolated twitch technique
LMN- lower motor neuron
M1- primary motor cortex
MFIS- modified fatigue impact scale
MS- multiple sclerosis
MVIC- maximal voluntary isometric contraction
NJM- neuromuscular junction
PNS- peripheral nervous system
RRMS- relapsing-remitting multiple sclerosis
SPMS- secondary progressive multiple sclerosis
UMN- upper motor neuron
VA- voluntary activation
GLOSSARY OF TERMS
Central nervous system (CNS)- a portion of the nervous system which includes the brain and spinal cord
Kurtzke expanded disability status scale (EDSS)- clinical evaluation of quantifying disability in multiple sclerosis
Neuromuscular fatigue- a reduction in muscle force production following exertion
Fatigue- an overwhelming sense of exhaustion or tiredness that renders an individual from being able to initiate or complete an activity that he/she would normally be able to do
Fatigue severity scale (FSS)- a self-administered questionnaire used to assess the severity of fatigue and the impact on daily functioning during the past week
Interpolated twitch technique (ITT)- a technique used to assess the completeness of skeletal muscle activation
Maximal voluntary isometric contraction (MVIC)- maximal effort voluntary contraction where the joint angle remains constant during the contraction
Modified fatigue impact scale (MFIS)- a self-administered questionnaire used to assess the perceived impact of fatigue within the past four weeks
Multiple sclerosis (MS)- non-traumatic central nervous system (brain and spinal cord) disorder
Neuromuscular junction- a specialized synapse between a motor neuron and a muscle end-plate
Peak torque- the maximum production of force about a vector (the dynamometer arm) for a single contraction, measured in newton.meters (Nm)
Peripheral fatigue- a progressive reduction in force production resulting from fatigue occurring in the muscle distal to the neuromuscular junction
Voluntary activation (VA)- the level of central drive achieved during a voluntary isometric contraction at any target force
Visual analogue fatigue scale (VAFS)- a research instrument designed to measure an attribute that is best illustrated by a continuum of values versus discrete points
CHAPTER 1
FATIGUE IN THE NEUROMUSCULAR SYSTEM
1.0GENERAL INTRODUCTION
1.01 Multiple Sclerosis
Multiple sclerosis (MS) is the most common non-traumatic central nervous system (brain
and spinal cord) disorder of young adulthood, affecting approximately 100,000 people in Canada
and 2.5 million people worldwide [1–4]. The diagnosis of MS most commonly occurs in the
second or third decade of life, with a female:male ratio of 2:1 [2–5]. Although the etiology of
MS has yet to be clearly established, interactions between environmental, infectious, and genetic
factors are currently considered as possible causes [6–9]. MS involves unpredictable episodes of
axonal demyelination, resulting in lesions along axons of nerve fibers in the central nervous
system (CNS) pathways [7]. The demyelination of the nerve fibers interferes with the neuronal
conduction from the CNS to effector organs [7,10–13]. This interference manifests as various
symptoms such as sensory loss, cognitive impairment, gait disturbance, visual impairment,
Figure 1.1. Nerve Fibre (neuron) from a healthy individual and person with MS (with
permission from Alexandra Lynette-Krech, (2017))
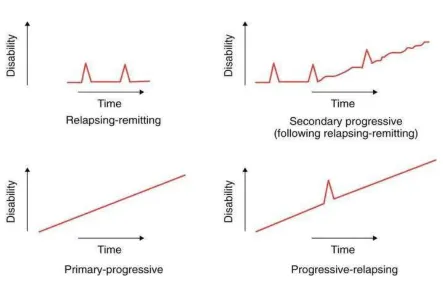
The clinical course of MS is characterized by acute periods of worsening (relapses),
progressive deterioration of neurological function, or combinations of both [15].
Relapsing-remitting MS (RRMS) is the most common disease course, affecting approximately 85% of
individuals with MS [16]. This disease course manifests as a period of relapse followed by a
period of remission, during which symptoms improve partially or completely [7,15].
Secondary-progressive MS (SPMS) follows the initial RRMS disease course with a steady progression, with
or without relapses [2,15,17]. Sixty percent of people who are initially diagnosed with RRMS
will transition to SPMS [2,15]. Primary-progressive MS occurs in approximately 10% of
onset, with no distinct relapses or remission [2,7,15]. Lastly, progressive-relapsing MS is the
least common of the four disease courses, occurring in approximately 5% of individuals with
MS, and is characterized by steadily progressing disease from the beginning with occasional
relapses along the way [2,7]. The disease continues to progress without remissions. The pattern
of clinical symptoms and descriptors is complex; the types are displayed in Fig 1.2.
Figure 1.2. Clinical types of MS (with permission from Fred D. Lublin, M.D, (2016))
Therapies are a key component of MS care, along with treating symptoms and managing
MS relapses. The approach to the treatment of MS is individualized to ones’ relative disabilities,
There are currently 12 disease-modifying therapies (DMTs) that have been approved by
Health Canada; seven are injectable, three are oral, and two are infused [2]. These are currently
the best approach available to slow the natural course of MS [2]. DMTs target some aspect of the
inflammatory process of MS while reducing the severity and frequency of relapses, the
development of new lesions, and the progression of disability [2]. Both clinical experience and
clinical investigation have suggested that early intervention with DMTs may help to prevent
permanent damage in the CNS, increasing ones’ overall level of function and quality of life [2].
The majority of current treatments for MS are pharmaceutical. However, due to the
variability of MS symptoms, individuals often seek relief through rehabilitation and alternative
medicine [2]. Rehabilitation specialists, such as physical therapy, occupational therapy,
speech-language pathology, vocational rehabilitation and cognitive rehabilitation provide evaluation and
treatment to improve and maintain function [2,18]. Alternative medicine includes a wide variety
of interventions from naturopathy to stress management and acupuncture, and are instrumental in
the management of the disease[18]. As well, assistive devices (e.g. walkers, scooters,
wheelchairs) and appropriate orthoses (e.g. ankle foot orthoses) should be considered as they
play a viable role in the management of mobility [18].
1.02 The Motor System
The motor systems in the CNS control a multitude of functional outputs, both voluntary
and involuntary [19]. The motor systems are organized in hierarchy from the cerebral cortex,
brainstem to spinal cord, to peripheral motor system. The spinal cord is the lowest level in the
CNS hierarchical structure, and conduits information through neuronal circuits that control
various reflexes and rhythmic movement [20]. The brainstem is the middle level in the
movement [20]. The cerebral cortex is the highest level in the hierarchical structure, housing the
motor cortex [20]. The motor cortex consists of the primary motor cortex (M1), premotor area,
and secondary motor areas, and are responsible for the planning, initiating, and execution of
voluntary movement [20].
Movement is initiated through motor commands from the M1 and premotor areas.
Commands are transmitted down the corticospinal tract to the spinal cord via upper motor
neurons (UMNs) [19,20]. Axons of UMNs synapse in the ventral horn of the spinal cord with
lower motor neurons (LMNs) either directly or indirectly, via spinal interneurons [19]. LMN
axons exit as the ventral root, and combine with the dorsal root to form the peripheral nerve [19].
Axons of the LMNs leave the CNS, forming peripheral axons and eventually branch distally near
their target muscle to form a terminal arborization [19]. Each of the terminal branches form a
synapse-like junction, known as the neuromuscular junction (NMJ), innervating skeletal muscle
and thus initiating movement [19].
Motor system dysfunction can result from damage or disease at any level of the motor
system hierarchy. Damage to the UMNs of the descending motor pathways results in the upper
motor neuron syndrome, and gives rise to a set of signs and symptoms such as weakness, fatigue,
positive Babinski sign, spasticity, hyperreflexia of superficial reflexes, and loss of dexterity
[21,22]. These acute manifestations tend to be most severe in the arms and legs and would be
seen in conditions such as cerebral palsy, primary lateral sclerosis, and multiple sclerosis.
Damage to the LMNs of the brainstem and spinal cord are referred to as the lower motor neuron
syndrome, and would be characterized by weakness of the affected muscles, loss of reflexes, loss
of muscle tone, and atrophy [21,22]. These signs would be seen in conditions such as spinal
nervous system disorder and thus only results in impairment and disability secondary to UMN
dysfunction.
1.03 Fatigue in the Neuromuscular System
The neuromuscular system is a complex system that provides humans with movement,
from respiration and saccadic movements of the eye, to walking and standing [19,23]. The
peripheral component of the neuromuscular system, also known as the lower motor neuron, is
comprised of the alpha motor neurons and peripheral motor axons, which innervate and control
skeletal muscle fibres. Motor neurons are responsible for relaying signals from the peripheral
motor system, along the motor pathway, to the skeletal muscle which initiates contraction [24].
Muscle fibres are then responsible for contracting, thus generating the torque necessary for
movement [24]. Muscular fatigue, or fatigability, results from a reduction in muscle torque
production following exertion [25–27]. This may occur at various sites along the motor pathway
from the brain and spinal cord to the muscle itself. Since multiple sites are involved in the
development of neuromuscular fatigue, they can be divided into the CNS and peripheral nervous
system (PNS). Changes in the CNS or the PNS both contribute to the reduction in muscle torque
production [28,29].
Central fatigue results from the inability of the CNS to adequately drive the muscle to
produce torque during a muscular contraction [30]. It can originate from various sites along the
motor pathway, and can therefore result from either a reduction in central drive (central
activation) or modulations to the central drive at the level of the spinal cord [26,31]. During a
fatiguing task, the CNS increases its central drive to overcome fatigue [32]. Despite an increase
in central drive, torque production decreases progressively with fatigue [33]. This is referred to
[25,34–36]. Central fatigue has been demonstrated in several muscle groups of both healthy and
patient populations, including elbow flexors, quadriceps and ankle dorsi- and plantar-flexors for
sustained, intermittent, maximal or submaximal voluntary contractions. Using electrical
stimulation, an estimate that 12% and 20% of the loss of strength during maximal voluntary
isometric contractions (MVIC) of the elbow flexors and of the ankle dorsiflexors are due to
central fatigue, respectively [6,26,37]. Furthermore, several transcranial magnetic stimulation
(TMS) studies have shown that central fatigue can account for over 25% of the reduced torque
seen during sustained, maximal contractions [38–40]. However, central fatigue appears to
contribute more significantly to the reduced torque during low-intensity exercise [38]. For
example, it has been suggested that low-torque, long-duration contractions are more likely to
lead to the development of central fatigue than high-torque, short-duration contractions
performed by the same muscle group [41]. In fact, Sogaard et al [42] have indicated through the
use of TMS, that 40% of fatigue can be attributed centrally during a submaximal (15% MVIC)
contraction of the elbow flexors until exhaustion.
Peripheral fatigue, results from loss of muscular torque that occurs at or distal to the
neuromuscular junction [30]. This can be thought of as fatigue within the peripheral nerve or
muscle itself [30]. It is also referred to as peripheral fatigue because changes occur within the
PNS as opposed to the CNS [31]. Schillings et al [43] demonstrated a significant difference in
voluntary torque before and after a fatiguing task. Their findings suggest a large peripheral
contribution to fatigue, accounting for 89% of the voluntary force loss after a 2-minute sustained
MVC. Gandevia et al [33] and Kent-Braun and Le Blanc [6] reported a 26% and 80% loss of
voluntary torque after a sustained voluntary contraction, respectively, attributing it to peripheral
peripheral nerve stimulation, along with the greater metabolic changes (reduction in phosphorus
energy metabolites and pH) in individuals with MS. These findings indicate that the source of
excessive fatigue was peripheral rather than central.
1.04 Fatigue in MS
Many of the tasks that we perform during our everyday activities, such as walking up a
flight of stairs, shopping, or simply getting up from a chair, become increasingly difficult as a
result of fatigue. In fact, adults with MS report fatigue as their most disabling symptom, affecting
up to 90% of the MS population [44]. However, despite its high prevalence, fatigue in MS
remains poorly understood [45]. The term fatigue has been used to describe a multitude of
physical and cognitive complaints [27,34,46]. As reported by patients, fatigue typically refers to
a state of exhaustion or tiredness [9,27,47–50]. Factors such as weakness, pain, sleep
disturbance, and mental illness (depression) all potentially contribute to the increased level of
fatigue [23,27,51–54]. Fatigue can also be manifested as muscular fatigue or fatigability, and can
be described as the magnitude of change in the physical performance over a period of time
[27,55–57]. Therefore, fatigue can be subjectively evaluated with self-report fatigue scales, or
objectively evaluated with quantitative parameters, such as a reduction in peak torque [34,47].
Earlier studies that investigated the interrelationship between fatigability and the
physical, cognitive and psychosocial complaints of fatigue in individuals with MS, reported no
relation between symptomatic fatigue, central activation, muscle weakness, or any other clinical
function measure, including fatigability [35,49,58,59]. Sharma et al [35] studied the extent to
which fatigability was related to clinical status and symptomatic fatigue. Fatigue was examined
in 42 participants by measuring muscle torque (MVIC), muscle activation (compound muscle
anterior muscle, as well as a self-report fatigue questionnaire (FSS) [35]. The main findings of
the study showed excessive decline in tetanic torque during peripheral nerve stimulation in
individuals with MS, as well as a positive correlation between fatigability and UMN dysfunction
and metabolic changes during exercise, but not with symptomatic fatigue ratings [35]. Van der
Werf et al [59] studied the extent to which cerebral abnormalities, as indicated by white matter
lesions on magnetic resonance imaging (MRI), had any relation with the severity of fatigue
complaints of individuals with MS. Forty-five participants rated fatigue severity through a
self-report fatigue questionnaire (Checklist Individual Strength-Fatigue) and the use of a 2-week
diary, while the MRI provided measures for cerebral abnormalities (white matter lesion load,
brain atrophy) [59]. These findings suggested no relation between symptomatic fatigue in
individuals with MS and the extent of cerebral abnormalities, nor to the extent of MRI
abnormalities in discrete cerebral areas [59].
Conversely, later studies using self-report fatigue scales and sustained maximal and
submaximal contractions confirm a relation between symptomatic fatigue and fatigability
[28,60]. These findings suggest that a combination of complaints is necessary to explain
MS-related fatigue [28,60]. Steens et al [28] investigated associations between symptomatic fatigue
and measure of fatigability, while correcting for muscle torque. Fatigue was examined in 40
participants by measuring muscle torque (MVIC), muscle activation (ITT), and corticospinal
integrity (TMS) during electrical stimulation of the first dorsal interosseous muscle, as well as
self-report fatigue questionnaires (FSS and HADS). The main results demonstrated a strong
association between symptomatic fatigue in individuals with MS and the decline in torque during
an MVIC, as well as measures of voluntary activation [28]. Wolkorte et al [60] took previous
fatigue, depression scores, and muscle fatigability in individuals with MS [60]. Fatigue was
examined in 100 participants by measuring muscle torque (MVIC) of the index finder abductor,
as well as self-reported fatigue questionnaires (FSS, MFIS, and HADS) [60]. Wolkorte et al [60]
reported a strong association between symptomatic fatigue and the combination of depression
and muscle fatigability in individuals with MS [60].
1.05 Quantifying Fatigue in MS
A great deal of attention in the past 20 years has been focused on the accurate
identification and measurement of fatigue [61]. Several methods have been developed to assess
fatigue due to the broad range of underlying mechanisms and confounding factors associated
with it [62]. A multidimensional approach incorporating both subjective evaluation and torque
measurements is most useful for a comprehensive analysis when studying fatigue in individuals
with MS [27,63,64].
Measurement of subjective evaluation typically requires the use of self-reported scales
[1,65–67]. Both the Modified Fatigue Impact Scale (MFIS) and Fatigue Severity Scale (FSS)
have rapidly become the most widely used tools in MS, clinically [61,68]. Using a Likert-scale
format, the MFIS is a 21 item questionnaire that quantifies the subjective experience of fatigue
by addressing the constructs of physical, psychosocial and cognitive fatigue [1,61,66]. The FSS
is a nine item questionnaire that quantifies the subjective impact and severity of fatigue
[1,10,67]. In addition, the Visual Analogue Fatigue Scale (VAFS) is a one item questionnaire
that evaluates the subjective perception of global fatigue experienced in MS [69].
Objective evaluation of fatigue typically requires the use of torque for its measurement.
production through the use of a dynamometer [70–72]. This can be achieved by attempting a
sustained maximal voluntary isometric contraction (MVIC), or a submaximal voluntary
isometric contraction held to the limit of endurance [26,71,72]. Isometric contractions are
defined by the production of increasing tension with a constant muscle length or joint angle.
Measuring percentage drop of initial torque within a predetermined time has been used to
facilitate group comparisons in special population studies [73,74]. Another way to objectively
quantify fatigue involves measuring the extent of voluntary activation (VA) through twitch
interpolation [26,39,75]. The underlying principle involves electrically stimulating the
appropriate peripheral nerve or muscle at the point of maximal voluntary torque production [25].
If central activation is inadequate, the stimulation will evoke additional torque from the muscle
[30]. The size of the additional torque is proportional to the central drive and number of inactive
motor units that are not being maximally driven [25]. A decrease in activation, as can occur
during a sustained contraction, can contribute to the development of fatigue [25].
Voluntary activation can be determined using the interpolated twitch technique and calculated
according to Equation 1 [28].
𝑉𝐴 (%) = ( 1 − ( 𝐼𝑛𝑡𝑒𝑟𝑝𝑜𝑙𝑎𝑡𝑒𝑑 𝑡𝑤𝑖𝑡𝑐ℎ
𝑃𝑜𝑡𝑒𝑛𝑡𝑖𝑎𝑡𝑒𝑑 𝑡𝑤𝑖𝑡𝑐ℎ)) x 100 (1).
Interpolated twitch represents the maximal torque stimulated using a supramaximal
stimulus during an MVIC. Potentiated twitch represents the torque using the same supramaximal
stimulus following the MVIC, while the muscle is at rest [76].
Applying a fatigue protocol that incorporates changes in torque as the primary outcome
Quantitative indicators of muscle weakness may provide direct evidence of neuromuscular
fatigue in MS. Alternatively, objective measurements of fatigue might provide indirect evidence
of subjective fatigue in individuals with MS.
1.06 Anatomy
When investigating fatigue and neuromuscular health, the physiology and function of the
muscle must be considered. Flexors in the lower limbs, such as the ankle dorsiflexor muscles,
tend to be more affected in MS due to the upper motor neuron patterns of weakness.
Literature studying muscle strength in MS reports an increase in muscle weakness and a
reduction in muscle strength, specific to knee extensors [34,73,77,78], knee flexors [73,79], and
ankle DF [58] muscle groups. Similarly, muscles of the lower extremities demonstrate a greater
degree of muscle weakness compared to muscles of the upper extremities [74]. For the study of
muscular fatigue in individuals with MS, muscles of the lower extremities that are particularly
active during ambulation are most relevant. For the present investigation, the ankle DF muscles
of the lower extremities have been selected due to their specific role in mobility and ankle
stabilization during every day activities, such as walking or climbing up a flight of stairs [80].
The anterior compartment of the leg consists of muscles that dorsiflex the foot and extend
the toes. These muscles include the tibialis anterior (TA), extensor hallucis longus, extensor
digitorum longus and fibularis tertius. The TA is a long, thick muscle against the lateral surface
of the tibia [81]. It originates on the lateral condyle and body of the tibia and interosseous
membrane (sheet of fibrous tissue that holds shafts of tibia and fibula together) and inserts onto
the first metatarsal and medial cuneiform [81,82]. The extensor hallucis longus is a thin muscle
between the TA and extensor digitorum longus muscles [81]. It originates on the anterior surface
The extensor digitorum longus originates on the lateral condyle of the tibia, anterior surface of
the fibula, and interosseous membrane and inserts onto the middle and distal phalanges of toes
2-5 [81]. Lastly, the fibularis tertius muscle is part of the extensor digitorum longus, with which it
shares a common origin, and inserts onto the base of the fifth metatarsal [81]. Innervated by the
peroneal nerve, the ankle DF muscles serve to dorsiflex the foot at the ankle joint, invert
(supination) and evert (pronation) the foot at the intertarsal joints, and extension of toes 1-5
[81,82]. The dorsiflexor muscles of the leg are displayed in figure 1.3.
The overall purpose of this thesis was to objectively evaluate the interrelationship between
symptomatic fatigue and fatigability in individuals with MS.
Objectives
1. To compare dorsiflexor isometric strength in individuals with MS and healthy individuals
2. To compare voluntary activation in individuals with MS and healthy individuals
3. To compare fatigability in individuals with MS and healthy individuals
4. To compare 6-Minute Walk Times in individuals with MS and healthy individuals
5. To measure subjective perception of fatigue in individuals with MS and healthy
individuals using the Modified Fatigue Impact Scale, Fatigue Severity Scale, and Visual
Analogue Fatigue Scale
6. To measure fatigue severity and fatigability in individuals with MS and healthy
individuals through the use of fatigue questionnaires and submaximal isometric testing
Hypotheses
1. Individuals with MS will show decreased dorsiflexor isometric strength in comparison to
healthy individuals
2. Individuals with MS will show decreased voluntary activation in comparison to healthy
individuals
3. Individuals with MS will exhibit greater fatigue in comparison to healthy individuals
4. Individuals with MS will have a reduced 6-Minute Walk time in comparison to healthy
5. Individuals with MS will show higher subjective ratings of fatigue in comparison to
healthy individuals
6. Individuals with a higher subjective rating of fatigue will experience greater muscle
fatigue
7. The Modified Fatigue Impact Scale and the Fatigue Severity Scale scores will negatively
1.1 REFERENCES
1. Learmonth YC, Dlugonski D, Pilutti LA, Sandroff BM, Klaren R and Motl RW. Psychometric properties of the fatigue severity scale and the modified fatigue impact scale. Journal of Neurological Sciences. 2013;331:102–107.
2. MS: Multiple Sclerosis Society of Canada. Quebec (CA). c2017 [accessed 2017 March]. https://mssociety.ca/about-ms/types.
3. Poppe AY, Wolfson C, and Zhu B. Prevalence of multiple sclerosis in canada: a systematic review. Canadian Journal of Neurological Sciences. 2008;35(5):593–601.
4. Weinshenker BG, Bass B, Rice GP, Noseworthy J, Carriere W, Baskerville J and Ebers GC. The natural history of multiple sclerosis: a geographically based study. Brain: a Journal of Neurology. 1989;112(1):133–146.
5. Hurwitz BJ. The diagnosis of multiple sclerosis and the clinical subtypes. Annals of Indian Academy of Neurology. 2009;12(4):226–230.
6. Kent-Braun JA and Le Blanc R. Quantitation of central activation failure during maximal voluntary contractions in humans. Muscle & Amp; Nerve. 1996;9(7):861–869.
7. Compston A and Coles A. Multiple sclerosis. The Lancet. 2008;372(6948):1502–1517.
8. Taylor BV. The major cause of multiple sclerosis is environmental: genetics has a minor role- yes. Multiple. Sclerosis Journal. 2011;17(10):1171–1173.
9. Chaudhuri A and Behan PO. Fatigue in neurological disorders. The Lancet. 2004; 363(4913):978–988.
10. Learmonth YC: Therapeutic Exercise for those moderately affected with Multiple Sclerosis [dissertation]. [Glasgow (UK)]: University of Glasgow; 2012.
11. Lipsy RJ, Schapiro RT and Prostko CR. Current and future directions in MS management: key considerations for managed care pharmacists. Journal of Managed Care Pharmacy: JMCP. 2009;15(9):2–15.
12. Compston A and Coles A. Multiple sclerosis. The Lancet. 2002;359:1221–1131.
13. Kobelt G, Berg J, Lindgren P, Gerfin A and Lutz J. Costs and quality of life of multiple sclerosis in switzerland. European Journal of Health Economics. 2006;7(S2):86-95.
14. Mallucci G, Peruzzotti-Jametti L, Bernstock JD and Pluchino S. The role of immune cells, glia and neurons in white and gray matter pathology in multiple sclerosis. Progress in neurobiology. 2015;127–128:1–22.
an international survey. National Multiple Sclerosis Society (USA) Advisory Committee on Clinical Trials of New Agents in Multiple Sclerosis. Neurology. 1996;46(4):907–911.
16. Miller D, Barkhof F, Montalban X, Thompson A, and Filippi M. Clinically isolated
syndromes suggestive of multiple sclerosis, part I: natural history, pathogenesis, diagnosis, and prognosis. Lancet Neurology. 2005;4:281–288.
17. Nylander A and Hafler DA. Multiple sclerosis. The Journal of Clinical Investigation. 2012;122(4):1180.
18. Pushkar S. Symptomatic management in multiple sclerosis. Annals of Indian Academy of Neurology. 2015;18(5):35.
19. Burt AM. Textbook of Neuroanatomy. Philadelphia (PA); W.B. Saunders Company; 1993. p. 303-323.
20. Li Y, Alam M, Guo S, Ting KH and He J. Electronic bypass of spinal lesions: activation of lower motor neurons directly driven by cortical neural signals. Journal of
neuroengineering and rehabilitation. 2014;11(1):1–12.
21. Purves D and Williams MS. Neuroscience. Sunderland (MA): Sinauer Associates; 2001. p. 347-369.
22. Zeller D and Classen J. Plasticity of the motor system in multiple sclerosis. Neuroscience. 2004;283:222–230.
23. Choi-Kwon S, Han SW, Kwon SU and Kim JS. Poststroke fatigue: characteristics and related factors. Cerebrovascular Diseases. 2005;19(2):84–90.
24. Allen MD: Impacts of Diabetic Neuropathy on the Human Neuromuscular System [dissertation]. [London (ON)]: University of Western Ontario; 2014.
25. MacIntosh BR, Gardiner PF and McComas AJ. Skeletal muscle: form and function. Champaign (IL); Human Kinetics; 2005. p. 225-227.
26. Schillings ML, Hoefsloot W, Stegeman DF and Zwarts MJ. Neuromuscular function and disease: basic, clinical, and electrodiagnostic aspects. European Journal of Applied Physiology. 2003;90(5):387–400.
27. Charvet L, Serafin D and Krupp LB. Fatigue in multiple sclerosis. Fatigue: Biomedicine, Health & Behavior. 2013;2(1):3–13.
28. Steens A, de Vries A, Hemmen J, Heersema T, Heerings M, Maurits N and Zijdewind I. Fatigue perceived by multiple sclerosis patients is associated with muscle fatigue. Neurorehabilitation and Neural Repair. 2012;26(1):48–57.
30. Enoka RM and Duchateau J. Muscle fatigue: what, why and how it influences muscle function. The Journal of Physiology. 2008;586(1):11–23.
31. Taub E: Voluntary Muscle Activation and Exercise Recovery in Chronic Fatigue Syndrome [thesis]. [Calgary, (CA)]: University of Calgary; 2010.
32. Allen DG, Lamb GD and Westerblad H. Skeletal muscle fatigue: cellular mechanisms. Physiological Reviews. 2008;88(1):287–332.
33. Gandevia SC, Allen GM, Butler JE and Taylor JL. Supraspinal factors in human muscle fatigue: evidence for suboptimal output from the motor cortex. The Journal of Physiology. 1996;490(2):529–536.
34. Rice CL, Vollmer TL and Bigland-Ritchie B. Neuromuscular responses of patients with multiple sclerosis. Muscle Nerve. 1992;15(10):1123–1132.
35. Sharma KR, Kent-Braun JA, Mynhier MA, Weiner MW and Miller RG. Evidence of an abnormal intramuscular component of fatigue in multiple sclerosis. Muscle & Nerve. 1995;18(12):1403–1411.
36. De Ruiter CJ, Jongen JH, Van Der Woude HV and De Haan A. Contractile speed and fatigue of adductor pollicis muscle in multiple sclerosis. Muscle & Nerve.
2001;24(9):1173–1180.
37. Schillings ML, Kalkman JS, Janssen HMHA, van Engelen BGM, Bleijenberg G and Zwarts MJ. Experienced and physiological fatigue in neuromuscular disorders. Clinical Neurophysiology. 2007;118(2):292–300.
38. Boyas S and Guével A. Neuromuscular fatigue in healthy muscle: underlying factors and adaptation mechanisms. Annals of Physical and Rehabilitation Medicine. 2011;54(2):88– 108.
39. Gandevia SC. Spinal and supraspinal factors in human muscle fatigue. Physiology Reviews. 2001;81(4):1725–1789.
40. McNeil CJ, Doherty TJ, Stashuk DW and Rice CL. Motor unit number estimates in the tibialis anterior muscle of young, old, and very old men. Muscle & Nerve.
2005;31(4):461–467.
41. Behm DG, St-Pierre DM and Perez D. Muscle inactivation: assessment of interpolated twitch technique. Journal of Applied Physiology. 1996;81(5):2267–2273.
43. Schillings ML, Hoefsloot W, Stegeman DF and Zwarts MJ. Relative contributions of central and peripheral factors to fatigue during a maximal sustained effort. European Journal of Applied Physiology. 2003;90(5-6):562–568.
44. Krupp LB. Fatigue in multiple sclerosis: a guide to diagnosis and management. New York (NY); Demos Medical Publishing; 2004. p. 3-16.
45. Braley TJ and Chervin RD. Fatigue in multiple sclerosis: mechanisms, evaluation, and treatment. Sleep. 2010;33(8):1061–1070.
46. Kluger BM, Krupp LB and Enoka RM. Fatigue and fatigability in neurologic illnesses: proposal for a unified taxonomy. Neurology. 2013;80(4):409–414.
47. Iriarte J. Correlation between symptom fatigue and muscular fatigue in multiple sclerosis. European Journal of Neurology. 1998;5(6):579–585.
48. Downey DC. Fatigue syndromes: new thoughts and reinterpretation of previous data. Medical Hypotheses. 1992;39(2):185–190.
49. Sheean GL, Murray NMF, Rothwell JC, Miller DH and Thompson AJ. An
electrophysiological study of the mechanism of fatigue in multiple sclerosis. Brain. 1997;120:299–315.
50. Komaroff AL. An examination of the working case definition of chronic fatigue syndrome. American Journal of Medicine. 1996;100(1):56–64.
51. Glader EL, Stegmayr B and Asplund K. Poststroke fatigue: a 2-year follow-up study of stroke patients in sweden. Stroke. 2002;33(5):1327–1333.
52. Michael KM, Allen JK and Macko RF. Fatigue after stroke: relationship to mobility, fitness, ambulatory activity, social support, and falls efficacy. Rehabilitation Nursing. 2006;31(5):210–217.
53. Morley W, Jackson K and Mead GE. Post-stroke fatigue: an important yet neglected symptom. Age and Ageing. 2005;34(3):313.
54. Ingles JL, Eskes GA, Phillips SJ. Fatigue after stroke. Archives of Physical Medicine and Rehabilitation. 1999;80(2):173–178.
55. Enoka RM and Stuart DG. Neurobiology of muscle fatigue. Journal of Applied Physiology. 1992;72(5):1631–1648.
56. Katirji B, Kaminski HJ, Henry J, and Ruff RL. Neuromuscular disorders in clinical practice. 2nd ed. New York (NY); Springer-Verlag New York; 2014 p.903-952.
58. Ng AV, Miller RG, Gelinas D and Kent-Braun JA. Functional relationships of central and peripheral muscle alterations in multiple sclerosis. Muscle & Nerve. 2004;29(6):843–852.
59. Van Der Werf SP, Jongen PJH, Lycklama À Nijeholt GJ, Barkhof F, Hommes OR and Bleijenberg G. Fatigue in multiple sclerosis: interrelations between fatigue complaints, cerebral MRI abnormalities and neurological disability. Journal of Neurological Sciences. 1998;160(2):164–170.
60. Wolkorte R, Heersema DJ and Zijdewind I. Muscle fatigability during a sustained index finger abduction and depression scores are associated with perceived fatigue in patients with relapsing-remitting multiple sclerosis. Neurorehabilitation Neural Repair.
2015;29(8):796–802.
61. Krupp LB. Fatigue in multiple sclerosis: a guide to diagnosis and management. New York (NY); Demos Medical Publishing; 2004. p. 17-24.
62. De Vries JM, Hagemans MLC, Bussmann JBJ, Van Der Ploeg AT and Van Doorn PA. Fatigue in neuromuscular disorders: focus on guillain-barre syndrome and pompe disease. Cellular and Molecular Life Sciences. 2010;67(5):701–713.
63. Dittner AJ, Wessely SC and Brown RG. The assessment of fatigue: a practical guide for clinicians and researchers. Journal of Psychosomatic Research. 2004;56(2):157–170.
64. Steens A, Heersema DJ, Maurits NM, Renken RJ and Zijdewind I. Mechanisms underlying muscle fatigue differ between multiple sclerosis patients and controls: a combined electrophysiological and neuroimaging study. NeuroImage. 2012;59(4):3110– 3118.
65. Andreasen A, Stenager E and Dalgas U. The effect of exercise therapy on fatigue in multiple sclerosis. Multiple Sclerosis. 2011;17(9):1041–1054.
66. Mills RJ, Young CA, Pallant JF and Tennant A. Rasch analysis of the modified fatigue impact scale (MFIS) in multiple sclerosis. Journal of Neurology, Neurosurgery, and Psychiatry 2010;81(9):1049–1051.
67. Mills RJ, Young CA and Nicholas RS. Rasch analysis of the fatigue severity scale in multiple sclerosis. Multiple Sclerosis. 2009;15:81–87.
68. Kos D, Kerckhofs E, Nagels G, D’hooghe MB and Ilsbroukx S. Origin of fatigue in multiple sclerosis: review of the literature. Neurorehabilitation Neural Repair. 2008;22(1):91–100.
syndrome. Occupational Medicine. 2005;55(1):20–31.
71. Barkhof F, Bruck W, De Groot CJA, Bergers E, Hulshof S, Geurts J, Polman CH and van der Valk P. Remyelinated lesions in multiple sclerosis. Archives of Neurology.
2015;60(8):1073–1081.
72. Edwards RH. Human muscle function and fatigue. Ciba Foundation Symposium. 1981;82:1–18.
73. Lambert CP, Archer RL and Evans WJ. Muscle strength and fatigue during
isokinetic exercise in individuals with multiple sclerosis. Medicine & Science in Sports & Exercise. 2001;33(10):1613–1619.
74. Schwid SR, Thornton CA, Pandya S, Manzur KL, Sanjak M, Petrie MD, McDermott MP and Goodman AD. Quantitative assessment of motor fatigue and strength in MS.
Neurology. 1999;53(4):743–750.
75. Shield A and Zhou S. Assessing voluntary muscle activation with the twitch interpolation technique. Sports Medicine. 2004;34(4):253–267.
76. Krishnan C and Williams GN. Quantification method affects estimates of voluntary quadriceps activation. Muscle & Nerve. 2010;41(6):868–874.
77. Andreasen AK, Jakobsen J, Petersen T and Andersen H. Fatigued patients with multiple sclerosis have impaired central muscle activation. Multiple Sclerosis. 2009;15(7):818– 827.
78. Surakka J, Romberg A, Ruutiainen J, Virtanen A, Aunola S and Mäentaka K. Assessment of muscle strength and motor fatigue with a knee dynamometer in subjects with multiple sclerosis: a new fatigue index. Clinical Rehabilitation. 2004;18(6):652–659.
79. Chung LH: Muscle weakness in persons with multiple sclerosis [dissertation]. [Amherst, (MA)]: University of Massachusetts Amherst; 2010.
80. Grasso R, Bianchi L and Lacquaniti F. Motor patterns for human gait: backward versus forward locomotion. Journal of Neurophysiology. 1998;80(4):1868–1885.
81. Tortora GJ and Derrickson B. Principles of Anatomy and Physiology. 12th ed. Hoboken (NJ); John Wiley & Sons; 2011. p. 423-429.
CHAPTER 2
QUANTITATIVE ASSESSMENT OF MUSCLE STRENGTH AND FATIGUE IN INDIVIDUALS WITH MS
2.0 INTRODUCTION
Individuals with multiple sclerosis (MS) characteristically present fatigue as one of their
most prevalent and disabling symptoms [1–3]. It has been suggested that up to 95% of
individuals with MS are affected by fatigue, and that it creates a major impact on quality of life
and overall well-being [2,3]. The term fatigue can be expressed by various combinations of
physical, emotional or cognitive complaints [1,4]. It can be described by individuals as a feeling
of exhaustion [5–7] or lassitude, [8,9] or from a neuromuscular standpoint, it can be described as
an inability to sustain a required or expected torque [8,10].
Fatigue remains a challenging symptom for individuals with MS and their care providers
[11]. Due to its complexity, quantifying muscle fatigue is essential when attempting to fully
understand the underlying causes. Self-report scales that can broadly be classified as measuring
subjective fatigue, have emerged as preferred tools clinically [12,2,13]. In addition, objective
measurements have been employed to quantify the decline in muscle torque during a
fatigue-inducing task [8,12,14-18]. While it has been established that changes in both central and
peripheral fatigue play a large role in the decline of muscle torque, it is possible to determine
whether central fatigue or weakness is present during a fatigue-inducing task [8]. The simplest
approach to determining this is to deliver a supramaximal electric stimulus to the motor nerve
and to look for a twitch superimposed on the torque produced during a maximal voluntary
isometric contraction (MVIC) [8,19,20]. Greater recruitment and central drive leaves fewer
recording, or a greater voluntary activation [21]. This commonly used technique is known as
twitch interpolation and has been applied to various clinical and special populations such as knee
osteoarthritis [21], chronic fatigue syndrome [22], amyotrophic lateral sclerosis [23], adult aging
[24], and more.
Studies investigating voluntary activation (VA) [25–28,16,29] reported that individuals
with MS have impaired central activation during both non-fatiguing and fatiguing motor tasks
compared to healthy individuals. A study by Steens et al [25] reported that muscle fatigue was
strongly associated with a decline in central activation during a fatiguing task of the first dorsal
interosseous. Studies investigating direct muscle torque [25,30,27,29] reported that individuals
with MS are significantly weaker than healthy individuals during a MVIC. Using surface EMG,
van der Kamp et al [31] found MVICs of the thenar muscles were 40% weaker in individuals
with various courses of MS.
Researchers continues to investigate the interrelationship between symptomatic fatigue
and fatigability [5,32]. Earlier studies [5,7] showed no association between symptomatic fatigue
in individuals with MS and objective measures of fatigability, while later studies [25] found a
stronger association. The differences in these findings between symptomatic fatigue and
fatigability might be specific to the methodology used. Therefore, a multidimensional approach
used to study both the subjective (self-report scales) and objective (direct muscle torque)
components of fatigue will provide a viable framework to study muscle strength and fatigue in
individuals with MS [1].
The aim of this study was to objectively investigate the role of muscle strength and
voluntary activation on symptomatic fatigue in individuals with MS. The muscle group chosen
and ankle stabilization when performing every day activities. Furthermore, weakness in the
flexors of the lower limbs, such as DF muscles tend to be more common in individuals with MS
due to upper motor neuron patterns of weakness. We hypothesize that individuals with MS who
are experiencing fatigue will exhibit deficits in muscle strength and voluntary activation.
Additionally, quantitative indicators of muscle weakness and fatigue may provide indirect
evidence of symptomatic fatigue.
2.1 METHODS
2.1.1 Study Participants
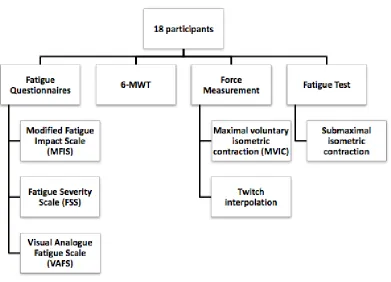
A schematic representation of the study protocol is included in Figure 2.1. Eighteen
participants (nine women with relapsing-remitting MS (RRMS) or secondary-progressive MS
(SPMS) and nine healthy aged matched women; ages 20-60 years) were invited to participate in
the study. Participants’ health was determined through the inclusion/exclusion criteria of the
study protocol as well as informal screening prior to commencement of the study. All
participants were otherwise healthy with no self-reported neuromuscular or musculoskeletal
disorders that would affect their gait or ability to perform strong muscle contractions in the lower
leg. RRMS/SPMS participants were recruited and screened using an Expanded Disability Status
Scale (EDSS) [33] (Appendix A) by Dr. S. Morrow, an experienced neurologist from the London
Health Science Centre MS Clinic. Participants with an EDSS score between 2.0-6.5 were eligible
to partake in the study. Healthy participants were recruited from the Western University student
population, as well as the London community. All participants provided informed written
consent and the study was approved by Western University, Health Sciences Research Ethics
Figure 2.1. Schematic representation of the study protocol
2.1.2 Measures of Fatigue
All data was collected during a single visit to the Neuromuscular Performance Laboratory
at Parkwood Institute (London, Ontario). At the beginning of the visit, participants completed the
Modified Fatigue Impact Scale (MFIS) [34,36] (Appendix B), Fatigue Severity Scale (FSS)
[34,35] (Appendix C), Visual Analogue Fatigue Scale (VAFS) [35] (Appendix D) and a
6-Minute Walk Test (6MWT) [37] (Appendix E).
The MFIS is a 21-item self-administered questionnaire used to assess the perceived
impact of fatigue within the past four weeks, and is aggregated into physical, cognitive and
being ‘almost always’, the extent to which they feel the statement applies to them. A total sum
score out of 84 is calculated, with higher scores indicating a greater impact of fatigue.
The FSS is a 9-item self-administered questionnaire used to assess the severity of fatigue
and the impact on daily functioning during the past week [34,38,12,39]. Participants indicate on
a 7-point Likert scale 1 being ‘strongly disagree’ to 7 being ‘strongly agree’, the extent to which
they feel each statement applies to them. A total sum score out of 63 is calculated, with higher
scores indicating a greater impact of fatigue.
The VAFS is a one-item questionnaire used to assess the participants’ global fatigue.
Participants rate on a 10-point Likert scale 0 being ‘worst’ to 10 being ‘normal’, the extent to
which they feel the statement applies to them. A total sum score out of 10 is calculated, with
lower scores indicating an increase in fatigue severity.
Following completion of the fatigue questionnaires, participants were required to
complete a 6MWT. Procedures were adopted from the American Thoracic Society guidelines.
Participants were able to use assistive devices if needed, while walking a 26 meter linear course,
marked by 2 meter increments. Participants were instructed to walk as fast as possible along the
marked course, turn around at the last marker, return to the start, and repeat this course as often
as possible in six minutes. The time elapsed was measured with a stopwatch, and the distance
walked per minute was measured and summed for total distance in meters. Verbal
encouragement was provided and a scripted text was used to provide guidance before, during,
2.1.3 Measurement of Isometric Strength and Fatigue
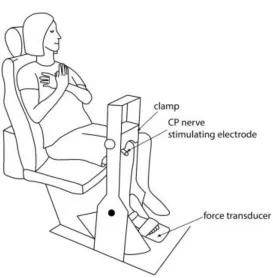
Participants were seated upright in the ankle dynamometer (McComas and Belanger
1981) with their right ankle positioned at 30° plantar flexion and hip and knee angles of 90°.
Velcro straps were fastened across the participant’s foot (Figure 2.2). Additionally, during all
contractions, participants were instructed to fold their arms across the chest to avoid extraneous
movement.
The test protocol commenced with a series of submaximal isometric contractions for the
purpose of warm-up and familiarization. Participants then performed repeated (3-5 repetitions),
brief (~ 5s) MVICs of the ankle DF, each separated by 2 minutes of rest. Maximal torque was
attained when two consecutive MVICs differed by less than 5%. Participants were provided with
strong verbal encouragement. Torque was displayed in real-time on an online system using the
Spike 2 software in attempt to obtain maximal effort.
The fatigue protocol consisted of a sustained submaximal voluntary isometric contraction
(50% MVIC) held to the limit of endurance. Torque produced by each participant and two lines
identifying the target torque (50% MVIC) and cut off torque level (40% MVIC) were displayed
using Spike 2 software. Task termination resulted when the participants torque dropped below
the 40% MVIC line twice and the time to task failure (TTF) in seconds was recorded.
Immediately following task termination, participants completed one final MVIC of the ankle DF
muscles, while the study examiner manually delivered an electrical stimulation ~ 1s prior, during
maximal plateaued torque, and ~1s following their maximal contraction. To score global fatigue,
2.1.4 Measurement of Voluntary Activation
Voluntary activation
Participants were seated upright in the ankle dynamometer (McComas and Belanger
1981) with their right ankle positioned at 30° plantar flexion and hip and knee angles of 90°.
Velcro straps were fastened across the participant’s foot (Figure 2.2). Additionally, during all
contractions, participants were instructed to fold their arms across the chest to avoid extraneous
movement.
To obtain the maximal twitch torque, electrical stimulation was applied to the peroneal
nerve around the fibular head with a constant current stimulator (DS7AH, Digitimer, UK). A series
of incremental stimuli of increasing intensity were delivered to the resting muscle. Once the
torque output reached a plateau, the stimulus was deemed maximal. The stimulus was then
increased an additional ~10% to achieve supramaximal stimulation.
The test protocol commenced with a series of submaximal isometric contractions for the
purpose of warm-up and familiarization. Participants then performed brief (~ 5s) MVICs of the
ankle DF muscles. A single supramaximal stimulus was applied to the peroneal nerve prior to
their MVIC. A second supramaximal stimulus was applied at the point of maximal voluntary
torque, which was visually determined as the point of torque plateau. A third single
supramaximal stimulus was delivered at rest ~1s following their MVIC to obtain the potentiated
twitch. This procedure was repeated 3-4 times for each participant, followed by 2 minutes rest
between trials.
A standard equation (VA (%) = (1 – (interpolated twitch /potentiated twitch)) x 100 was
twitch evoked at the peak of the MVIC in response to the supramaximal stimulation of the
peripheral nerve.
Figure 2.2. Schematic representation of the experimental setup (with permission from Alexandra Lynette-Krech, (2017))
2.1.5 Statistical Methods
All analyses were performed using Statistical Package for the Social Sciences (Version
Shapiro-groups for demographic data, fatigue-scaled scores, 6-MWT, MVIC, VA, and TTF. The
association between the dependent variables, such as the MFIS, FSS and VAFS, and the different
measures of MVIC, VA, 6-MWT, and TTF as the independent variables were determined using
Pearson's correlation analysis. A split-plot analysis of variance (group by time) was performed to
investigate a potential interaction for MS participants versus healthy controls at baseline and
post-fatigue on MVIC, VA and VAFS scores. If a significant interaction was detected, a Tukey
post hoc analysis was performed to determine where the differences existed. A significance level
of p≤0.05 was used for all statistical tests. All values are reported in mean ± standard deviation
(SD).
2.2 RESULTS
2.2.1 Demographics
Subject characteristics are present in Table 1. Participants ranged in age from 22 to 60
years, with an average age of 39 years (SD= 10 years). No difference was observed in age
between the MS group and healthy controls. The majority of participants were of Caucasian
descent, with the exception of one African Canadian participant belonging to the MS group.
According to international classification standards for body mass index (weight (kg) / height
(m)2), on average, both groups were slightly overweight (BMI≥ 25). EDSS scores for the MS
group ranged from 2.0 to 6.5 points, with an average of 4 points (SD= 2 points). The majority of
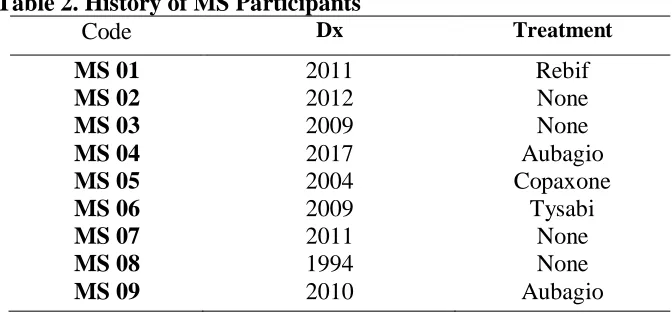
MS participants were currently taking DMTs as a part of their MS treatment regime. A brief
Table 1. Subject Characteristics
Group n Age (years)
mean ± SD
BMI
mean ± SD
EDSS
mean ± SD
Control 9 35 ± 7 25 ± 3 n/a
MS 9 43 ± 11 27 ± 4 4 ± 2
Table 2. History of MS Participants
Code Dx Treatment
2.2.2 Fatigue Questionnaires and 6-MWT
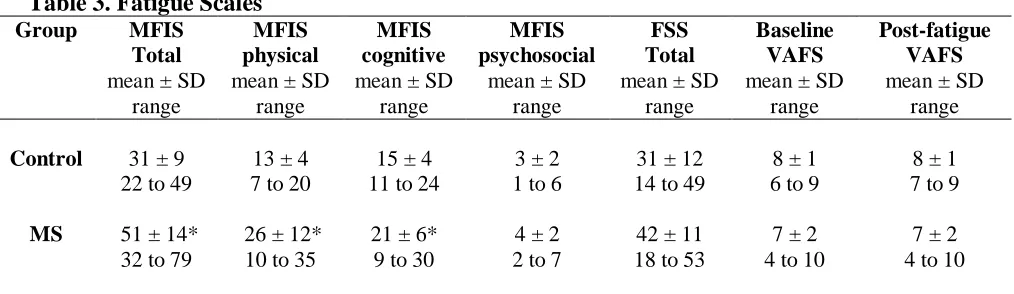
An overview of scores resulting from the MFIS, FSS and VAFS are included in Table 3.
According to the MFIS, the MS group experienced more fatigue compared with healthy controls
(p<0.05). Distance walked during the 6-MWT (r= -0.720, p= 0.001) (Figure 2.4), baseline MVIC
torque (r= -0.689, p= 0.002), post-fatigue MVIC torque (r= -0.666, p= 0.003), and baseline VA
(r= -0.589, p= 0.010) scores were all negatively associated with MFIS scores. No association
was found between MFIS scores and post-fatigue VA and TTF scores.
The MS group experienced more physical fatigue compared with healthy controls
(p<0.05). A negative association was observed between MFIS physical scores and distance
walked during the 6-MWT (r = -0.659, p= 0.003), baseline MVIC torque (r = -0.641, p = 0.004),
post-fatigue MVIC torque (r = -0.541, p = 0.020), and baseline VA (r = -0.609, p = 0.007)
scores. These findings suggest that the higher ratings of perceived physical fatigue were
associated with lower activation and strength of the DF muscles. No association was found
between MFIS physical scores and post-fatigue VA and TTF scores.
Like physical fatigue scores, the MS group experienced more cognitive fatigue compared
with healthy controls (p<0.05). Distance walked during the 6-MWT (r = -0.477, p = 0.045),
baseline MVIC torque (r = -0.498, p = 0.036), post-fatigue MVIC torque (r = -0.596, p = 0.009),
and post-fatigue VA (r = -0.504, p = 0.033) scores were all negatively associated with MFIS
cognitive scores. No correlation was found between MFIS cognitive scores and baseline VA and
TTF scores.
MFIS psychosocial scores did not differ between groups (p>0.05). However, MFIS
.628, p = 0.005). No association was found between MFIS psychosocial scores and MVIC, VA,
and TTF scores.
No difference was observed in FSS scores between the MS group and healthy controls
(p>0.05). However, the FSS was negatively associated with distance walked during the 6-MWT
(r = -0.731, p = 0.001), indicating higher ratings of perceived fatigue were accompanied by
shorter distance walked. No association was found between FSS scores and MVIC torque, VA,
and TTF scores.
Results from the 2-item VAFS indicated no difference between groups or scores
(p>0.05). In addition, disability status (EDSS) showed a significant association with FSS (r =
Table 3. Fatigue Scales Group MFIS
Total
mean ± SD range
MFIS physical
mean ± SD range
MFIS cognitive
mean ± SD range
MFIS psychosocial
mean ± SD range
FSS Total
mean ± SD range
Baseline VAFS
mean ± SD range
Post-fatigue VAFS
mean ± SD range
Control 31 ± 9 22 to 49
13 ± 4 7 to 20
15 ± 4 11 to 24
3 ± 2 1 to 6
31 ± 12 14 to 49
8 ± 1 6 to 9
8 ± 1 7 to 9
MS 51 ± 14*
32 to 79
26 ± 12* 10 to 35
21 ± 6* 9 to 30
4 ± 2 2 to 7
42 ± 11 18 to 53
7 ± 2 4 to 10
7 ± 2 4 to 10
2.2.3 Force Measurement and Fatigue Test
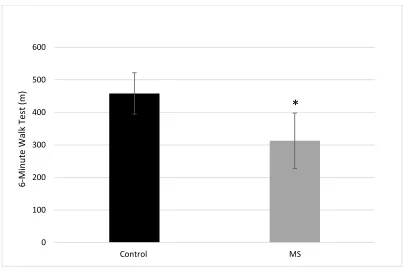
As shown in figure 2.3, the MS group walked a shorter distance compared with healthy
controls during the 6-MWT (p<0.001). A positive relation was found between distance walked
and baseline MVIC torque (r = 0.547, p = 0.019) scores, indicating that increased distance
walked was associated with increased MVIC torque.
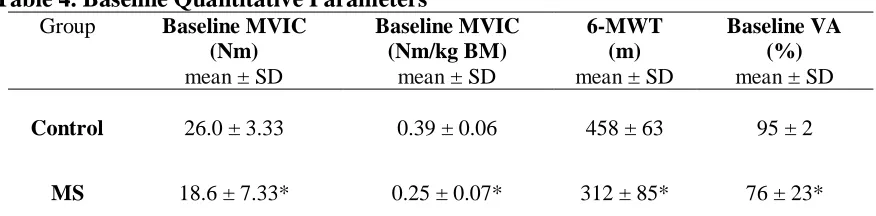
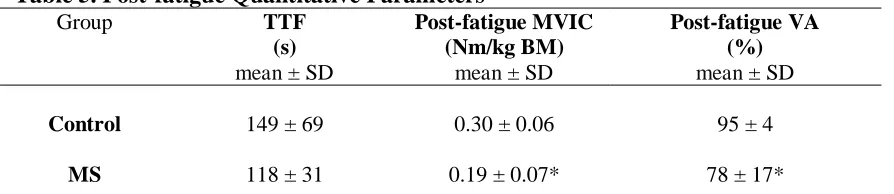
Baseline and post-fatigue scores on MVIC, VA, 6-MWT, and TTF are outlined in Table
4 and Table 5, respectively. The average strength (MVIC) for healthy controls was 26.06 ± 3.33
Nm, which was significantly stronger than the MS group who had an average MVIC of 18.61 ±
7.33 Nm (p<0.05). As shown in Figure 2.5, when normalized to participants’ body mass (BM),
healthy controls had greater MVIC torque scores compared with the MS group at baseline and
post-fatigue testing (p<0.05). Both groups MVIC torque decreased post-fatigue (p<0.05). There
was no interaction between participants (MS and healthy controls) and MVIC torque (F (1,16) =
0.94, p>0.05) at baseline and post-fatigue testing. There was a main effect on MVIC torque
within participants (F(1,16) = 37.60), p<0.001), as well as between groups (F(1,16) = 18.97,
p<0.001). As shown in figure 2.6, healthy controls had greater VA scores compared with the MS
group at baseline and post-fatigue testing (p<0.05). There was no interaction between participants
(MS and healthy controls) and VA (F(1,16) = 9.34, p>0.05) scores at baseline and post-fatigue
testing. There was a main effect on VA scores between groups (F(1,16) = 9.34, p<0.05). A
positive association was observed between MVIC torque and VA scores at baseline, indicating
that lower MVIC torque was accompanied by lower VA levels (r = 0.607, p = 0.008; r = 0.743, p
= 0.001, respectively).
As shown in Figure 2.7, no difference was found in average TTF scores between the MS
Table 4. Baseline Quantitative Parameters
Group Baseline MVIC
(Nm)
mean ± SD
Baseline MVIC (Nm/kg BM)
mean ± SD
6-MWT (m)
mean ± SD
Baseline VA (%)
mean ± SD
Control 26.0 ± 3.33 0.39 ± 0.06 458 ± 63 95 ± 2
MS 18.6 ± 7.33* 0.25 ± 0.07* 312 ± 85* 76 ± 23*
Table 5. Post-fatigue Quantitative Parameters
Group TTF
(s)
mean ± SD
Post-fatigue MVIC (Nm/kg BM)
mean ± SD
Post-fatigue VA (%)
mean ± SD
Control 149 ± 69 0.30 ± 0.06 95 ± 4
MS 118 ± 31 0.19 ± 0.07* 78 ± 17*
Figure 2.3. Distance walked during the 6-minute walk test
Distance walked (m) during the 6-MWT for healthy controls (black) and MS participants (grey). Distance walked was significantly shorter in the MS group (p<0.05). Values are presented as means ± SD. * Represents a significant difference between healthy controls and MS participants.
0 100 200 300 400 500 600
Control MS
6-M
inut
e
W
al
k T
es
t (
Figure 2.4. Correlation between 6-minute walk times and MFIS scores
A strong correlation exists between distance walked during the 6-minute walk test and MFIS scores (r = 0.720, p = 0.001) in healthy controls (black) and MS participants (grey).
0 10 20 30 40 50 60 70 80
0 100 200 300 400 500 600 700
M
FIS
S
core
6-Minute Walk Test (m)
Control
Figure 2.5. Strength of the DF muscles
Peak torque (Nm/kgBM) of the DF muscles normalized to subjects’ BM of healthy controls (black) and MS participants (grey). MS participants were significantly weaker than healthy controls (p<0.05). Both groups decreased torque post-fatigue (p<0.05). Values are presented as means ± SD. Represents a significant effect within healthy controls and MS participants. * Represents a significant effect between healthy controls and MS participants.
Figure 2.6. Voluntary activation of the DF muscles
Voluntary activation (%) of the DF muscles for healthy controls (black) and MS participants (grey). Voluntary activation was significantly lower in MS participants at baseline and post-fatigue testing (p<0.05). Values are presented as means ± SD. * Represents a significant effect between healthy controls and the MS participants.
Figure 2.7. Time to task failure
Time to task failure (s) during submaximal contraction of the DF muscles held to the limit of endurance for healthy controls (black) and MS participants (grey). No difference was observed between groups (p>0.05). Values are presented as means ± SD.
0 50 100 150 200 250
Control MS
Ti
me t
o
Ta
sk
F
ai
lure
(s
2.3 DISCUSSION
The study assessed the impact of muscle strength and voluntary activation on
symptomatic fatigue in individuals with MS. It was hypothesized that individuals with MS would
exhibit 1) reduced muscle strength and voluntary activation, which would correlate to 2) a higher
symptomatic fatigue rating, 3) greater fatigability on an objective test of neuromuscular fatigue
and 4) a reduced 6-minute walk time. The main findings demonstrated that individuals with MS
have reduced muscle strength, voluntary activation, and 6-minute walk times compared with
healthy controls. Individuals with MS reported higher levels of symptomatic fatigue, which were
strongly associated with normalized peak torque and voluntary activation for DF muscles. No
relation exists between symptomatic fatigue and fatigability.
As fatigue is a predominant characteristic of MS, the observation that individuals with
MS report greater fatigue than healthy controls is well supported by previous research [7,44,20].
In the present study, individuals with MS subjectively reported themselves significantly more
fatigued on the MFIS, FSS and VAFS than healthy controls. A difference in the total MFIS score
was observed between groups. Furthermore, a significant difference in MFIS physical and
cognitive scores was observed between groups. However, no difference was observed in
psychosocial scores. Previous research using self-report scales have indicated a strong
correlation between total MFIS and FSS scores [34,45]. Consistent with the findings, a strong
relation existed between MFIS and FSS scores in the present study, however, no difference was
observed in FSS scores between groups. One possible explanation for the non-significant finding
in the FSS may be due to the relatively small sample size (N=18), and large group variance in the
present study. Studies that have reported significant findings incorporated a larger sample size