ABSTRACT
LATIF, TAHMID. Tissue-Electrode Interface Characterization for Optimization of Biobotic Control of Roach-bots. (Under the direction of Dr. Alper Bozkurt).
Biobotics uses live insects as biological robots whose locomotion can be controlled by neural or muscular stimulation using implanted electrodes and insect body-mounted electronic backpack. The resulting insect biobots, with a natural ability to crawl through small spaces, offer unique advantages as an alternative to centimeter-scale synthetic robots. A cyberphysically organized swarm of these biobots could prove useful for search and rescue applications in post-disaster environments: especially for mapping under-rubble scenarios and locating trapped survivors. We have achieved precise control of Madagascar hissing cockroach biobots or roach-bots using antennal stimulation in laboratory experiments, where we developed and used a vision based automated system for objective assessment of their biobotic capability. In addition to demonstration of manual and automated navigation experiments, we have been able to autonomously localize a sound source and guide a biobot towards it, using an electronic backpack with an array of directional microphones. These techniques can prove helpful in search and rescue applications.
Tissue-Electrode Interface Characterization for Optimization of Biobotic Control of Roach-bots
by Tahmid Latif
A dissertation submitted to the Graduate Faculty of North Carolina State University
in partial fulfillment of the requirements for the degree of
Doctor of Philosophy
Electrical Engineering
Raleigh, North Carolina 2017
APPROVED BY:
_______________________________ _______________________________
Dr. Alper Bozkurt Dr. Edward Grant
Committee Chair
_______________________________ _______________________________
DEDICATION
To Family,
BIOGRAPHY
ACKNOWLEDGMENTS
First, I would like to acknowledge my advisor Dr. Alper Bozkurt for his unending advice and support during my graduate studies at NC State. I was one of the first members of his iBionicS Lab, where I got the amazing opportunity to be part of the roach biobot project, and subsequently, the CINEMa (Cyborg Insect Networks for Exploration and Mapping) project. As a professor, course instructor and mentor, he has encouraged me to become an effective researcher and thinker, starting with planning and performing to presenting and communicating the research. As I am completing my degree program, I look back and realize how greatly he has influenced my path towards a deeper understanding of my field of study and research.
I am thankful to my committee members and collaborators: Drs. Edward Grant, Edgar Lobaton, Coby Schal, and Mihail Sichitiu, who were of immense help with their comments and feedback. Dr. Edward Grant was also one of my notable course instructors. I would also like to acknowledge Dr. H. Troy Nagle, another influential course instructor; I had the privilege of taking a number of courses with, all of which I thoroughly enjoyed, and in the process, learned a great deal. I am also grateful to Dr. K Siddique-e-Rabbani, one of my undergrad professors and mentor, who has been an inspiring presence in my academic life.
Hong Xiong and Jeremy Cole for their assistance with the CINEMa collaborative experiments.
Michael McKnight deserves another note of thanks for his help with fabricating the microfabricated electrodes at the NCSU Nanofabrication Facility (NNF). The fabrication work was performed in part at the NNF, a member of the North Carolina Research Triangle Nanotechnology Network (RTNN), which is supported by the National Science Foundation (Grant ECCS-1542015) as part of the National Nanotechnology Coordinated Infrastructure (NNCI). Thanks to Chuck Mooney of Analytical Instrumentation Facility (AIF) for his help with the SEM imaging of the electrodes. This was performed at the AIF at North Carolina State University, which is supported by the State of North Carolina and the National Science Foundation (award number ECCS-1542015). The AIF is a member of the North Carolina Research Triangle Nanotechnology Network (RTNN), a site in the National Nanotechnology Coordinated Infrastructure (NNCI). I acknowledge the support of our funding agency, the National Science Foundation for making this research possible. Our research was fully funded by the National Science Foundation under the Cyber-physical Systems Program (Award Number 1239243). Thanks also go to Dr. Schal and Rick Santangelo for supplying the roaches for our experiments, and to Dr. Michael Dickey and Tim Shay for supply of EGaIn.
acknowledges his wife, Mirza Farzana Halim, for her endless and overwhelming support, and everything and whatnot through this long journey.
TABLE OF CONTENTS
LIST OF TABLES ... ix
LIST OF FIGURES ... x
CHAPTER 1 Introduction ... 1
CHAPTER 2 Laboratory Assessment of Search and Rescue Roach-bots ... 6
2.1 Introduction ... 6
2.2 Electrode Insertion and Backpack Design for Biobotic Control ... 10
2.3 Evaluation of Biobotic Control Capability ... 13
2.3.1 Evaluation on Flat Arenas ... 13
2.3.2 Evaluation in Maze Navigation Platform ... 18
2.4 Sound Localization Sensors for Biobots ... 20
2.4.1 Microphone Array for Sound Localization ... 20
2.4.1.1 Sensor Array Design ... 20
2.4.1.2 Microphone Characterization ... 22
2.4.1.3 Sound Source Estimation ... 24
2.4.2 Steering Insects towards a Sound Source ... 25
2.6 Conclusion ... 29
CHAPTER 3 In vitro Electrochemical Assessment of Neurostimulation Electrodes . 30 3.1 Introduction ... 30
3.2 Biobotic Electrodes ... 35
3.2.1 SS Electrodes ... 35
3.2.2 Microfabricated AuP Electrodes ... 37
3.2.3 EGaIn Electrodes ... 39
3.2.4 SS-EGaIn Electrodes ... 40
3.3 Experimental Methods ... 40
3.3.1 Electrochemical Impedance Spectroscopy ... 41
3.3.1.1 Interface equivalent circuit model: ... 41
3.3.2 Cyclic Voltammetry ... 43
3.3.3 Accelerated Aging of Electrodes ... 43
3.4 Results and Discussion ... 44
3.4.1 Electrochemical Impedance Spectroscopy Results... 44
3.4.2 Cyclic Voltammetry Results ... 47
3.4.3 Accelerated Aging Test Results ... 48
3.5 Conclusion ... 51
4.1 Introduction ... 53
4.2 Experimental Setup and Methods ... 58
4.2.1 Electrodes and Implantation ... 58
4.2.2 Biobotic Backpack for Neurostimulation and Impedance Spectroscopic Assessment ... 60
4.2.2.1 Neurostimulation-Analyzer System Verification ... 62
4.2.3 Test Arena... 65
4.2.4 Data Analysis ... 67
4.3 Results and Discussion ... 68
4.3.1 SS Electrodes ... 69
4.3.2 SS-EGaIn Electrodes ... 73
4.4 Conclusion ... 77
CHAPTER 5 Conclusion ... 79
REFERENCES ... 82
APPENDICES ... 92
LIST OF TABLES
TABLE2.1 PAYLOAD CAPACITY OF MADAGASCAR HISSING COCKROACHES 12 TABLE2.2 AUTONOMOUS SOUND LOCALIZATION GUIDED STEERING 26
TABLE3.1 ELECTROLYTE-ELECTRODE INTERFACE CIRCUIT MODEL PARAMETERS 46
TABLE3.2 INTERFACE CIRCUIT MODEL PARAMETERS AFTER ACCELERATED AGING OF ELECTRODES
50
TABLE4.1 EQUIVALENT CIRCUIT MODEL PARAMETERS FOR ROACH-BOTS WITH SS
ELECTRODES
71
TABLE4.2 EQUIVALENT CIRCUIT MODEL PARAMETERS FOR ROACH-BOTS WITH SS-EGAIN ELECTRODES
LIST OF FIGURES
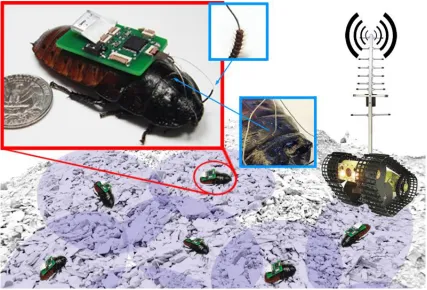
Fig. 2.1. Conceptual image of a biobotic mobile sensor network with only the biobotic agents at the surface are shown, (inset) Gromphadorhina portentosa insect biobot with neurostimulation backpack. Magnified images of electrode implantation to antenna and through a hole in thorax (mesothorax) are shown.
7
Fig. 2.2. Process flow diagram of insect biobot system. 11
Fig. 2.3. Biobot completing an S-shaped path. 13
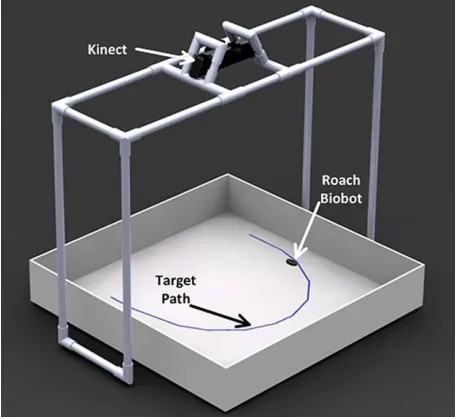
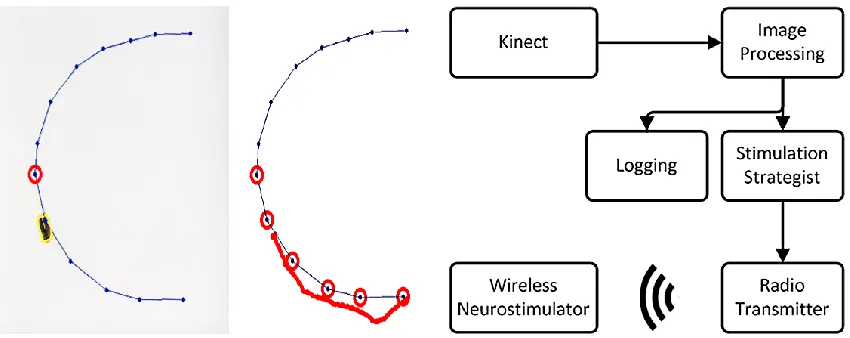
Fig. 2.4. Kinect-equipped test arena for automated experiments. 14 Fig. 2.5. Video feed and active path from Computer Vision software showing insect
biobot on a semi-elliptical path with 13 waypoints. Process flow diagram of the Kinect-based automated system.
15
Fig. 2.6. Paths taken by insects in ten automated trials. 17
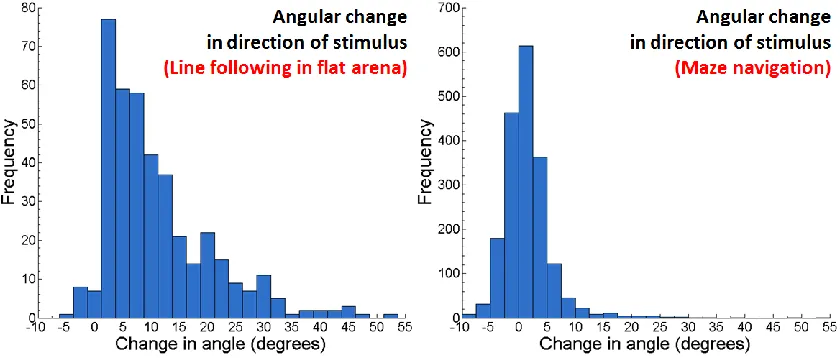
Fig. 2.7. Histogram of angular change in desired direction in response to a stimulus, for line following and maze navigation.
18
Fig. 2.8. Maze Arena with overlay of path taken by a biobot on designated path. 19 Fig. 2.9. Biobot backpack with unidirectional microphone array for sound source
localization.
21
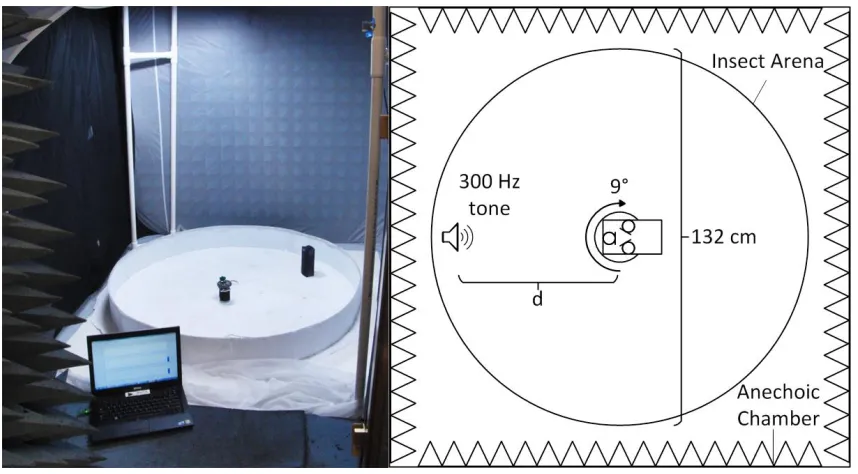
Fig. 2.10. Architecture of sound processing and localization pipeline. 21 Fig. 2.11. Anechoic chamber used for microphone calibration, and diagram of
calibration setup.
22
Fig. 2.12. Polar directivity plot for each microphone. 23
Fig. 2.13. Directional response of each microphone at varying sound intensity. Local regression was used to fit the surfaces to the collected data. The peak amplitude occurs when the source is directly in front of a particular microphone.
24
Fig. 2.14. Robotic trial of automated steering with varying orientations from same start location, with varying start location and orientation away from speaker.
Fig. 2.15. Insect biobot paths with random orientation and the same start location. (inset) Analysis of predicted vs actual direction of arrival for a single insect trial.
27
Fig. 3.1. Illustration of a cyber-physically organized under-rubble biobotic swarm acting as a mobile sensor network.
31
Fig. 3.2. (a) Electrode setup with commercially available SS electrode: (inset) tip of SS and EGaIn coated SS electrodes. (b) EGaIn in Tygon tubing for use as an electrode (metal wire at one end for connection to external circuit).
36
Fig. 3.3. (a) Cross-sectional illustration and SEM image of microfabricated gold electrode. (b) Microfabricated electrode with gold and electropolymerized tips shown.
37
Fig. 3.4. Typical arrangement for in vitro three electrode and two electrode electrochemical cell measurements.
40
Fig. 3.5. (a) Equivalent circuit model of an electrolyte-electrode interface. (b) Modified version of the model for SS-EGaIn electrodes.
42
Fig. 3.6. EIS plots for all electrodes types. 45
Fig. 3.7. CV plots for all electrodes types in 2 electrode cells. 48 Fig. 3.8. EIS plots of electrodes obtained over a period of 2 weeks with results at t =
0, 1 week, and 2 weeks shown.
49
Fig. 3.9. Charge injection capacity of electrodes calculated from data obtained over a period of 2 weeks, with results at t = 0, 1 week, and 2 weeks shown.
51
Fig. 4.1. Hissing cockroach antenna with magnified image of the flagellum showing sensilla, (inset) Various parts of a cockroach antenna labeled. SEM image of part of a flagellum with sensilla.
54
Fig. 4.2 Implantable SS/SS-EGaIn electrode setup with tip of SS and SS-EGaIn electrodes shown.
58
Fig. 4.3 Gromphadorhina portentosa roach-bot with neurostimulation backpack. (inset) SS electrode implants to antenna and through mesothorax shown. (right) SEM image of an SS electrode implanted to an antenna.
60
Fig. 4.5 Gromphadorhina portentosa roach-biobot with AD5933-based backpack beside a Gamry potentiostat.
62
Fig. 4.6 (a) Equivalent circuit model of a tissue-electrode interface. (b) Modified version of the model for SS-EGaIn electrodes.
63
Fig. 4.7 Electrochemical impedance spectroscopy plots for validity test circuits. 64 Fig. 4.8 Experiment setup with a roach-bot in the partial-maze arena. Process flow
diagram for biobotic control and the resulting angular response are shown. (inset, left) Top-view of the arena showing a roach-bot at the center, with the designated path and direction of movement in blue and path taken by the roach-bot in red.
66
Fig. 4.9 EIS plots for (left) right antennal and (right) left antennal tissue-SS electrode interface.
71
Fig. 4.10 Relationship between resultant mean angular response, impedance at 1 kHz and number of applied stimuli for SS electrodes in right antenna and left antenna.
72
Fig. 4.11 EIS plots for (left) right antennal and (right) left antennal tissue-SS-EGaIn electrode interface.
73
Fig. 4.12 Relationship between resultant mean angular response, impedance at 1 kHz and number of applied stimuli for SS-EGaIn electrodes in right antenna and left antenna.
CHAPTER 1 Introduction
Imagine a natural disaster, like an earthquake, causing a building to collapse with people inside end up trapped underneath its rubble. As sad as this may sound, unfortunate situations like this frequently happen all across the globe. Although assisted by dogs, and life detection tools and techniques [1], first responders often come across difficulties searching for survivors and pinpointing their exact location deep within the rubble. Larger robotic systems has been used to assist with surface-level surveying of the disaster area and removing rubble [2], and a swarm of centimeter robotics can be envisioned for under-rubble mapping and surveying. However, current state of centimeter-scale robotics is not advanced enough to be immediately considered for locomotion in such undeterministic and challenging terrain. Until such centimeter-scale robots become available, Madagascar Hissing cockroaches (Gromphadorhina portentosa) can provide a low-cost alternative solution as roach biobots (biological robots) or roach-bots for investigating deep within building rubbles. Madagascar roaches are agile and moderately fast-moving insects, compotent climbers, and like most insects possess good navigational and locomotive capabilities. As such, they would be useful as agents travelling in dynamic environments such as through crevices in rubbles of post-disaster scenarios and in premises hazardous to humans and animals.
[9], [10], discoid cockroaches (Blaberus discoidalis) [11], and huntsman spiders (Heteropoda venatoria) [12]. Our research group at North Carolina State University has been able to precisely control the locomotion of the roach-bots by remotely applying selective neurostimulation at the antenna/cerci using implanted electrodes and a low-power electronic backpack, made with off-the-shelf components including a Zigbee enabled system-on-chip [9]. Our backpacks weigh around 2 g, including a lithium-polymer battery, which is well within the average payload capacity of adult hissing cockroaches [9]. If a stimulus is applied to the right antenna, these roach-bots turn left and vice versa. Cerci stimulation makes these to move forward by triggering their escape response [13]. We have developed an evaluation platform for biobotic control using a Kinect camera and a custom-built software procedure [7], [9]. This platform enables the objective assessment of the performance of biobots through automated navigation experiments and associated data collection. To test their biobotic working capability in this platform, we make instrumented insects to follow lines [6], [7], go through mazes [8], and be autonomously guided to a sound source using on-board microphones [9] – a technique which may particularly prove instrumental when localizing survivors calling out for help call.
strength [14], [18] and inertial measurement units [19]. This would improve information gathering and subsequent sharing of it with first responders, thereby helping to save crucial time. In parallel to working with a sensor network, biobotic system reliability needs to be ensured to prevent failure in real world settings. We have observed gradual inaction or decrease in biobotic response to neurostimulation over the time course of several weeks in some laboratory-based experiments. We could hypothesize this to be an effect of the bioelectrical coupling at the insect tissue-electrode interface failing owing to the interface’s delicate nature [20], [21]. Repetition of similar biobotic inaction in real life scenarios may cause undesirable interruption in search and rescue operations. For efficient biobotic control, research questions that need to be answered are: (i) how well our implanted electrodes will perform over time under various conditions, (ii) how the electrodes will affect the roach tissues electrodes are implanted in, and (iii) if control of the roach-bots can be optimized.
real-time assessment of the tissue-electrode interface can be performed at the locations of electrode implantation using backpack-based circuitry [23]. Electrochemical assessment, such as elelctrochemical impedance spectroscopy, can be used to characterize the interface, and remotely monitor the variation in the interface quality. By using an electrical equivalent model of the interface, we further analyze the interface in terms of hypothetical parameters responsible for charge transfer across the interface, induced by an applied stimulus. Remote monitoring at regular intervals enables us to check the interface condition up and infer how this would change over time. This analysis, in turn, demonstrates the efficacy and reliability of the charge transfer process across the interface.
roach-bots would effectively help first responders to pinpoint surviving victims or locate signals of interest.
CHAPTER 2 Laboratory Assessment of Search and Rescue Roach-bots1
2.1 Introduction
Advances in neural engineering, when combined with a miniaturized system-on-chip (SoC) containing wireless communication and control circuits, have the potential to enable the direct control of insect locomotion remotely. This novel field of “biobotics” provides new approaches to address issues where conventional and centimeter-scale robotics may fall short.
Emergency response is one potentially useful application of biobotics. Often, valuable time is wasted in devising a suitable search pattern for finding survivors after a disaster, for example, inside a building collapsed by an earthquake. Recently, first responders have begun incorporating robotics in these tasks [24]–[26]. While these robots can search for survivors and evaluate environmental conditions at the surface level, their often large size makes them currently unfit for exploring deeper parts of the rubble. Moreover, searching a large area with an individual robot requires much more time and effort than simply directing a collection of robots interacting and collaborating to achieve the same goal. A swarm of robots with centimeter-scale agents can offer a fast solution to searching for survivors in such scenarios. Although it is promising in the long-run, the current technology falls short in providing robotic solutions in smaller scales that are capable of operating under dynamic conditions and on complex terrains [27]–[29]. An alternative solution, until centimeter-scale synthetic
robots become practical, is insects “working” as biobots (Fig. 2.1) [6]–[9], [14], [16], [22], [30], [31]. For example, a crawling insect like the Madagascar Hissing Cockroach, Gromphadorhina portentosa, acting as an instrumented biobot can prove to be effective in search and rescue missions after natural disasters because of its agility and ability to be efficiently navigate in unknown and dynamic environments. The use case here is a biobotic insect network formed under the rubble where the insects walk naturally during the search process and biobotically directed or biased towards certain direction if necessary, for
example, when they need to aggregate around a detected target signal for higher resolution detection or when they are getting out of the network coverage.
There has been considerable progress made toward locomotive control of insect biobots through neurostimulation. The study presented here achieves the most precise control so far with any insect species, demonstrates manual and “autonomous” control of insects and introduces automated evaluation techniques to characterize the biobotic control capability. Insects equipped with wireless neurostimulation backpacks could exhibit a cyber-physically organized swarm behavior and enable the formation of a mobile sensor network (Fig. 2.1). The spatial distribution of the nodes can be achieved through remote biasing of the biobots’ movement [4]–[9], [11], [12], [14], [16], [20], [22], [30]–[39] or by simply allowing the insects to move naturally and spread out on their own [40], [41]. While the latter leverages their natural ability to move robustly in unknown conditions, direct locomotive control of the biobots would allow operators to guide them to a desired location and maintain their position as sensor nodes [8] that can relay information. Sensors on these nodes can pick up relevant environmental signals and transmit the information to a base station for subsequent processing and monitoring.
distinct tone on the backpack would also enable other biobotic agents picking up the tone with a microphone to estimate the inter-biobot distance and direction for node localization.
computational power [48]. Our efforts in this paper expand on these reported previous works by considering the system limitations imposed by the design constraints for this application.
The presented techniques in this paper can be summarized as follows: Section 2.2 describe the surgical procedure for electrode implantation, neurostimulation of the antennae and the ZigBee-enabled insect backpack system. Section 2.3 details the methods to achieve biobotic Gromphadorhina portentosa. We also present an automated evaluation platform to test the biobotic control capability in a flat arena and maze environment. Section 2.4 focuses on the microphone array implemented on the insect backpack and the supporting algorithms for acoustic source localization. The aim of this sensor is to localize a sound source in the laboratory environment and steering biobots towards it as an initial step towards using biobots for listening to help calls under the rubble.
2.2 Electrode Insertion and Backpack Design for Biobotic Control
selected from a lab-reared colony that is exposed to an artificial day and night cycle (14 h light, 10 h dark). After a 24 h recuperation period, a lightweight electronic backpack is connected to the insect’s back using 3D printed reusable interlocking plastic connectors, pre-attached on the dorsal part of the abdomen using medical grade cyanoacrylate adhesive. The locomotion control strategy involves selective stimulation with 3 V monophasic electrical pulses at one or both of the antennal tissue-electrode interfaces. The actual voltage drop at the interface is lower than 0.7 V due to the resistive dissipation on the electrodes and extracellular medium. We theorize that this antennal stimulation simulates a virtual obstacle in front of the biobot resulting in a direction change towards the opposite-side of the stimulus [6], [7], [9].
Neurostimulation backpacks are made with commercial off-the-shelf components to
minimize cost (~$5). The typical weight without a battery is around 300 mg. The on-board system-on-chip (CC2530 from Texas Instruments) provides computational capability thanks to its 8051 microcontroller and consumes 29 mA during transmission, 24 mA during receiving and less than 1 µA in sleep-mode. It has provisions for sensor interfaces (e.g. microphones) with its built-in 8 channel 12-bit analog-to-digital converter (ADC) ports, wireless radio enabling transmission to a nearby data aggregator, and on-board ZigBee protocol stack. The backpack is powered by a lithium polymer (Li-Po) battery; the size of the battery is determined based on the duration of the experiment. The typical range is between 20 mAh (0.8 g) and 90 mAh (2.5 g) in order to keep the backpack weight well below the payload capacity.
The payload capacity of full-grown Madagascar hissing cockroaches has been determined to be approximately 15 g (Table 1.1). The speed of roaches carrying backpacks with increasing weight are compared with the speed of a control set of roaches without any implantation and carrying no backpack. The bare minimum weight which hinders free natural movement is the payload capacity of that particular roach and the backpack weight was kept much lower (less than one-third) than this limit for extended operation duration.
TABLE2.1
PAYLOAD CAPACITY OF MADAGASCAR HISSING COCKROACHES
Insect Biobot Parameters (n=24) Mean ± Standard Deviation
Payload Capacity (g) 15.5 ± 4.1
Length (cm) 6.8 ± 0.3
2.3 Evaluation of Biobotic Control Capability
2.3.1 Evaluation on Flat Arenas
After the electrodes are implanted and the backpack is installed, the first stage of the experimentation is to test the biobotic control capability quickly with a manual radio-frequency remote controller. For this, the biobot is placed on an S-shaped path and stimulation pulses are manually applied to make the biobot follow the line (Fig. 2.3) [6]. The video of a typical trial can be found online2. A failure, if any, in this initial test would indicate the need for reinsertion of the electrodes to target the flagellum more closely with a follow-up surgical procedure. If this does not improve the results, the insect is retired as
2 Video link: https://www.youtube.com/watch?v=gmbEX7zDzog.
multiple surgeries come with the risk of the tissue damage and decrease the probability of success. The surgery is performed with bare eyes and typically takes around 1-2 minutes. The typical success rate of electrode insertion resulting in successful manual remote control for each insect has been around 40%, where the main constraint is the anatomical variations among the insects. The success rate was calculated by performing surgeries on 10 insects each day on 10 different days where each insect was tested to walk on a 3 m long S-shaped curve back-and-forth at least once (Fig. 2.3). Failure in the surgeries is often encountered due to a shallow insertion depth thereby resulting in a loose connection between electrode and target area. The response to neurostimulation in such instrumented biobots is weak and often predominated by their natural instincts to the environment. Further studies are underway to improve the surgery related detriments and restrictions. We would like to highlight that we prefer simpler surgical procedures to enable an automated mass production line in the future. Automation of insertion and testing procedures would mitigate the yield limitations.
When the instrumented insect passes this initial and quick test, an automated platform is used for an objective evaluation of biobotic control on the particular insect [7]. This platform includes a Microsoft Kinect camera connected to a computer, overlooking a 1×1 m2 test arena (Fig. 2.4). The Kinect’s infrared depth camera can be used to run experiments in the dark as well to test the biobotic control capability during different times of the day. Automated line-following experiments are carried out on a semi-elliptical path consisting of multiple waypoints (Fig. 2.5). Custom computer vision software receives a video feed from the Kinect camera to identify and detect the position of the insect, with respect to the target line, every 500 ms. Meanwhile, a stimulation strategist issues an appropriate stimulation pulse train through a radio transmitter to guide the insect along the predefined path (Fig. 2.5). The vision system divides the path in 10 to 15 waypoints. At regular intervals, the stimulation strategist compares the insect’s direction of motion to the nearest waypoint. If the
vectors differ by more than 25°, a stimulation pulse is sent to steer the insect in the correct direction. As the roach gets within 4.5 cm of the target waypoint, the software advances to the next waypoint and directs the roach towards it. The thresholds can be changed based on experimental needs. This automation adds a feedback loop from locomotion to the microcontroller unit in Fig. 2.2.
For proof of concept, we present the results of an automated control experiment. For each trial, an insect with a backpack was placed at the start of the semi-elliptical path. The software introduced 13 waypoints, detected the insect, monitored its position every 500 ms, and applied a stimulus of 200 ms pulse width modulated (PWM) signal with a duty cycle of 95% whenever required. Out of approximately 100 trials performed with four different insects, 27 trials reached at least 11 of the 13 waypoints. Of these, a set of ten successful trials was selected randomly for further analysis. In five of these trials, the roaches completed the path in the clockwise direction and in the other five trials, the counter-clockwise direction. Fig. 2.6 shows the paths traveled by insects in these 10 random automated trials [7]. The red lines indicate trials in the clockwise (cw) direction, and blue trials in the counterclockwise (ccw) direction. Average reaction time after the application of a stimulus was found to be 80 ms. The success rate of the experiment was quantified from the average orthogonal deviation of the desired path. The deviation (2.1) was computed by dividing the area between the actual and target paths by the length of the target path.
∫ 𝐷(𝑥, 𝑦)𝑑𝑠 ∫ 𝑑𝑝
where D(x,y) represents orthogonal distance from a point on the path of the insect, S, to the target path, P. The area was approximated using a trapezoidal approach, owing to the discrete nature of the data, as shown in (2.2) [EMBC’13]. The jth waypoint is represented by w
j.
∑(𝐷(𝑥𝑖, 𝑦𝑖) + 𝐷(𝑥𝑖+1, 𝑦𝑖+1)) ∆𝑠2
∑|𝑤𝑗 − 𝑤𝑗+1|
(2.2)
The average deviation from the path for the 10 experimental runs was found to be 2.9 cm with a standard deviation of 0.7 cm. No significant difference was noticed in the deviation between the runs in the cw and ccw directions. The histogram of angular change is shown in Fig. 2.7. Videos recordings of typical runs are available online3.
3 Video link: https://www.youtube.com/watch?v=R-IzkGA9hTc.
2.3.2 Evaluation in Maze Navigation Platform
One major challenge in the biobotic control of insects is the presence of environmental factors that would affect their locomotory behavior, such as pheromones. Although these may be accounted for during a search and rescue mission by temporarily or permanently disabling the relevant sensory organs, there may be situations where these natural instincts would be beneficial for insects during their random walk for forming swarms or avoiding hazardous situations. One of these instincts is the exhibition of a positive thigmotaxis where cockroaches tend to walk or run along the wall. The insect biobots that demonstrate successful biobotic control in the previous flat arena are further challenged by the erected vertical walls in the test arena to form a maze platform (Fig. 2.8) as an additional complexity that better simulates real life scenarios [8]. The wall corners and shadowy areas are preferred by the insect naturally and hinder the completion of the maze. The video recording of a
typical test run is available online4.
As a representative result of biobotic control in this platform, Fig. 2.7 shows the distribution of angular change in the desired direction in response to a stimulus during five different maze navigation experiments. The angular change is calculated from the difference in the angular position of the insect biobot with respect to the zero axes on the arena plane before and immediately after it receives a stimulus. The mean angular change in the desired direction was 1.5° with a median value of 1.48°. Some of the individual responses in the direction opposite to that desired is a result of the natural wall-crawling instinct of insects. The overall net turn, however, was in the desired direction. In contrast, data from the line following experiments shows a distribution with a mean change of 11.82° and a median of 8.29° on a flat arena. The comparison offers evidence of biobotic performance being influenced in the presence of a narrow corridor and nearby walls and corners. Biobots can
4 Online link: https://www.youtube.com/watch?v=yQ8MB62w7jA.
still be navigated through a maze, albeit with some performance degradation due to the interactions with the wall. Moreover, a range of monitoring intervals from 200 ms to 500 ms were evaluated in conjunction with pulse trains containing pulses 30 ms to 200 ms wide and PWM duty cycle of 50% or 100%. Shorter durations were found to produce turns with a smaller radius of curvature, thereby enabling precise control over the biobots in paths with sharper turns. A moderate value of 400 ms with a pulse width of 40 ms and 50% duty cycle gave optimal results in most cases. Throughout the experiment, the monitoring period was kept significantly higher than the pulse duration to ensure balancing out charge delivered during stimulus application, and preventing action evoked by a stimulus from being affected by the next stimulus.
2.4 Sound Localization Sensors for Biobots
2.4.1 Microphone Array for Sound Localization
The biobots demonstrating successful control capability in the previous platforms are instrumented with a backpack containing microphones with a mission of autonomously localizing the source of a sound and physically approaching it [9].
2.4.1.1 Sensor Array Design
of radius 1 cm. The output of each microphone was fed to a high pass filter with a cutoff frequency of 106 Hz. The audio was then amplified and shifted such that the waveform is centered about the midpoint of the supply voltage to preserve both the positive and negative attributes of the sound wave for maximal information retention. Finally, the signal was passed through a passive anti-aliasing low pass filter with a cutoff frequency of 603 Hz
Fig. 2.10. Architecture of sound processing and localization pipeline [9].
before being sampled by the TI CC2530 ADC.
Data was sampled from each microphone with 14 bits resolution at a rate of 1.25 kHz. Data was transferred in 30 sample windows via direct memory access (DMA) to buffers where the sample with the maximum amplitude was extracted. This extracted maximum was transmitted wirelessly via ZigBee to a PC with a TI CC2531-based RF USB dongle for further analysis (Fig. 2.10). Data was transmitted in 90 byte chunks every 1.08 seconds.
2.4.1.2 Microphone Characterization
One challenge involved in amplitude based localization is the possible sensitivity variation in the microphone response. We observed that individual microphones with same model number from the same manufacturer exhibited different polar directivity characteristics and omnidirectional response.
In order to account for these differences and to examine the effects of distance and incidence angle on the microphone response, the array was characterized in an anechoic chamber (Fig. 2.11). The microphone array was mounted on a stepper motor with 1.8° steps. A speaker nearby played a 300 Hz sinusoidal calibration tone. The stepper motor, controlled with a National Instruments DAQ device, was spun in 9° increments, pausing for 3 s each step to sample audio using the windowed, maximum amplitude approach described previously. Data was transmitted to a PC for further analysis. For each trial, the intensity of the sound at the array was measured using a portable soundmeter. The result of this analysis allowed for the selection of microphones with similar sensitivities to have a symmetrical overall polar directivity curve. Representative results from a trial are shown in Fig. 2.12. The sensitivity is stronger at certain angles and insects’ natural or biobotic turns during locomotion provides steering the sensitivity in all the directions.
2.4.1.3 Sound Source Estimation
The traditional method of obtaining the source direction is using the time difference of arrival of a sound signal to each of the microphones. With a 1 cm space between the microphones, the time difference is roughly 30 µs and challenging to detect given the sampling rate and processing speed limitations of the backpack microcontroller. Instead, the relative amplitude of each signal is examined to estimate the direction of arrival, making real-time processing feasible.
For sound intensity picked up by each microphone, a single value for amplitude corresponding to the direction angle was obtained by taking the median value in a 3 s window. Local regression was used to fit a surface to amplitude vs. intensity and direction data for each of the microphones. As expected, each surface had a peak at an increment of 120°. These calibration surfaces were precomputed for each microphone array. Surfaces from an array are shown in Fig. 2.13.
The computed surfaces were evaluated on a mesh with a resolution of Δx=1° and
Δy=0.32 dB. A new measurement from each microphone for an unknown direction and intensity was compared with these precomputed values. For each of the three microphones (n:1-3), the error between the measured amplitude (Mnxy) and computed amplitude (Cnxy) at a particular location was calculated and the point on the mesh with the minimum error, according to (2.3), was taken as the estimate for the direction and intensity.
arg 𝑚𝑖𝑛𝑥,𝑦∑ (𝑀𝑛𝑥𝑦− 𝐶𝑛𝑥𝑦)2
𝑛
(2.3)
2.4.2 Steering Insects towards a Sound Source
The described source estimation technique allows for real time processing of the data being streamed from the microphone array. MATLAB was used to compute the estimated direction of arrival every 720 ms. This estimated direction was transmitted over a local socket to the stimulation strategist software [7], which was responsible for tracking, stimulus control, and data logging as described earlier. When the insect’s deviation from the estimated sound source exceeded 45°, a stimulus was issued to correct its path.
75 cm from the speaker. The results of the autonomous sound localization guided steering trials are shown in Fig. 2.14 and Table 2.2. Videos of hexbug trials can be found online5.
Finally, the microphone array was evaluated on roach biobots. The insect biobots were placed in a start region, approximately 65 cm from the speaker in random orientations and
5 Online link: https://www.youtube.com/watch?v=ss0v6hePSWY.
Fig. 2.14. (left) Robotic trial of automated steering with varying orientations from same start location, (right) with varying start location and orientation away from speaker [9].
TABLE2.2
AUTONOMOUS SOUND LOCALIZATION GUIDED STEERING
Distance to Sound Source (cm)
Time to reach Sound Source (s)
Hexbug (varying orientation) (n=8, success=8, fail=0)
73.5 ± 1.1 61.6 ± 9.1
Hexbug (varying location) (n=8, success=8, fail=0)
76.3 ± 2.1 66.8 ± 1.8
Roach biobot
( n=6, success=4, fail=2)
automatically steered towards the source based on the sound detection every 720 ms. The neurostimulation pulse profile was selected to be five consecutive 30 ms pulses, each with 50% duty cycle with a no-pulse duration until the next pulse. Sample results of a sound localizing biobot are shown in Fig. 2.15 and Table 2.1. Video of a biobot trial can be found online6. The average error between the true direction of arrival and the estimated direction was 27.3°, evaluated every 720 ms.
6 Online link: https://www.youtube.com/watch?v=oJXEPcv-FMw.
2.5 Discussion
Although the current design of the sound localization system runs in real time, it requires remote processing. This aids in evaluation of the microphone array and the navigation control scheme, but requires significant wireless data transmission. An on-chip algorithm would be more power efficient since the radio could remain off most of the time. The biggest challenge in realizing this goal is the calibration required for the microphones. The current method of source estimation requires an analysis of the pre-computed calibration surfaces, which takes into account the effects of sound reflection from nearby surfaces. A generalized model of microphone response could enable online source estimation as well as generalization to new environments. However, future work remains to determine the effects of sound reflection and reverberation in a disaster environment. Another limitation of the current implementation of the microphone array is in the dynamic range of the audio signal. The systems can effectively localize sound within a 2.4 m radius. At further distances, additional amplification is required. Improvements in microphone range and accuracy are underway to help address this issue. A dynamic amplification may also allow localization at further distances while preventing saturation at close range.
intra-network transmission between biobotic agents acting as sensor nodes and data transmission from nodes to a base station, utilizing relatively lower power.
An ongoing challenge with this work is the observation that some insects fail to respond to any kind of stimulus. We hypothesize that this is due to degrading performance of the tissue-electrode interface [35], [51]. More investigations follow this chapter.
2.6 Conclusion
CHAPTER 3 In vitro Electrochemical Assessment of Neurostimulation Electrodes
3.1 Introduction
Research and development on biological robots or biobots are tied to advancements in the field of neural engineering. Implanted electrodes in target locations of an insect’s body can be used for applying the required neural or muscular stimulation to evoke predetermined effects. System-on-chip-based electronic backpacks have been proven successful in controlling direction of locomotion in both aerial [3], [5] and terrestrial [9]–[11] biobotic insects. Flight muscle stimulation in moths evoke wing flapping [5] while antennal neurostimulation in cockroaches leads to changing direction of motion through simulating obstacles [6], [9]. We applied voltage-controlled stimuli at the right (left) antenna of Madagascar hissing cockroaches (Gromphadorhina portentosa) to make the roach-bot turn left (right); the change in motion was evident from a turning or angular response to the stimuli. After achieving remotely controlled line following roach biobots, we were able to guide them to navigate through mazes and autonomously locate sound sources [8], [9].
together with the capability of remotely directing a biobot to [9] and maintaining its position at [8] an area for gathering information. Biobotic assistance in terms of complex terrain exploration and mapping [17], monitoring environmental conditions for operational assessment, and survivor position localization through sound sensing [9], for example, can save crucial time. Furthermore, cyber-physically organized swarm of the biobots can improve operational efficiency through covering a larger area at a reduced time, sharing the collected information with nearby agents to transmit it to a base station (Figure 3.1).
Our laboratory-based biobotic experiments usually run in the range of hours, spanning
over a week. In contrast, real world biobotic endeavors would require a more extended period of operation. Inactivity or gradual decrease in biobotic response to neurostimulation, as we observed in some experiments, may lead to undesirable consequences. Effective operational performance would call for a reliable and robust biobotic system. Stimulation in biobots indeed derives its use from a huge application base involving neural stimulation in clinical applications where such deterioration over time has been a major issue. With the advent of micromachined microelectrodes and microelectrode arrays, a more reliable door has opened towards neural stimulation and recording in peripheral and central nervous systems. While acute recording and stimulation experiments prove to be sound, reliability and stability become an issue for experiments running over a longer period of time [52], [53], much like the case with biobots. Reasons are often not clear, but can be cited as due to change in the tissue-electrode interface because of shifting of the position of the electrodes, fibrous encapsulation, biocompatibility issues, tissue reaction against implants and electrode corrosion [52], [53]. Such activities would also be the cause of failing of bioelectrical coupling between the insect tissue and electrodes, owing to the delicate nature of the tissue-electrode interface [20], [21].
process and long term stability of the implants. “Ideal” conditions would ascertain an interface with moderately low impedance facilitating an efficient charge transfer across the interface, and a voltage excursion induced by a stimulus maintaining a reversible thermodynamic equilibrium well within the water window.
dimensional constraints to satisfy charge injection and implantation requirements respectively for biobotic applications.
We also investigated the potential of the use of liquid metal-based electrodes in biobotic applications for the first time ever. Eutectic gallium-indium (EGaIn) is a novel low toxic liquid metal alloy [56], [57]. Despite having low viscosity, this liquid metal is stable enough because of a thin oxide layer on the surface [57], [58]. Owing to the liquid state of the metal, an EGaIn electrode can be easily made to have a different resistance value just by changing the dimensions of its contact area or diameter of the containing tube. It is also possible to adjust tissue-electrode impedance to desired values by changing the EGaIn amount or concentration and combining it with different materials, such as hydrogels. EGaIn has been demonstrated as a biocompatible electrode by successful targeted stimulation of neurons in microfluidic cell culture platforms [57].
Implanted electrodes need to sufficiently exhibit a consistent, reliable and stable performance during chronic stimulation and recording experiments, have low tissue-electrode impedance, facilitate good charge injection capacity, and be compact in size or shape. Towards the goal of finding such electrodes suitable for biobotic applications, we objectively analyzed four different types of electrodes in vitro with a saline based electrolyte medium. We also performed accelerated aging of the electrodes to help estimate their longitudinal performance. These in vitro test results can be used to provide a benchmark for future in vivo tests with implanted electrodes in roaches.
steel wire electrodes (SS), (ii) micro-fabricated gold electrodes with PEDOT:PSS electrochemical enhancement (AuP), (iii) eutectic gallium-indium alloy-based liquid metal electrodes (EGaIn), and (iv) a hybrid electrode with EGaIn coating on stainless steel wires - (SS-EGaIn). Section 3.3 describes the experimental methods for analyzing and characterizing the electrodes through a number of in vitro tests: (i) electrochemical impedance spectroscopy (EIS) with modeling of an interface equivalent electrode circuit, (ii) cyclic voltammetry (CV), and (iii) accelerated aging of the electrodes. Section 3.4 presents the obtained results and relevant discussion.
3.2 Biobotic Electrodes
3.2.1 SS Electrodes
Fig. 3.2. (a) Electrode setup with commercially available SS electrode: (inset) tip of SS and EGaIn coated SS electrodes. (b) EGaIn in Tygon tubing for use as an electrode (metal wire at one end for connection to external circuit).
0.5
m
m
2 mm
0.12
7
m
m
(a)
(b)
SS SSEGaIn
3.2.2 Microfabricated AuP Electrodes
We designed microfabricated gold electrodes (Figure 3.3) to have three strands, much like a complete stainless steel electrode. The center strand is the common electrode while the outer two are working electrodes for antennal implantation. The electrode pad on the center strand measures 127 μm × 1270 μm. Each of the antennal strands have multiple, independent
Fig. 3.3. (a) Cross-sectional illustration (top) and SEM image (bottom) of microfabricated gold electrode. (b) Microfabricated electrode with gold (left) and electropolymerized (right) tips shown.
insulation
exposed
gold pad
substrate
(c)
(a)
Legend Material Thickness
Polyimide 7500 nm
Gold 200 nm
Titanium 20 nm (adhesion layer)
pads (two to four, depending on mask design) each measuring 51 µm × 737 µm and separated by 1270 µm from each other along the length of the strand. Gold traces interconnect these exposed electrode pads to the larger connector pads at the other end of the flexible electrode. These pads were designed to match FFC connectors to connect to external circuits.
The microfabricated electrodes were fabricated on silicon carrier wafers. A sacrificial metal layer (Cr/Cu/Cr) was first deposited on the silicon wafer. Subsequently, a 7.5 μm layer of non-photodefinable polyimide was spin-coated onto the silicon substrate and cured. Metal deposition was used to deposit a 15 nm titanium adhesion layer followed by a 150 nm gold layer using a DC Sputtering system. The metal was patterned using wet etching techniques. A subsequent 7.5 μm thick insulating polyimide layer was deposited and cured on top. Both polyimide layers were deposited using spin coating, and cured in an oven at 325 °C for 1 hour. An aluminum hard mask was deposited using a Resistive Heated Evaporator system, and the electrodes were patterned using reactive ion etching (80% O2 and 20% CF4). The electrodes were then peeled from the silicon substrate for release. The sacrificial metal layer was etched using wet etching techniques to release the devices from the carrier wafer.
For electropolymerization of the electrodes, we found that a potentiostatic approach produced more consistent results than a galvanostatic one. A voltage was applied to maintain 100 μA/mm2 for 5 minutes. This duration was determined empirically and achieved optimal results. The electrodes for electrochemical polymerization were immersed in the PEDOT:PSS solution with a 254 μm × 76.20 mm platinum wire (A-M Systems) as the counter electrode. After the electropolymerization process, PEDOT:PSS coating on electrodes were checked for uniformity using an optical microscope. Figure 3.3 shows sample electropolymerized pads with characteristic black coloration of PEDOT:PSS coating. We found electropolymerization of PEDOT:PSS on stainless steel to be difficult and produced unconvincing results. Hence, this work used PEDOT:PSS with the microfabricated gold electrodes only.
3.2.3 EGaIn Electrodes
3.2.4 SS-EGaIn Electrodes
We have also tried using a hybrid EGaIn-stainless steel electrode (Figure 3. 2), which seemed to be more practical for roach implantations compared to the EGaIn-in-tube electrodes. In these electrodes, EGaIn formed an intermediary liquid-solid metal interface between the SS electrodes and surrounding electrolytic medium. For this, we delicately dipped the tip of SS electrodes in EGaIn 20 times in quick successions and ensured uniformity in terms of coating and thickness by optical microscopic analysis.
3.3 Experimental Methods
We used a benchtop potentiostat (Gamry Reference 600) to run electrochemical impedance spectroscopy (EIS) and cyclic voltammetry (CV) tests in a 0.9% saline solution at room temperature in a 30 ml closed-top (but not sealed) glass jar, . We used both three and two electrode electrochemical cells (Figure 3.3). We characterized tissue-electrode (or in this
Electrolytic medium R ef er en ce Ele ct ro d e W o rk in g Ele ct ro d e C o u n te r Ele ct ro d e Applied Current
V
Electrolytic medium R e fe re n ce E le ct ro d e W o rk in g E le ct ro d e Applied CurrentV
case, electrolyte-electrode) interfaces at the working electrode, with a 4.8 mm × 4.8 mm silver-silver chloride (Ag-AgCl) reference electrode and a 254 μm × 76.20 mm platinum wire (both electrodes from A-M Systems) as the counter electrode for 3 cell measurements. The measurements in a 3 cell minimized the effect of the electrolytic resistance and not affected by the redox reaction at the counter. In contrast, measurements in a 2 cell may be influenced by the electrolytic resistance between working and reference electrodes, but simplifies implantations requirements for an in vivo setup. We have analyzed and compared data from 2 cell with 3 cell to validate accuracy and justify use of one method over the other.
3.3.1 Electrochemical Impedance Spectroscopy
EIS expresses a Bode plot with magnitude and phase of measured impedance over the frequency range. A 10 mV AC voltage (typical EIS small-signal value) with zero bias voltage was used as the input signal for the EIS measurements. The interface impedance was measured between 100 Hz and 100 kHz at 10 discrete frequencies per decade.
3.3.1.1 Interface equivalent circuit model:
interface, and hence, properties of the electrode in question. Figure 3.5 shows an interface model.
We iteratively estimated values of the circuit parameters from the EIS using GAMRY Echem Analyst software. The estimated values can also be used to approximate the interface impedance, and vice versa, with equation (3.1) [61]:
dl ct ct s C R j R R Z 1 (3.1a)
22 2
1
1
1 ct dl
dl ct dl ct ct s C R C R j C R R R
Z
j
Z
Z
(3.1b)where= angular frequency, Z= real part of the impedance, Z= imaginary part of the impedance, which in turn can be used to calculate [61],
s s ct R Z R Z Z R 2 2
(3.1c)
Fig. 3.5. (a) Equivalent circuit model of an electrolyte-electrode interface. (b) Modified version of the model for SS-EGaIn electrodes.
Rct
Cdl
Rs
W.E. R.E. R
and
2 2
Z R Z Z C s dl (3.1d)
We have used this model for the SS, Au, AuP and EGaIn electrodes. We consider an additional RC parallel network for the intermediate layer between SS and EGaIn in the SS-EGaIn electrodes; Rint and Cint form the second network corresponding to Rct and Cdl respectively.
3.3.2 Cyclic Voltammetry
We performed a linear sweep at a scan rate of 500 mV/s between ± 600 mV, thereby keeping measurements between the water window. Each cycle in a CV curve denotes a redox reaction at the working electrode, indicated by the associated Faradaic current flows, and are represented as peaks in CV curves: cathodic peak current associated with reduction and anodic peak with oxidation. Peak current corresponds to number of charge carriers, peak potential when reaction occurs, and the area under the curve the charge injection capacity.
3.3.3 Accelerated Aging of Electrodes
In the scope of this study, we are interested in an average biobotic operation duration of two weeks post-insertion. After two weeks of working time, the insects are retired in an insect terrarium. We calculated experimental duration of about 26 h for a simulated real age of two weeks using equation (3.2) [63],
ref ET ET ref T T T
T Age n
Age (3.2) where ref T
Age = real time age at reference (or room) temperature Tref,
ET T
Age = accelerated
age at elevated temperature
T
ET, = temperature increment, and n = reaction rate = 2 for = 10°C [63], [64]. We analyzed the aging effects on the electrode material using electrochemical analysis, both EIS and CV, and microscopic imaging.3.4 Results and Discussion
The outliers in each sample of the collected data were eliminated by analyzing the interquartile range, resulting in a refined sample size (n = 20). Then, the mean ± standard error at each frequency point per electrode type were calculated, and graphically analyzed.
3.4.1 Electrochemical Impedance Spectroscopy Results
be used as a substitute for 3 cell measurements without compromising data accuracies. Therefore, lesser number of implantations could be more practically used for an in vivo setup with roach-bots, study of which is discussed in the next chapter.
While we ran most of our biobotic experiments with SS electrodes and obtained satisfactory results, we have found SS electrodes to produce a mediocre electrochemical performance. SS electrodes had impedances higher than most other materials we used, with Au electrodes closely matching these at lower frequencies. This is justified by both electrodes having similar Rct values, while a higher Cdl for Au manifests itself as relatively lower impedances at higher frequencies. The Au electrodes underwent significant improvements by the electropolymerization with PEDOT:PSS. This resulted in added charge carriers, and the effect is demonstrated by AuP electrodes having very low Rct and the highest Cdl values among the tested electrodes, thereby suggesting a potentially good charge transfer across an interface upon stimulation. This corresponds to decreased impedance and an
TABLE3.1
ELECTROLYTE-ELECTRODE INTERFACE CIRCUIT MODEL PARAMETERS
Electrode Rint (Ω.mm2) Cint (nF/mm2) Rct (kΩ.mm2) Cdl (nF/mm2) Rs (Ω.mm2)
SS - 2 cell - - 11.7±1.2 232.7±20.3 221.4±8.4
SS - 3 cell - - 10.6±1.3 253.9±27.7 138.6±10.3
Au - 2 cell - - 6.7±0.5 924.6±47.2 13.0±0.2
Au - 3 cell - - 7.5±0.3 824.7±21.7 11.7±0.0
AuP - 2 cell - - 3.4±0.2 51677.4±1265.1 39.5±0.3
AuP - 3 cell - - 3.2±0.2 55106.8±2141.4 37.5±0.3
EGaIn - 2 cell - - 0.7±0.1 4800.0±1991.9 100.3±17.1
EGaIn - 3 cell - - 0.7±0.2 3014.0±783.8 70.3±6.2
SS-EGaIn - 2 cell 437.8±175.6 448.77±88.03 6.4±1.0 550.5±72.7 247.3±51.9
SS-EGaIn - 3 cell 216.2±23.3 459.21±54.66 5.1±0. 7 998.5±221.4 259.8±69.0
improved phase angle. The second lowest impedances were observed from EGaIn electrodes, an electrode material evaluated for neural stimulation for the first time here, with lower Rct, but Cdl not as high as that of AuP electrodes. Addition of EGaIn to SS (SS-EGaIn) gave a compromise between the two electrodes and resulted in an optimized version of SS electrodes. While EGaIn demonstrated a more favorable performance compared to SS-EGaIn, tests on SS-EGaIn allowed us to recognize ways to modify properties of SS electrodes and assess the efficacy of this process. We used a second RC parallel network in the SS-EGaIn equivalent model to accommodate the additional interface layer between SS and EGaIn. Corresponding model parameters, Rint and Cint, exhibit more advantageous values to suggest an improved charge transfer across the electrolyte-electrode interface.
3.4.2 Cyclic Voltammetry Results
characteristic we observed with EGaIn-based electrodes was the lack of a conspicuous redox reaction. In addition, its maximum current was a few hundred times higher than the minimum current. We look further in the next chapter how these features would enable the use of EGaIn as neurostimulation electrodes.
3.4.3 Accelerated Aging Test Results
We performed accelerated aging tests with SS, AuP, EGaIn and SS-EGaIn electrodes, with a sample size of n = 4 per electrode type (Figure 3.8, Table 3.2). We noticed moderate changes in the impedance data of the electrodes, but noticed higher deviation and some
an optical microscope, we noticed some discoloration (possibly due to oxidation) and cracking in the EGaIn coating. These interesting features of the EGaIn, as well as SS-EGaIn, electrodes need further investigation through in vivo experiments to determine their suitability for biobotic stimulation. On the other hand, both SS and AuP electrodes did not have noticeable changes in appearance. Moreover, the charge capacity of AuP and SS electrodes stayed reasonably constant with regards to the standard error (Figure 3.9). The Cdl of SS also stayed fairly constant, while that of AuP changed, but remained considerably high.
TABLE3.2
INTERFACE CIRCUIT MODEL PARAMETERS AFTER ACCELERATED AGING OF ELECTRODES
Electrode Rint (Ω.mm2) Cint (nF/mm2) Rct (kΩ.mm2) Cdl (nF/mm2) Rs (Ω.mm2)
SS, t = 0 - - 11.7±1.2 232.7±20.3 221.4±8.4
t = 1 week - - 5.3±0.5 179.3±24.6 149.5±17.2
t = 2 weeks - - 3.5±0.2 199.0±15.3 145.9±12.8
AuP, t = 0 - - 3.4±0.2 51677.4±1265.1 39.5±0.3
t = 1 week - - 0.2±0.1 44068.4±7064.1 17.6±1.2
t = 2 weeks - - 0.1±0.1 40579.2±5934.7 17.7±1.2
EGaIn, t = 0 - - 0.7±0.1 4800.0±1991.9 100.3±17.1
t = 1 week - - 0.4±0.1 1240.0±583.9 72.6±21.4
t = 2 weeks - - 0.2±0.0 839.1±481.5 68.7±17.2
SS-EGaIn, t = 0 437.8±175.6 448.8±88.0 6.4±1.0 550.5±72.7 247.3±51.9
t = 1 week 267.8±15.9 144.4±13.0 7.1±0.2 369.4±6.8 124.0±3.0
t = 2 weeks 812.7±18.7 91.8±2.6 10.5±0.3 180.5±11.2 167.2±10.7
3.5 Conclusion
Through electrochemical analysis of the electrode-electrolyte interface, we have assessed in vitro the suitability of various electrode types and materials for use as biobotic stimulation electrodes. From the EIS data, we have also reasoned how two and three electrode cell data can lead to similar results, thereby allowing electrode characterization in biobots using only two electrode cells. The accelerated aging of the tested electrodes lets us understand whether and how these might sustain or fail for biobotic stimulation without causing any adverse effects to itself or to the implanted medium. While we have observed most electrodes to retain some level of initial characteristics, EGaIn and SS-EGaIn had a declining performance. SS-EGaIn electrodes were superior to SS electrodes for about a week, but gradually became Fig. 3.9. Charge injection capacity of electrodes calculated from data obtained over a period of 2 weeks, with results at t = 0, 1 week, and 2 weeks shown.
1 10 100 1000
0 1 2
C
harg
e
C
apaci
ty
(µ
C
/m
m
2)
Number of weeks
SS AuP
similar to SS in two weeks’ time. However, SS-EGaIn electrodes may still be used as neurostimulation electrodes for experiments lasting less than a week.
CHAPTER 4 Tissue-Electrode Interface Characterization of Roach-bots Subject
to Selective Neurostimulation7
4.1 Introduction
The area of biobotics has seen rapid development in research on aerial and terrestrial insect biobots over the past few years [3]–[5], [8]–[11], [14]–[16]. Direction of locomotion in these insect biobots can be controlled through neural or muscular stimulation, applied using electrodes implanted in appropriate locations. As an alternative solution to larger centimeter-scale synthetic robots, these biobots could be potentially used in emergency search and rescue after natural disasters in areas (for example, under-rubble scenario) inaccessible to first responders using conventional means. Our research uses the Gromphadorhina portentosa Madagascar Hissing cockroaches as terrestrial search and rescue roach-bots.
Cockroach antennae have fine hair called sensilla which is responsible for tactile and olfactory functions necessary for food search, mating, social interaction, among others [65]. Although cockroaches, in general, use a combination of tactile, visual, olfactory stimulus for the purpose of navigation [49], [50], they primarily navigate using their antennae particularly during escape response and obstacle avoidance where the visual and other senses cannot respond as fast [49], [50], [66]. On encountering an obstacle or a predator, sensory information is conveyed from the flagellum to the nervous system [50], [67], [68]. The nervous system, responsible for much of the cockroach locomotion [66], [69], evokes turning
![Fig. 2.2. Process flow diagram of insect biobot system (adapted from [75]).](https://thumb-us.123doks.com/thumbv2/123dok_us/1762599.1226616/26.612.110.520.396.639/fig-process-flow-diagram-insect-biobot-adapted.webp)
![Fig. 2.3. Biobot completing an S-shaped path [6].](https://thumb-us.123doks.com/thumbv2/123dok_us/1762599.1226616/28.612.94.426.351.649/fig-biobot-completing-s-shaped-path.webp)
![Fig. 2.6. Paths taken by insects in ten automated trials [7].](https://thumb-us.123doks.com/thumbv2/123dok_us/1762599.1226616/32.612.91.459.341.616/fig-paths-taken-insects-automated-trials.webp)
![Fig. 2.8. Maze Arena with overlay of path taken by a biobot on designated path [8].](https://thumb-us.123doks.com/thumbv2/123dok_us/1762599.1226616/34.612.214.416.410.618/fig-maze-arena-overlay-path-taken-biobot-designated.webp)
![Fig. 2.12. Polar directivity plot for each microphone [9].](https://thumb-us.123doks.com/thumbv2/123dok_us/1762599.1226616/38.612.99.439.419.643/fig-polar-directivity-plot-microphone.webp)