San Francisco,
TOWARDS SIMPLIFIED METHODS OF ANALYSIS OF IMPACT ON
CONCRETE STRUCTURES
Heather Trommels
1
MASc. Student, Dept. of Civil Engineering, University of Toronto, Toronto, ON
2
Professor, Dept. of Civil Engineering, University of Toronto, Toronto, ON ([email protected])
ABSTRACT
The tools that are mainly used today for the analysis of structures subjected to blast and impact loads tend to be overly simplistic (SDOF systems)
Nonlinear finite element analysis (NLFEA) procedures based on a smeared crack macro
approach can provide a good foundation on which to develop a tool to occupy the middle ground. As part of the IRIS_2012 study, the continuation of IRIS_2010 (NEA/CSNI, 2011), two impacts on reinforced concrete targets were modeled using NLFEA programs VecTor2 and VecTor3. With minimal required input material properties, and using program default material models and
results were achieved for both soft and hard missile impacts.
INTRODUCTION
A research program Improving Robustness Assessment Methodologies for Structures Impacted by Missiles, (IRIS) was put in place by the Committee on the Safety of Nuclear Installations, a subcommittee of the Nuclear Energy Agency in collaboration with the Institut de radioprotection et de sûreté nucléaire (IRSN, France) and the Canadian Nuclear Safety Commission (CNSC). The first phase of the program, presented at the workshop IRIS_2010 (NEA/CSNI, 2011) was organize
with an intent to validate simulation techniques used in the assessment of structures impacted by missiles. One soft and one hard missile impact were analyzed as part of a blind prediction exercise and, for both specimens, there was a great deal of scatter in the analytical results. The goal of the second phase, organized by the CNSC and presented at the workshop IRIS_2012, was to reduce the scatter in the analytical results and to examine simplified analysis tools for impact modelling. T
University of Toronto, using the VecTor programs, represent a simplified approach.
Two simply supported slabs subjected to impact loads were modeled using VecTor2 and VecTor3. For each specimen a quarter of the slab was modeled. Only one concrete material
concrete uniaxial compressive strength, was specified; all other concrete material parameters, such as the tensile strength and elastic modulus, were calculated from the compressive strength through commonly used relationships. Default material behaviour models and analysis param
flexural specimen, VTT-B1 (Vepsä, 2010
The punching specimen presented more of a challenge; however, the punching behaviour captured early on in the simulation. Large displacements were observed in the impact region, with the rest of the specimen experiencing relatively small displacements. Crack patterns also illustrate punching cone, which was not present in the flex
METHODOLOGY
VecTor2 is a two-dimensional finite element program for the analysis of reinforced concrete membrane structures under static and dynamic loading, formulated initially based on the Modified Compression Field Theory (MCFT) and la
(DSFM).
Transactions, SMiRT-22
San Francisco, California, USA - August 18-23, 2013 Division III
TOWARDS SIMPLIFIED METHODS OF ANALYSIS OF IMPACT ON
CONCRETE STRUCTURES
Heather Trommels1, Frank J. Vecchio2
MASc. Student, Dept. of Civil Engineering, University of Toronto, Toronto, ON
Professor, Dept. of Civil Engineering, University of Toronto, Toronto, ON ([email protected])
The tools that are mainly used today for the analysis of structures subjected to blast and impact loads tend to be overly simplistic (SDOF systems) or highly complex (hydrocodes such as LS
lysis (NLFEA) procedures based on a smeared crack macro
approach can provide a good foundation on which to develop a tool to occupy the middle ground. As part S_2012 study, the continuation of IRIS_2010 (NEA/CSNI, 2011), two impacts on reinforced concrete targets were modeled using NLFEA programs VecTor2 and VecTor3. With minimal required input material properties, and using program default material models and analysis parameters, good results were achieved for both soft and hard missile impacts.
A research program Improving Robustness Assessment Methodologies for Structures Impacted by Missiles, (IRIS) was put in place by the Committee on the Safety of Nuclear Installations, a r Energy Agency in collaboration with the Institut de radioprotection et de sûreté nucléaire (IRSN, France) and the Canadian Nuclear Safety Commission (CNSC). The first phase of the program, presented at the workshop IRIS_2010 (NEA/CSNI, 2011) was organized by IRSN, France, with an intent to validate simulation techniques used in the assessment of structures impacted by missiles. One soft and one hard missile impact were analyzed as part of a blind prediction exercise and, for both eat deal of scatter in the analytical results. The goal of the second phase, organized by the CNSC and presented at the workshop IRIS_2012, was to reduce the scatter in the analytical results and to examine simplified analysis tools for impact modelling. The analyses done at the University of Toronto, using the VecTor programs, represent a simplified approach.
Two simply supported slabs subjected to impact loads were modeled using VecTor2 and VecTor3. For each specimen a quarter of the slab was modeled. Only one concrete material
concrete uniaxial compressive strength, was specified; all other concrete material parameters, such as the tensile strength and elastic modulus, were calculated from the compressive strength through commonly ial behaviour models and analysis parameters were also used. For the
, 2010a), good results were obtained with a relatively coarse mesh. The punching specimen presented more of a challenge; however, the punching behaviour captured early on in the simulation. Large displacements were observed in the impact region, with the rest of the specimen experiencing relatively small displacements. Crack patterns also illustrate punching cone, which was not present in the flexural specimen.
dimensional finite element program for the analysis of reinforced concrete membrane structures under static and dynamic loading, formulated initially based on the Modified Compression Field Theory (MCFT) and later updated to include the Disturbed Stress Field Model
TOWARDS SIMPLIFIED METHODS OF ANALYSIS OF IMPACT ON
Professor, Dept. of Civil Engineering, University of Toronto, Toronto, ON ([email protected])
The tools that are mainly used today for the analysis of structures subjected to blast and impact or highly complex (hydrocodes such as LS-DYNA). lysis (NLFEA) procedures based on a smeared crack macro-modeling approach can provide a good foundation on which to develop a tool to occupy the middle ground. As part S_2012 study, the continuation of IRIS_2010 (NEA/CSNI, 2011), two impacts on reinforced concrete targets were modeled using NLFEA programs VecTor2 and VecTor3. With minimal required analysis parameters, good
A research program Improving Robustness Assessment Methodologies for Structures Impacted by Missiles, (IRIS) was put in place by the Committee on the Safety of Nuclear Installations, a r Energy Agency in collaboration with the Institut de radioprotection et de sûreté nucléaire (IRSN, France) and the Canadian Nuclear Safety Commission (CNSC). The first phase of d by IRSN, France, with an intent to validate simulation techniques used in the assessment of structures impacted by missiles. One soft and one hard missile impact were analyzed as part of a blind prediction exercise and, for both eat deal of scatter in the analytical results. The goal of the second phase, organized by the CNSC and presented at the workshop IRIS_2012, was to reduce the scatter in the he analyses done at the
Two simply supported slabs subjected to impact loads were modeled using VecTor2 and VecTor3. For each specimen a quarter of the slab was modeled. Only one concrete material property, the concrete uniaxial compressive strength, was specified; all other concrete material parameters, such as the tensile strength and elastic modulus, were calculated from the compressive strength through commonly ters were also used. For the ), good results were obtained with a relatively coarse mesh. The punching specimen presented more of a challenge; however, the punching behaviour was captured early on in the simulation. Large displacements were observed in the impact region, with the rest of the specimen experiencing relatively small displacements. Crack patterns also illustrated a
Based on the results of panel tests conducted at the University of Toronto, the MCFT is an analytical model for simulating the load
to in-plane shear and normal stresses. The MCFT treats cracked concrete as a smeared through the element. Equilibrium, compatibility, and stress
terms of average stresses and average str
an important feature of the MCFT is the consideration of local stress and strain conditions at crack locations. Details of the MCFT can be found in Vecchio and Collins (1986).
The DSFM was developed to address
under certain loading conditions. For lightly reinforced elements, it was found that the rotation of the principal stress field lagged the principal strain field and that th
those elements. Conversely, for elements with limited rotation of the stress and strain fields, it has been found that the MCFT underestimates shear strength and stiffness. The DSFM is essentially an extension of MCFT, which addresses the aforementioned deficiencies of that model. The main development introduced in the DSFM is the decoupling of the orientations of the principal strain and principal stress fields. The DSFM also augments the compatibility relationship
deformations, eliminating the crack shear check. A detailed description of the DSFM can be found in Vecchio (2000).
VecTor2 was developed for static loading conditions, with additional subroutines added by Saatci (2007) to allow dynamic loading conditions to be considered. For dynamic analyses, Rayleigh Damping and a dynamic analysis algorithm based on Newmark’s Method of Direct Integration are used.
VecTor3 is a three-dimensional version of VecTor2, applicable to t
concrete solids. Selby (1993) extended the plane stress formulations of the MCFT to three dimensions. Analyses were carried out for a series of reinforced concrete beams under flexure
verification study, and good results were achieved.
FLEXURAL SPECIMEN
The test modeled in this section was carried out by 2010, and was part of a test series which consisted of
(Vepsä, 2010a&b). For the two flexural tests in this series, B1 and B2, hollow deformable stainless steel missiles were impacted against 2082 x 2082 x 150 mm reinforced concrete panels. The panels were simply supported on four sides, with a distance of 2000 mm between th
nominal concrete strength of 50 MPa.
Reinforcement consisted of 6 mm diameter bars at a spacing of 55 mm, with shear reinforcement provided in the form of 6 mm diameter stirrups. For the B1 and B2 tests, which were meant to be identical, the design missile mass and impact velocity were 50 kg 110 m/s, respectively.
The VTT-B1 flexural specimen was modeled using both VecTor2 and VecTor3. Default material behaviour models were used in most cases (the exception being the use of the Hoshikuma concrete stress-strain curve), in keeping with
modeling procedures. In addition, only the concrete compressive strength (f’c) was taken from the experimental material properties.
All other properties were derived from f’
No attempt was made to refine the analyses by adjusting the material models or material properties.
First, the missile was explicitly modeled in VecTor2 using a combination of steel elements and compression
Compression-only truss bars were used due to the fact that the VecTor suite of programs do not yet support contact elements. The
Based on the results of panel tests conducted at the University of Toronto, the MCFT is an the load-deformation response of reinforced concrete elements subje plane shear and normal stresses. The MCFT treats cracked concrete as a unique material with cracks
through the element. Equilibrium, compatibility, and stress-strain equations are formulated in terms of average stresses and average strains. While cracks are distributed through the concrete element, an important feature of the MCFT is the consideration of local stress and strain conditions at crack locations. Details of the MCFT can be found in Vecchio and Collins (1986).
developed to address minor deficiencies of the MCFT that have been found to exist under certain loading conditions. For lightly reinforced elements, it was found that the rotation of the principal stress field lagged the principal strain field and that the MCFT overestimates the stiffness of those elements. Conversely, for elements with limited rotation of the stress and strain fields, it has been found that the MCFT underestimates shear strength and stiffness. The DSFM is essentially an extension T, which addresses the aforementioned deficiencies of that model. The main development introduced in the DSFM is the decoupling of the orientations of the principal strain and principal stress fields. The DSFM also augments the compatibility relationships of MCFT to include crack shear slip deformations, eliminating the crack shear check. A detailed description of the DSFM can be found in
VecTor2 was developed for static loading conditions, with additional subroutines added by Saatci 7) to allow dynamic loading conditions to be considered. For dynamic analyses, Rayleigh Damping and a dynamic analysis algorithm based on Newmark’s Method of Direct Integration are used.
dimensional version of VecTor2, applicable to the modeling of reinforced Selby (1993) extended the plane stress formulations of the MCFT to three dimensions. Analyses were carried out for a series of reinforced concrete beams under flexure
good results were achieved.
The test modeled in this section was carried out by VTT, designed by VTT and
2010, and was part of a test series which consisted of five impact tests on reinforced concrete targets For the two flexural tests in this series, B1 and B2, hollow deformable stainless steel missiles were impacted against 2082 x 2082 x 150 mm reinforced concrete panels. The panels were simply supported on four sides, with a distance of 2000 mm between the supports in both directions and a nominal concrete strength of 50 MPa.
Reinforcement consisted of 6 mm diameter bars at a spacing of 55 mm, with shear reinforcement provided in the form of 6 mm diameter stirrups. For the B1 and B2 tests, which were meant to be identical, the design missile mass and impact velocity were 50 kg and B1 flexural specimen was modeled using both VecTor2 and VecTor3. Default material behaviour models were used in most cases (the exception being the use of the Hoshikuma concrete strain curve), in keeping with the goal of employing simplified modeling procedures. In addition, only the concrete compressive was taken from the experimental material properties. All other properties were derived from f’c using known equations.
No attempt was made to refine the analyses by adjusting the material
First, the missile was explicitly modeled in VecTor2 using a combination of steel elements and compression-only truss bars.
only truss bars were used due to the fact that the VecTor suite of programs do not yet support contact elements. The
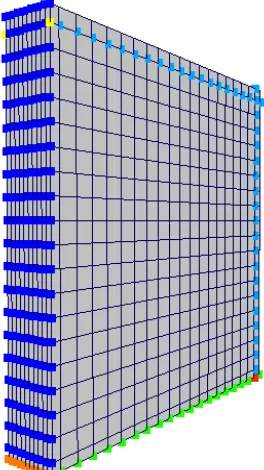
Figure 1: VecTor3 VTT
Based on the results of panel tests conducted at the University of Toronto, the MCFT is an deformation response of reinforced concrete elements subjected material with cracks strain equations are formulated in ains. While cracks are distributed through the concrete element, an important feature of the MCFT is the consideration of local stress and strain conditions at crack
deficiencies of the MCFT that have been found to exist under certain loading conditions. For lightly reinforced elements, it was found that the rotation of the e MCFT overestimates the stiffness of those elements. Conversely, for elements with limited rotation of the stress and strain fields, it has been found that the MCFT underestimates shear strength and stiffness. The DSFM is essentially an extension T, which addresses the aforementioned deficiencies of that model. The main development introduced in the DSFM is the decoupling of the orientations of the principal strain and principal stress s of MCFT to include crack shear slip deformations, eliminating the crack shear check. A detailed description of the DSFM can be found in
VecTor2 was developed for static loading conditions, with additional subroutines added by Saatci 7) to allow dynamic loading conditions to be considered. For dynamic analyses, Rayleigh Damping and a dynamic analysis algorithm based on Newmark’s Method of Direct Integration are used.
he modeling of reinforced Selby (1993) extended the plane stress formulations of the MCFT to three dimensions. Analyses were carried out for a series of reinforced concrete beams under flexure and torsion as a
and IRSN, in early impact tests on reinforced concrete targets For the two flexural tests in this series, B1 and B2, hollow deformable stainless steel missiles were impacted against 2082 x 2082 x 150 mm reinforced concrete panels. The panels were e supports in both directions and a
22nd Conference on Structural Mechanics in Reactor Technology San Francisco, California, USA - August 18-23, 2013 Division III force histories determined in the compression-only truss bars were then used in the VecTor3 modeling of the specimen.
The concrete target alone was modeled in VecTor3 and the load profile defined in the VecTor2 analyses by modeling the missile explicitly was adapted for the VecTor3 analyses. A total of 4851 nodes, 4000 8-node rectangular concrete elements, and 1520 2-node truss bar elements were used in the modeling of the flexural specimen. The in-plane reinforcement was modeled using truss bar elements, while the transverse reinforcement was modeled as smeared through the concrete elements. The VecTor programs, particularly VecTor2 and VecTor3, have the ability to model distributed reinforcement as a smeared reinforcement ratio instead of modeling the bars explicitly. The concrete cover to the in-plane reinforcement on the front and back was 15 mm. The damping ratios for the first and second modes were 0.25% and 1%, respectively. For the supports, only the degree of freedom in the direction of impact was restrained. Double symmetry was assumed, and those planes of symmetry were restrained in the appropriate directions. The mesh is shown in
Figure 1
. Material properties are summarized inTable 1
.Table 2
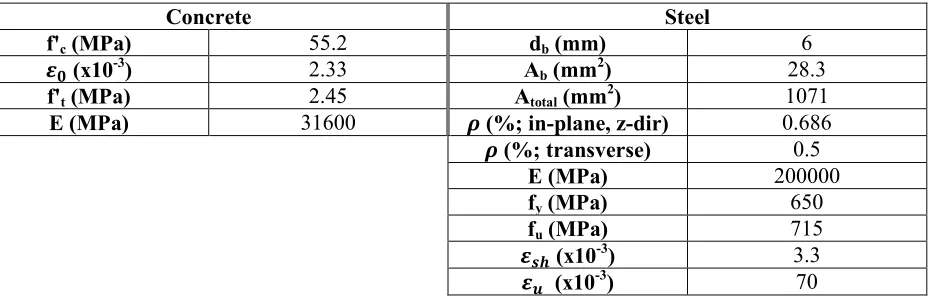
summarizes the VecTor3 displacement results.Table 1: Flexural Specimen Concrete and Steel Material Properties
Concrete Steel
f'c (MPa) 55.2 db (mm) 6
ࢿ (x10-3) 2.33 Ab (mm
2
) 28.3
f't (MPa) 2.45 Atotal (mm
2
) 1071
E (MPa) 31600 ࣋ (%; in-plane, z-dir) 0.686
࣋ (%; transverse) 0.5
E (MPa) 200000
fy (MPa) 650
fu (MPa) 715
ࢿ࢙ࢎ (x10-3) 3.3 ࢿ࢛ (x10-3) 70
Table 2: Flexural Specimen VecTor3 Displacement Results
Sensors (back face) Peak Displacements
Name x (mm)
y
(mm) Experimental
VecTor3 (base)
% Error
VecTor3 (Strain
Rate)
% Error
VecTor3 (Riera Load;
No SR)
% Error
W1 0 0 28.89 32.83 13.64 27.06 -6.32 27.18 -5.92
W2 250 250 20.38 22.80 11.90 19.01 -6.74 18.86 -7.46
W3 250 0 21.96 26.13 19.01 21.81 -0.68 21.62 -1.55
W4 385 385 15.27 17.26 13.03 14.44 -5.43 14.23 -6.81
W5 385 0 19.53 21.94 12.32 18.35 -6.04 18.10 -7.32
-15
-10
-5
0
5
10
15
20
25
30
35
0
20
40
60
80
100
Di
sp
la
ce
m
e
n
t
a
t
C
e
n
tr
e
o
f
Ta
rg
e
t
(m
m
)
Time (ms)
Displacement Results for Centre of
Flexural Specimen
Experimental
VecTor3 (w/o Strain Rate Effects)
VecTor3 (with Strain Rate Effects)VecTor3 (Riera Load; w/o SRE)
0
50
100
150
200
0
5
10
15
20
F
o
rc
e
(
kN
)
Time (ms)
Comparison of Impact Forces
Load from VT2 Truss
Forces
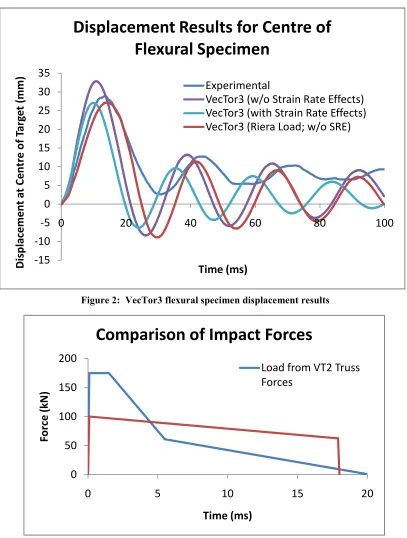
Figure 3
compares the load obtained from VecTor2 to the load predicted using the Riera method (Borgerhoff, Stangenberg, and Zinn, 2011).Figure 2
also shows the displacement-time response obtained in VecTor3 when the Riera load was used. In this analysis, the peak midspan displacement was slightly underestimated. The peak displacement predicted by VecTor3 was 27.2 mm, compared to the experimental peak of 28.9 mm. However, if a finer mesh was used, the displacement predicted by VecTor3 would likely be closer to the experimental result. Comparing the period predicted by VecTor3 and the period observed experimentally, using the Riera load, the period is more accurately predicted.Figure 2: VecTor3 flexural specimen displacement results
22nd Conference on Structural Mechanics in Reactor Technology San Francisco, California, USA - August 18-23, 2013 Division III In the experiment, the concrete cover was 15 mm with the reinforcement provided in two mats, one in each principal direction. Due to constraints in the model, the reinforcement in VecTor3 analyses was specified all at the same depth, and this may have resulted in a slight underestimation of displacements. Because of this, and to examine the effect of reinforcement depth on peak displacements, an analysis was performed using the same mesh and material properties, with the only difference being that the depth to all reinforcement was 30 mm from each face. Results indicated that while the depth to reinforcement does influence the results slightly, the error introduced by having both layers of reinforcement at the same depth is small. The maximum difference between peak displacements, with a difference in reinforcement depth of 15 mm was only 1.55 mm, occurring at the centre of the slab.
The effect of mesh density was also examined with respect to analyses done using VecTor3. For the base analyses, there were 10 elements through the thickness of the slab. In keeping with the goal of carrying out a simplified analysis, a simulation was also done using a very coarse mesh, with only four elements through the depth of the slab. For this analysis the depth to reinforcement was 30 mm, and strain rate effects were not considered. The peak displacement at W1, the centre of the slab, was 28.6 mm, compared to 34.4 mm obtained by VecTor3 using a finer mesh. This result is consistent with the observation that a finer mesh is typically less stiff and yields larger displacements.
The effect of mesh density was further examined in VecTor2, where analyses were done using three meshes. The coarsest mesh has the same mesh density as the VecTor3 model. For the fine mesh, the average element size was 10x12 mm, and there were a total of 15 elements through the thickness of the slab. The coarse mesh had an average element size of 15x54 mm. The aspect ratio for the coarse mesh is much larger than optimal, and was used due to computation and modeling constraints. The coarse mesh had a total of 10 elements through the thickness. A third analysis in VecTor2 was performed to determine the effect of element aspect ratio only, since between the coarse and fine mesh, both the element aspect ratios and number of elements through the thickness are quite different. In these analyses the concrete cover used was 30 mm. The peak displacement for the fine mesh was 45.1 mm. When the element aspect ratio was kept to approximately 1, and the number of elements through the thickness was reduced from 15 to 10, the peak displacement decreased to 44.1 mm. Finally, the peak displacement for the coarse mesh was 42.2 mm. Based on these three VecTor2 analyses, it can be observed that while the number of elements through the thickness of the slab has some effect, going from 15 to 10 elements did not have a large effect on the peak displacement. Going from a square element, with an aspect ratio of 1, to an element with an aspect ratio of 3.6 has a larger effect on the peak displacement, decreasing it by approximately 2 mm.
Compared in
Figure 4
are the VecTor3 and experimental reinforcement strains for the reinforcement located at the back of the slab, 27.5 mm (horizontally) away from the centre of the slab. In terms of peak strain, the strain predicted by VecTor3 matches the experimentally measured strain fairly well. Comparing the post-peak responses, the periods are similar, though the period predicted by VecTor3 is slightly shorter. Also, the experimental strain damps out faster than predicted by VecTor3. The most noticeable difference, though, is the difference between the measured residual strain and the residual strain predicted by VecTor3. VecTor3 predicts negligible residual strain, while the experimental residual strain was approximately 2 x 10⁻³.-0.01
-0.005
0
0.005
0.01
0.015
0.02
0.025
0.03
0.035
0.04
0.045
0
50
100
150
200
S
tr
a
in
Time (ms)
D4
Experimental
VecTor3-average
VecTor3-crack
-1000
-800
-600
-400
-200
0
200
400
600
0
50
100
150
200
F
o
rc
e
(
kN
)
Time (ms)
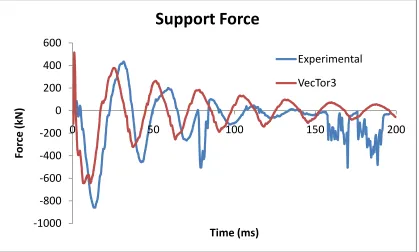
Support Force
Experimental
VecTor3 Figure 4: Comparison of reinforcement strains at midspan of VTT-B1
22nd Conference on Structural Mechanics in Reactor Technology San Francisco, California, USA - August 18-23, 2013 Division III PUNCHING SPECIMEN
The VTT-P1 punching test was commissioned by the Canadian Nuclear Safety Commission (CNSC) and carried out at VTT (Vepsä, 2010b). The goal of this test was to obtain perforation of a concrete wall by a non-deformable missile. The wall dimensions were 2100 x 2100 x 250 mm, and the target values for the missile mass and impact velocity were 135 m/s and 47 kg. The concrete strength was 60 MPa, and the reinforcement in the in-plane directions consisted of 10 mm diameter bars spaced at 90 mm. No shear reinforcement was provided.
Table 3
summarizes the material properties used.Analysis results discussed here were obtained using VecTor3. Default material behaviour models and analysis parameters were used in most cases. The exception was the concrete stress-strain curve, for which the Hoshikuma (1997) model was used.
The hard missile was modeled using three layers of steel elements, and for simplicity a square missile was used. One quarter of the missile mass was used, since a quarter of the panel was modeled, and an initial velocity of 135 m/s was assigned to each missile node. Short compression-only truss bars were used to connect the missile to the slab.
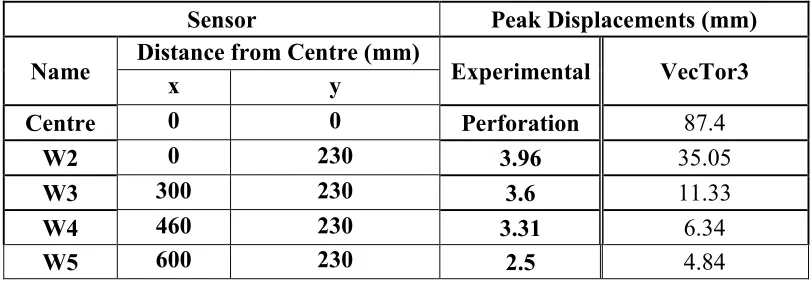
Table 4
compares the VecTor3 and experimental results, and the deformed mesh is shown inFigure 6
.Table 3: Punching Specimen Concrete and Steel Material Properties
Concrete Properties Steel Properties
f'c (MPa) 60 db (mm) 10
ࢿ (x10-3) 2.24 Ab (mm
2
) 78.5
f't (MPa) 2.56 Atotal (mm2) 1884
E (MPa) 32610 ࣋ (%; out of plane) 0.718
E (MPa) 200000
fy (MPa) 540
fu (MPa) 605
ࢿ࢙ࢎ (x10-3) 30 ࢿ࢛ (x10-3) 114
Table 4: Punching Specimen VecTor3 Displacement Results
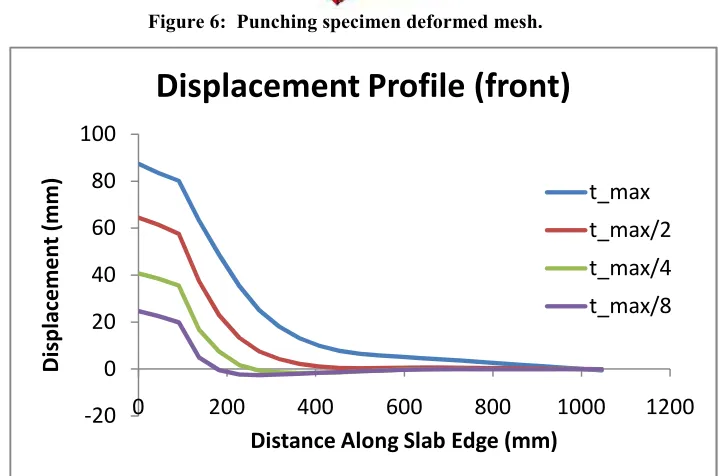
The displacement profile for the front of the slab is shown in
Figure 7
. The displacement profile shows a distinct punching zone, which widens to approximately 600 mm (1.2 m zone of punching for the entire slab) towards the end of the analysis. Inside of the punching zone, displacements attain values up to 87 mm, while outside of the punching zone, displacements are less than 10 to 20 mm.Sensor
Peak Displacements (mm)
Name
Distance from Centre (mm)
Experimental
VecTor3
x
y
Centre
0
0
Perforation
87.4
W2
0
230
3.96
35.05
W3
300
230
3.6
11.33
W4
460
230
3.31
6.34
-20
0
20
40
60
80
100
0
200
400
600
800
1000
1200
Di
sp
la
ce
m
e
n
t
(m
m
)
Distance Along Slab Edge (mm)
Displacement Profile (front)
t_max
t_max/2
t_max/4
t_max/8
The maximum displacement was 87.4 mm at 3.09 ms. At 3.09 ms, one of the longitudinal truss bars at the back of the slab, within the punching region and close to the point of impact, ruptured. After the first truss bar ruptured, a number of other truss bars ruptured and the analysis became unstable. The two limitations that exist in the VecTor programs with respect to hard missile impacts are the lack of element erosion and the loss of convergence once one of the reinforcement ruptures. Part of the future work is to improve post-rupture convergence. The analysis was considered stable up to the point of reinforcement rupture. At the time of rupture, the instantaneous velocity of the front of the slab was 15.29 m/s and the velocity of the back of the missile was 9.83 m/s. The initial velocity was 135 m/s.
The displacement profiles and the deformed mesh exhibit punching behaviour, which is the same type of behaviour that was observed experimentally. As has been mentioned previously, perforation occurred in the actual test. Although VecTor3 cannot explicitly model perforation, the punching behaviour observed in this analysis, combined with the predicted rupture of reinforcing bars, may indicate that perforation is likely. In order to be able to model perforation, or to say that perforation is occurring, a limiting concrete strain should be specified. This has not yet been looked at in detail, and is part of the future work.
Figure 6: Punching specimen deformed mesh.
22nd Conference on Structural Mechanics in Reactor Technology San Francisco, California, USA - August 18-23, 2013 Division III CONCLUSIONS
The VecTor2 and VecTor3 modeling of the VTT-B1 specimen led to a number of conclusions. Firstly, it can be concluded that modeling a flexural specimen response using only the concrete compressive strength can yield good results; an excessive number of input properties are not required to carry out a quality simulation. For the VTT-B1 specimen, only the concrete compressive strength reported experimentally was used in the analyses, and the other material properties were determined using common equations. In terms of significant sources of error, the largest is the missile modeling. Modeling the soft missile was a challenge. Firstly, VecTor2 does not have a rigorous hollow missile buckling model. A rebar buckling formulation was applied to the steel elements in the missile, and missile crushing was approximated. Secondly, VecTor2 does not yet have contact elements, and the impact load was transferred from the missile to the slab using compression-only truss bars.
Additional analyses, performed using the Riera impact load, indicated that the load profile obtained from the VecTor2 analyses was weighted too heavily to the start of the impact. Compared to the Riera load, the VecTor2 load profile had a peak which was much higher and decayed more quickly. Reinforcement locations and the desired number of elements through the depth of the slab resulted in an element aspect ratio that was higher than optimal. For this reason, the effects of mesh density and element aspect ratio were examined to determine whether or not they were a large source of error, and it was concluded that while the mesh density did have an effect on the target response (a finer mesh will tend to lead to larger displacements), this effect was not large. Another source of error may be the way the supports were modeled; no effort was made to model the supports in detail.
Despite these challenges, good results were achieved for VTT-B1 in terms of peak displacements, strains in the reinforcement, and support reactions. The peak displacements estimated by VecTor3 were generally within 13% of the experimental displacements at five sensor locations. Results suggest that for flexural specimens the VecTor programs are able to capture the target response adequately. With respect to the missile modeling, it is not the intent of the VecTor programs to be able to model hollow missile buckling in detail. As a “simplified” analysis, it may be best to limit the modeling to the target alone. Further, if a simplified impact force profile can be easily obtained using the Riera method, it is best to use that load when carrying out a simplified analysis.
Modeling the punching specimens presented the same challenges as VTT-B1 in terms of limitations on mesh density and the use of compression-only truss bars instead of contact elements. The punching specimens also presented the additional challenge of local damage. Experimentally, VTT-P1 was perforated, with a residual missile velocity of approximately 34 m/s. VecTor3 does not yet have local damage or element erosion capabilities, and so perforation could not be modeled. Despite this, VecTor3 was able to model punching behaviour. At the time the analysis went unstable, due to rupture of reinforcement, the missile velocity was calculated as 10 m/s. For VTT-P1, the displacement profiles for the front and back of the slab were examined for different times in the analysis. These profiles, as well as the deformed mesh, clearly illustrated punching behaviour.
REFERENCES
LS-DYNA, Livermore Software Technology Corp., Livermore, CA, USA.
Borgerhoff, M., Stangenberg, F., and Zinn, R. (2011) “Numerical simulation of impact tests of reinforced concrete slabs with predominant flexural deformation behavior” Transactions of SMiRT 21, New Delhi, India.
Hoshikuma, J., Kawashima, K., Nagaya, K. and Taylor, A.W. (1997). “Stress-Strain Model for Confined Reinforced Concrete in Bridge Piers”. ASCE Journal of Structural Engineering. 123(5): 624-633
Riera, J.D. (1968). “On the stress analysis of structures subjected to aircraft impact forces”.
Nuclear Engineering and Design.; 8: 416-426
Saatci, S. (2007) “Behaviour and Modeling of Reinforced Concrete Structures Subjected to Impact Loads”. Thesis for Doctor of Philosophy. Department of Civil Engineering, University of Toronto. 316pp Selby, R.G. (1993) “Three-Dimensional Constitutive Relations for Reinforced Concrete.” Thesis for Doctor of Philosophy. Department of Civil Engineering. University of Toronto. 147 pp.
Vecchio, F.J. and Collins, M.P. (1986) ``The Modified Compression-Field Theory for Reinforced Concrete Elements Subjected to Shear``. Journal of the American Concrete Institute. 83(2):219-231
Vecchio, F.J. (2000) “Disturbed Stress Field Model for Reinforced Concrete: Formulation”. ASCE
Journal of Structural Engineering. 126(8):1070-1077
Vepsä, A. (2010a) “Experimental tests for bending and punching behavior of reinforced concrete walls under impact loading”. Research Report VTT-R-05587-10. 172pp.
Vepsä, A. (2010b) “Punching behavior of one 250 mm thick reinforced concrete wall under hard impact loading: Revision A”, Research Report VTT-05588-10. 71 pp.
ACKNOWLEDGEMENTS
This work is sponsored by the Canadian Nuclear Safety Commission (CNSC), through Contract 87055-11-0541, “R456.4: Development of Simplified Analytical tools for Impact and Impulsive Loading Analysis of Reinforced and Pre-Stressed and Steel-Plate-Concrete (SC) Concrete Slabs”. Their support is gratefully acknowledged.
NOTATION
݂ᇱ: concrete compressive strength ݂௧ᇱ: concrete tensile strength ߝ: concrete strain at peak stress ܧ: modulus of elasticity ݀: reinforcing bar diameter ܣ: reinforcing bar area
ܣ௧௧: total reinforcement area
ߩ: reinforcement ratio (smeared reinforcement) ݂௬: steel yield stress
݂௨: steel ultimate stress