TABLE OF CONTENTS:
Vol. 43, No. 1, January 1990
ARTICLES Animal Ecology
2 Effects of continuous grazing on habitat and density of ground-foraging birds in south Texas by Denise L. Baker and Fred S. Guthery
Soils
6 Distribution of nitrogen fractions in grazed and ungrazed fescue grassland Ah horizons by Johan F. Dormaar, Sylver Smoliak, and Walter D. Willms
10 Soil moisture patterns below mounds of harvester ants by John W. Laundrl
Plant Ecology 13
20
25
29
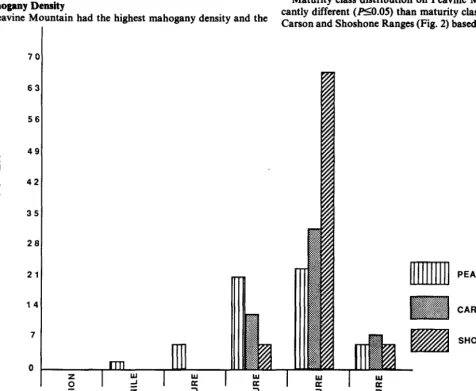
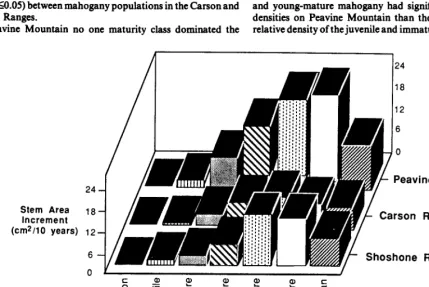
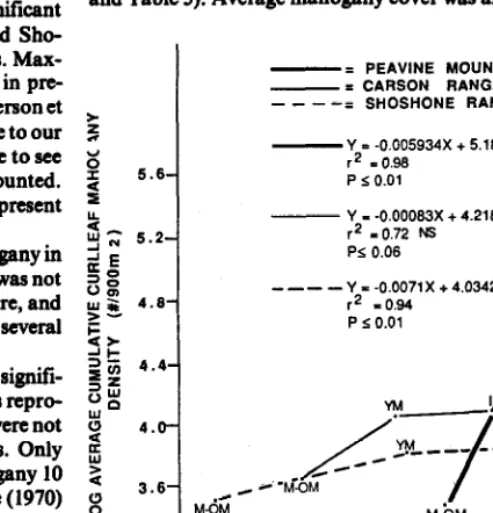
Ecology of curlleaf mahogany in western and central Nevada: community and population structure by B.W. Schultz, P.T. Tueller, and R.J. Tausch Seedbed ecology of winterfat: effects of mother-plant transpiration, wind stress, and nutrition on seedling vigor by D. Terrance Booth
Herbage production-forest overstory relationships in two Arizona ponde- rosa pine forests by Luis A. Bojorquez Tapia, Peter F. Ffolliott, and D. Phillip Guertin
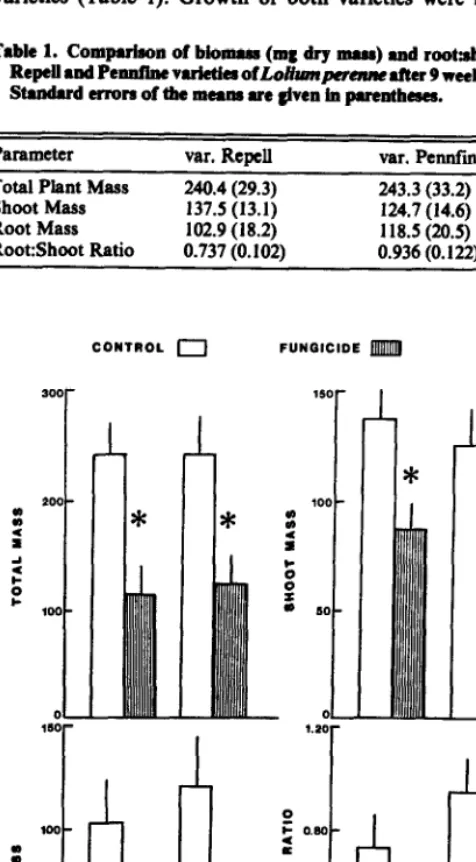
Responses of endophyte-bearing and endophyte-free varieties of
Lolium
perenne
L. to fungicide treatment and simulated herbivory by Ralph E.J.Boerner, Amy J. Scherzer, and Blake G. Sturgis
Range Improvement
33 Control of honey mesquite with herbicides: influence of plant height by P.W. Jacoby, C.H. Meadors, and R.J. Ansley
36 Control of honey mesquite with herbicides: influence of stem numberby P. W. Jacoby, R.J. Ansley, C.H. Meadors, and C.J. Cuomo
39 Effects of manual application method on application time, thoroughness, and tebuthiuron outlays by Nicholas S. Van Pelt and Neil E. West 43 Creosotebush control and forage production in the Chihuahuan and
Sonoran Deserts by Howard L. Morton, Fernando A. Ibarra-F, Martha H. Martin-R, and Jerry R. Cox
Plant Physiology
49 Nitrogen accumulation and acetylene reduction activity of native lupines on disturbed mountain sites in Colorado by S.T. Kenny and R.L. Cuany 52 Clipping and long-term grazing effects on biomass and carbohydrate
reserves of Indian ricegrass by Apollo B. Orodho and M.J. Trlica 58 Comparative photosynthetic responses of big bluestem to clipping versus
Published bimonthly-January, March, May, July, September, November Copyright 1990 by the Society for Range Management
INDIVIDUAL SUBSCRIPTION is by membership in the Society for Range Management.
LIBRARY or other INSTITUTIONAL SUBSCRIP-TIONS on a calendar year basis are $56.00 for the United States postpaid and $66.00 for other coun-tries, postpaid. Payment from outside the United States should be remitted in US dollars by interna-tional money order or draft on a New York bank. BUSINESSCORRESPONDENCE,concerningsub-scriptions. advertising, reprints, back issues, and related matters, should be addressed to the Manag-ing Editor, 1839 York Street, Denver, Colorado 80206.
EDITORIALCORRESPONDENCE. concerning manu-scriptsorothereditorial mattersshould beaddressed to the Editor, 1839 York Street, Denver, Colorado 80206.
INSTRUCTIONS FOR AUTHORS appear on the inside back cover of most issues. A Style Manual is also available from the Society for Range Manage-ment at the above address @$2.00 for single copies; $1.25 each for 2 or more.
THE JOURNAL OF RANGE MANAGEMENT (ISSN 0022-409X) is published six times yearly for $56.00 per year by the Society for Range Management, 1839 York Street, Denver, Colorado 80208. SECOND CLASS POSTAGE paid at Denver, Colorado. POSTMASTER: Return entlre journal wlth address change-RETURN POSTAGE GUARANTEED-to Society for Range Management, 1839 York Street, Denver, Colorado 80206.
Managlng Editor PETER V. JACKSON Ill
1839 York Street Denver, Colorado 80206 Edltor
PATRICIA G. SMITH
Society for Range Management 1839 York Street
Denver, Colorado 80206 (303) 355-7070 Book Review Editor DAVID SCARNECCHIA
Forestry and Range Management Washington State University Pullman, Washington 99164-6410
61
Comparison of actual and predicted blue oak age structures
by Mitchel P.
McClaran and James W. Bartolome
Grazing Management
64
Herbage production of Mediterranean grassland under seasonal and
year-long grazing systems
by Mario Gutman, Noam G. Seligman, and Imanuel
Noy-Meir
Animal Physiology
69
Comparison of the copper and molybdenum status of yearling steers
grazing reclaimed mined-land and native range
by J.F. Karn and L.
Hofmann
73
Estimates of critical thermal environments for mule deer
by Katherine L.
Parker and Michael P. Gillingham
TECHNICAL NOTES
82
A comparison of two furrow opener-depth control assemblies for seeding
forage grasses
by T. Lawrence and F.B. Dyck
BOOK REVIEWS
85
From Sagebrush to Sage: The making of a Natural Resource Economist
by Marion Clawson;
Cyprus: A Chronicle of Its Forests, Land and People
by J.V. Thirgood;
Natural vegetation of Oregon and Washington
by Jerry
Franklin and C.T. Dyrness;
Population Ecology of the Mallard, VIII,
Winter Distribution Patterns and Survival Rates of Winter Banded
Mal-lards
by James D. Nichols and James E. Hines; The
Physiology of Plants
Under Stress
by Maynard G. Hale and David M. Orcutt (with a chapter by
Laura K. Thompson).
ASSOCIATE EDITORS DON C. ADAMS
USDA ARS
Livestock 8 Range Research Rt 1. Box 3
Miles City, Montana 59301 WILL BLACKBURN
N.W. Watershed Res. Center 270 South Orchard Boise, Idaho 83705 CARLTON BRITTON
Range 8 Wildlife Mgmt Texas Tech University Lubbock, Texas 79409 TIMOTHY E. FULBRIGHT
College of Agriculture Texas A&I
POB 156, Sta. 1 Kingsville. Texas 78363
RICHARD H. HART USDA-ARS 8408 Hildreth Rd. Cheyenne, Wyoming 82009 RODNEY HEITSCHMIDT
Box 1658
Vernon, Texas 76384 PETE W. JACOBY, JR
P.O. Box 1658 Vernon, Texas 76384 HOWARD MORTON
2000 E. Allen Road Tucson, Arizona 85719
BRUCE ROUNDY 325 Biological Sciences East Building, Univ. Arizona Tucson, Arizona 85721 DAVID M. SWIFT
Natural Resources Ecology Colorado State University Ft. Collins, Colorado 80523 PAUL TUELLER
Range Wildlife 8 Forestry UNR 1000 Valley Road Reno. Nevada 89512 STEVE WHISENANT
Texas ABM Univesity Dept. of Range Science
The Trail Boss @
Preslrknt
THOMAS E. BEDELL Ext. Rangeland Res. Spec. Oregon State University Corvallis, Oregon 97331
IdvIce--t
REX CLEARYBox 16
Genoa, Nevada 89411 2nd Vie&resident STAN TIXIER
2589 North 200 East Ogden, Utah 64414 Execuuve
vkc-Pmident
PETER V. IACKSON, IllSociety for Range Management 1839 York Street
Denver, Colorado 80206 (393) 355-7070 Directors 1987-lm9
MARILYN I. SAMUEL 1333 Cashew Road Santa Rosa, California 95403 KENNETH D. SANDERS
1330 Filer Avenue E. University of Idaho Ext. Serv. Twin Falls, Idaho 83301
The Journal of Range Management
serves as a forum for the presentation and discussion of facts, ideas, and philosophies pertaining to the study, management, and use of rangelands and their several resources. Accordingly, all material published herein is signed and reflects the individual views of the authors and is not necessarily an official position of the Society. Manuscripts from any source-nonmembers as well as members-are welcomeand will be given every consideration by the editors. Editorial comment by an individual is also welcome and, subject to acceptance by the editor, will be published as a “Viewpoint.”19W-1996
KENDALL L. JOHNSON Dept. of Range Resources University of Idaho Moscow, Idaho 83843 ED NELSON
Box266 Stavely, Alberta Canada TQL 1ZO 19&+199l
CHARLES E. JORDAN P.O. Box 153tl
Rapid City, South Dakota 57709 PHILLIP L. SIMS
Southern Plains Range Research Station USDA, ARS
zoo0 16th Street Woodward, OK 73BBl
The term of officeof all elected officersand direc-tors begins in February of each year during the Society’s annual meeting.
Effects of continuous grazing on habitat and density of
ground-foraging birds in south Texas
DENISE L. BAKER AND FBED S. CUTHEBY
All&d
We analyzed tbe reqonse of the key habitat faturea and ground-foraghlg binb to 2 intenBitiem of continuour grazing on umiy loun and clay roib in the Texas Coastal Rend during 19(14-1985. Heavy continuoum grazing increased the diaper&n but not neceaurily tbe avaiUUity of bare ground in compubum witb moderate continuous grazing. Responsea of kabitat faturer (structnh of ground cover, key food plants) depended on aoil type. ~d~~OIWt~madow~(Sturncllr~)w~
bigber on clay tkan on mndy loam soh and bigha m&r moderate tkan under keavy grazing. Mourning dova (Zen&a mauoura)
were more abundant on sandy I- than on clay8 and more
rbandant under heavy than under moderate grazing. Northern bobwhite (Coiinus vitgh&mus) abundance wao uniformly low, rMofgr=hintenritJ-ddtype.
Key Word% continuous grazlag, eastern meadowlark, moumdng dove, nortban bobwhite, Texas
Among
numerous approaches
tograzing management, contin-
uous, yearlong grazing remains one of the most common. This
approach minimizes management input and may maximize live-
stock performance, depending on area (Holechek 1983). Further,
continuous grazing has been more profitable. than epasture,
deferred rotation and high intensity, low frequency grazing in the
Texas Coastal Bend (Drawe 1988).
A primary decision in use of continuous grazing to manage
wildlife habitat is livestock stocking rate (AU/ ha). Diiercnt stock-
ing rates (e.g., light, moderate, heavy) have different impacts on the
structure and composition of vegetation, which in turn affect the
distribution and abundance of wildlife (Robinson and Bolcn 1984,
Ryder 1986).
Despite the prevalence of continuous grazing, little research has
analyzed the impacts of different stocking rate%
on wildlife popula-
tions. We determined the response of key habitat features and
populations of northern bobwhites (Colinus
virginianus),moum-
ing doves (Zenai&
macroura),and eastern meadowlarks (Stur-
nelka magna)
to 2 intensities of continuous grazing by cattle.
Study Area and Methods
The
study took place on the Rob and Bessie Welder Wildlife
Refuge, San Patricia County, Texas, from July 1984 through June
1985. The refuge has 3,158 ha of rangeland and wetlands adjacent
to the Aransas River (Drawe ct al. 1978). Elevation ranges from 1
to 4 m above mean sea level. Climate ranges from humid subtropi-
cal to subhumid subtropical with average winter and summer
temperatures of 13.9 and 30.00 C, respectively (Guckian and Gar-
cia 1979). Average annual rainfall is 89 cm with most occurring in
late summer and fall (Drawe et al. 1978).
Data were collected on 4 experimental pastures established in
Authors ark wildlife biologist, U.S. Fish and Wildlife Service, Phoenix, Arizona; and research scientist, Caesar Klebcrg Wiie Research Institute, Texas A&I Univcr- sity, Kingsvillc. At the time of the research, the senior author was research assistant, Caesar Klebcrg Wiiliie Research Institute.
A
The Caesar Klebcrg Foundation for Wildlife Conservation funded the study.
Y elder Wildlife Foundation Contribution 355. preciation is extended to the Welder Wildlife Refuge foraccessand housing. This is Manuscript accepted 9 May 1989.
1982. Soils on 2 pastures consisted mainly of Gdcm fine sandy
loam with outcroppings of Sinton loam (Guckian and Garcia
1979). Victoria clays occur& in the other 2 pastures.
A
pasture
on
each soil type received heavy (2.8 ha/AU) or moderate (5.6
ha/ AU) continuous grazing treatments identified as follows: MS =
moderately grazed sandy loam soils (221 ha), HS = heavily grazed
sandy loam soils (163 ha), MC = moderately grazed clay soils (144
ha), and HC = heavily grazed clay soils (277 ha).
Eight 400-m line transects, oriented north-south and 400 m
apart, were established in each treated pasture by selecting a ran-
dom starting point. The transects were used for seasonal sampling
of vegetation structure, selected forb and grass species, and bird
abundance. Sampling took place in summer (July-Aug.), autumn
(Oct.-Nov.), winter (Jan.-Feb.), and spring (May-June).
We indexed vertical structure of vegetation with a profile pole
(Robe1 et al. 1970) with readings at 13 points on each of the line
transects. The first point was at the beginning of a transect and the
remainder were 30.7 m apart. At each point we estimated percent
visual obstruction (Guthery et al. 1981) for ldm strata on the
profile pole from a distance of 4 m (kneeling position) up to a
height of 1 m. Seasonal sample size was 104/treated pasture except
in winter 1985 when flooding prevented data collection at 7 points.
We used chuter analysis (FASTCLUS procedure, SAS 1982~433)
to identify types of structural profiles of vegetation based on strata
screening. Examination of the dendogram of profile types indi-
cated observations could be classified into 2 general types: profiles
with high screening below and sparse screening above 2 dm and
profiles with high screening at heights up to 1 m (Fig. 1). The
shapes of profiles differed slightly among seasons (Baker 1988).
Bccausc of their importance as food to the bird species under
-*
--m_
0
-w ---- t 11
2
3
4
5
6
7
a
9
10
STRATUM HEIGHT CLASS [DMI
Fig. 1. Schematic repmentation of v~etationprom trpa
idcatifkdthro@ cluster amlynis, San PWicio Colmty, Texas, 198445.
study (Lehmann and Ward 1941, Parmalee 1953, Gross 1958, Dillon 1961, Genung and Green 1974, LAmann 1984, Wood 1985), we determined density, canopy coverage, and percent fre- quency of occurrence of the following plants on each experimental pasture: erect dayflower (Commelina erectu L.), bundleflower (Desmrmthus sp.), milkpea (Gulocria spp.), powderpuff (Mimosa
spp.), American snoutbean [ Rhynchosia umericuna (Mill.) Metz. J, Texas croton [Croron rexensir (Klotzch) Muell. Arg.], one-seed croton (C. monanrhogynus Michx.), western ragweed (Ambrosia psilostuchya DC.), seacoast sumpweed (Ivu unnua L.), bristle- grasses (Seruria spp.), paspalums (Paspdum spp.), and panic grasses (Panicurn spp.). We also measured percent coverage and frequency of occurrence of bare ground and litter. Sampling con- sisted of 12 randomly located O.S- X 0.5-m quadrats/line transect, giving 96 points/ treated pasture per season. Although sampling took place in each season, we report vegetation data from summer only for economy of presentation. Baker (1988) provided data from other seasons.
Bird densities were estimated seasonally along the 8 line tran- sects/pasture. We recorded the number of birds seen (flushed or perched) and paced the perpendicular distance to observation points during morning (0.5 hour before sunrise to 0900) and even- ing (2 hours before sunset) walks. Each transect was walked 8 times giving a sampling effort of 25.6 km/ treated pasture per season.
We used program TRANSECT (Bumham et al. 1980) solely to obtain an estimate of f(O), the inverse of one-halfthe effective strip width. Small sample size precluded seasonal stratification of flushing-distance data for bobwhites. For mourning doves and meadowlarks, we stratified by winter-spring and summer-autumn periods in estimating f(0). We then estimated pasture- and species- specific abundance as (total birds seen) (1 /total distance walked) (2/f(O)) and converted the estimate to number/40 ha. The Fourier series detection model adequately described (m.29) flushing fre- quencies for each species. One-halfeffective strip widths were 8.5 f 0.68 m (*se) for bobwhites, 12.9 f 0.70 m and 12.1 f 0.70 m for meadowlarks in summer-fall and autumn-winter, respectively; and 13.3 f 1.45 m and 13.3 f 1.24 m for doves in summer-fall and autumn-winter, respectively.
Although grazing and soil treatments were replicated in space, the sample size was small and potential interactions between grazing treatment and soil type could not be tested. Therefore, we stress descriptive statistics herein. In particular, we present means of seaonal samples and identify salient trends in seasonal response.
We used subsamples from within treated pastures to analyze responses of selected plant taxa and bird densities (point estimates for each replication of a transect) under a 2 X 2 factorial design. Because of a high frequency of zeros (non-normal distribution), data on density and coverage were rank-transformed for analysis
(Conover and Iman 1981) and retransformed for presentation. Frequency values were analyzed with the Chi-square statistic. Inferences arising form the above analyses pertain only to the study site (Hurlbert 1984).
Results and Discwsion
Habitat ResponsesMean seasonal frequencies of Type 2 profiles (Fig. 1) were similar on the HS, HC, and MC pastures at 858% (Table 1). These frequencies were at least 23% lower (x0.01) on the MS pasture than on the other pastures. We interpret these results to indicate that grazing intensities studied had little,effect on structure of ground cover on clay soils. On sandy soils, reduced grazing pressure was associated with an increase in cover available at heights >2 dm.
Within seasons, grazing intensity and soil type also influenced (p<O.OS) the availability and dispersion of bare ground. Moderate grazing was associated with a 32% decline in the dispersion (fre- quency) of bare ground on both sandy loams and clays (Table 1). However, coverage by bare ground was similar on the HS and MS pastures, whereas it was >3 times higher on the HC pasture than on the MC pasture. We interpret these results to indicate that higher grazing intensities will increase the dispersion, but not necessarily the availability, of bare ground, depending on soil type. Mean coverage and frequency of litter showed no large responses on any of the pastures (Table 1).
Bare ground is an important component of habitat for ground- foraging, seed-eating birds such as bobwhites (Rosene 1969, Guth- ery 1986) and mourning doves (Rosene 1939). None of the pastures studied supplied optimum average amounts of bare ground for bobwhites, which range between 30 and 60% (Guthery 1986:l IS). Four taxa showed no differences (p>o. 10) in density, coverage, or frequency of occurrence among experimental pastures. These species or genera were erect dayflower, bundleflower, milkpea, and powderpuff. Dayflower, bundleflower, and powderpuff were com- mon throughout the study area; their lack of response may have been due to broad adaptability. Milkpea was seldom encountered (O-3%) in sample plots. The lack of response simply reflected scarcity of this species.
Four species responded to soil type independent of grazing pressure and pasture interactions (x0.05) (Table 2). Texas croton and American snoutbean had higher density or coverage on pas- tures with sandy loams than on those with clays, whereas western ragweed and seacoast sumpweed densities were higher on pastures with clays than on those with sandy loams. These results were expected based on known ecological requirements of the species (Jones 1982).
Density of one-seed croton was the only variable that showed a
Table 1. Mean seasonal reaporue of habitat futurea to buvy (2.8 h/AU) and moderatc(5.6 ha/AU) continuow grazing on sandy loam and thy 1~ San Patrlcio Couoty, Tcxaa, 198645.
Variable
Frequency of Type 2 profiles (%)’ Bare ground
covcragc (%) Frequency (%) Litter
coverage (%) F=qu=Y (%) ‘See Fig. 1.
Sandy loam mY
Heavy Moderate Heavy Moderate
x Be x se x se x se
81 5.3 65 8.3 89 3.6 85 5.8
12 0.2 :: 1.6 17 3.3 5.1 0.8
79 3.0 5.5 84 3.7 57 3.8
33 11.4 31 11.8 12.8 38 18.1
86 6.6 69 13.5
ii
5.8 80 14.8
TabIe 2. Effects of es- pmturw on the dcadty (no./m’), canopy coverage (%), and freqwaq of occurrence (5%) of aekcted wiNlife food piah, San PatrIdc Couaty, Texes, summer 19tUf
Species Variable
Pasturc2
I-IS MS HC MC MSE’ P Significant effect
American snoutbean Density Cover FrcquCncY Texas croton Density Cover Freqt=ncy One-seed croton Density COVCF Frequency Western ragweed Density Cover Frequency Seacoast sumpweed Density Cover Frequency BristIegrasses Density Cover Frequency Paspalums Density cover Frequency Panic grasses Density Cover Frequency ii:: 0 36.9 36.9 0.0029 0.0029 0.2000 soil soil None 0.0059 0.0056 0.0005 soil Interaction Interaction
0.0025 Graze
0.0026 Graze 0.2000 None
0.0001 soil
0.0472 Interaction 0.0005 Interaction 0.0001 O.oool 0.0005 Soil soil Interaction
0.5249 None 0.6233 None 0.0250 Interaction
0.0020 Interaction 0.0227 Interaction o.Ow5 Interaction 0.0171 Interaction 0.0165 Interaction 0.0005 Interaction 0.1 0.1 7 0.3 0.3 13 0.0 0.0 0 ;:
24’
0.3 1.4 12 td tr 2 51.4 54.1 tr tr 20.3 0.0 tr
0.1 0.0 tr
6 0 3
0.0 0.0 0
35.4 35.9
1.2 5.2
0.6 2.0
30 41
50.1 62.7 0.6
0.6
15 9
X:l
41.0 35.3 ii:: 0 0.9 0.2 6 3.1 2im7 4.4 3.3 51 i:: 8 8:: 5 8:: 7 0.0 0.0 0 54.9 55.9
0.5 0.1 tr 0.3
0.9 0.8 0.1 2.0
18 4 1 12
53.0 63.8 47.7 51.0 i:: 18 0.1 0.1 4 8:: 0 :6 4
‘Table includes only those plants that rhowed responses (KO.05) on experimental pastures. Erect dayflower, bundleflower, milkpea, and powderpuff Bowed no rcaponsc (PX.10).
*HS = heavily grazed, sandy loam soti, MS : moderately grazed, sandy loam soils, HC = heavily grazed, clay soils; MC = moderately w. clxy soils. 3Mcan aquan error based on % plots/ turc.
‘Base-d on F-test of rank-transformed JF ta for density xnd coverage and chi-squarc test for frequency.
%r = trace (CO.05).
significant response to grazing pressure in the absence of soil and pasture interaction effects (Table 2). This croton was more dense on the heavily grazed than on moderately grazed pastures. Heavy grazing is known to favor this species (Corm11 and Johnston 1970).
The most common response was a soil X graxing interaction (Table 2). For example, percent cover of western ragweed and cover and density of paspalums and panic grasses seemed to be favored by heavy graxing on sandy loams and moderate grazing on clays. Baker (1988) discus& interaction effects observed during the present study in greater detail.
The high frequency of interactions could have reflected 2 under- lying mechanisms. Plant phenology may vary with soil type inde- pendent of grazing program. Phenological stages vary in palatabil- ity to livestock. Whether these 2 factors operate simultaneously or independently, they could generate interaction responses such as those observed.
Also, the interactions could reflect relative palatability of a given taxon. For example, slightly unpalatabk species might be used more heavily in communities consisting largely of highly unpalata- ble species than in communities consisting largely of highly palata- ble species.
B&d Respomra
The response of bobwhites to soil type and grazing pressure was variable and ambiguous. Density indices ranged from O/40 ha on
the HS, HC, and MC pastures in autumn and winter to 25.9140 ha on the MS pasture in autumn. Mean seasonal densities were sim- ilar on the MS, HC, and MC pastures (Fig. 2). We interpret these results to indicate that, at the time of the study, the study area provided marginal habitat conditions for bobwhites, and the graz- ing pressures applied since 1982 had either uniformly depressing or neutral effects on quail. This lack of response to grazing intensity is in contrast to other studies, in which increased 8razing pressure associated with short duration grazing seemed to favor quail popu- lations or their key habitat features (Bareiss 1985, Wilkins 1987, Schulz and Guthery 1988). Quail on our study area have responded positively to grazing treatments that increased the availability of bare ground and forbs and reduced the availability of grasses (Hammerquist-Wilson and Crawford 1981). Further, sandier soils generally are more favorable for bobwhites than clayey soils (Leh- mann 1984).
Abundance of meadowlarks varied seasonally due to the migra- tory habits of this species. Averaged over experimental pastures, density (x f se, no./40 ha) increased from spring (16.7 f 8.86) to fall (47.1 f 14.86) to winter (78.7 f 39.11) and then declined in summer (5.1 f 1.85). Based on mean seasonal abundance, which largely reflected fall and winter populations, meadowlarks used habitat supported by clay soils more heavily than habitat sup- ported by sandy loam soils (Fig. 2). These soil effects were signifi- cant in summer (PCO.0056) and winter (p<O.O005). Mean seasonal
Litarture
cited
Baker, D.L. 19gg. Respoases of bobwhites, eastern mcadowlarks, moum- ing doves, and their habitat to two intensities of continuous grazing. MS. thcsis. Texas A&I Univ., Kingsville.
Bamiss, L.J. 19115. Response of bobwhites to short duration and continu- ous graxing in south Texas. MS. thesis. Texas Tech Univ., Lubbock. Burnham, K.P., DR. Au&rum, and J.L. Laake. 19g8 Estimation of
density from line transect sampling of biological populations. Wildl. Monogr. 72.
Conover, W.J., and R.L. Iman. 19111. Rank tntnsfotmations as a bridge betweenparametricand nonparametric statistics. Amer. Stat. 35124-129. Corrall, D.S., and MC. Johnston. 1970. Manual of the vascular plants of
Texas. Texas Res. Found. Renner, Texas.
Dillon, O.W., Jr. 1911. Mourning dove foods in Texas during September and October. J. Wildl. Manage. 253334-336.
Dram, D.L. 19MI. Effects of three graxing treatments on vegetation, cattle production, and wildlife on the Welder Wildlife Foundation Refuge, 19741982. Welder Wildl. Found. Contrib. B-8. Sinton, Texas.
Drawe, D.L., AD. Cbamrad, and T.W. Box. 197s. Plant communities of the Welder Wildlife Refuge. Welder Wikll. Found. Contrib. 5, S&es B. Smton, Texas.
Ganung, W.G., and V.E. Green, Jr. 1974. Food habitats of the meadowlark in the Everglades in relation to agriculture. Environ. Entomol. 3:39-42. Gaorga, RR. 19MI. Mourning doves in Texas. Texas Parks and Wiil.
Dept. Austin, Texas.
Gross, A.O. 1958. Eastern meadowlark, p. 53-80. In: AC. Bent (Ed.). Lie histories of North American blackbirds, orioles, tanagers, and allies. U.S. Nat. Mus. Bull. 211.
Gtmklan, W.J., and R.N. Care&. 1979. Soil survey of San Patricia and Aransas counties, Texas. USDA, SCS. Washington, D.C.
Guthery, F.S. 1984. Beef, brush and bobwhites: quail management
in
cattlecountry. Caesar Kleherg Wild]. Rcs. Inst. Press. Kingsville, Texas. Guthary, F.S., T.B. Doesr,and M.A. Taylor. 19111. Use of a profile board in
sand shinnery oak communities. J. Range Manage. 34157-158. Hammerqubt-WBson, MM., and J.A. Crawford. 191)l. Response of bob-
whites to cover changes within three graxing systems. J. Range Manage. 34~213-215.
Holecbek, J.L. 19g3. Considerations concerning graxing systems. Rangc- lands 5:288-211.
Hurlbert, S.H. 19M. Pseudoreplication in the design of ecological field experiments. Ecol. Monogr. 54: 187-211.
Jones, F.B. 1982. Flora of the Texas coastal bend. Welder Wildl. Found. Contrib. B-6. Sinton, Texas.
Lebnwm, V.W., and Ii. Ward. 1941. Some plants valuable to quail in soutbwestem Texas. J. Widl. Manage. 5:131-133.
Lebmann, V.W. 19g4. Bobwhites in the Rio Gratxle Plain of Texas. Texas A&M Univ. Press. College Station.
Parmake, P.W. 1953. Food and cover relationships of the bobwhite quail in east&ntral Texas. Ecology 34758770. _
Robel, R.J., J.N. Brings, A.D. Dayton, and L.C. Hulbsrt. 1970. Relation- ships between visual obstruction and weight of grassland vegetation. J. Range Manage. 23295-297.
m HEAVY, SANDY LOAM
MODERATE, SANDY LOAM
HEAVY, CLAY
-ml MODERATE, CLAY I
BOB- MEADOW-
DOVE
WHITE
LARK
Fig. 2. Mean seasonal demities of 3 bird apecks on experimental pastwe differing in soil type and grazing pressure, San Patrlcio County, Texas, 1984-85.
abundance was higher in moderately grazed than in heavily grazed pastures in both soil types, but effects were significant (KO.0063)
only during summer. No interaction effects were observed (J70.05). Mourning dove use of experimental pastures also reflected migratory behavior. Mean density on experimental pastures increased from summer (4.8 f 1.71) to fall (30.9 f 20.56), remained stable through winter (33.9 f 24.26), and declined into spring (2.1 f 0.8). Seasonal density averaged higher on sandy loams than on clays, and higher under heavy grazing than under moderate graz- ing on both soil types (Fig. 2). Soil effects were significant in autumn (KO.0008) and winter (KO.0279) and grazing effects were significant in winter (F<O.O073). We attribute these responses to increased dispersion of bare ground in response to heavy grazing (Table l), higher densities of croton, a favored food (George 1988), on sandy loams than on clays, and an apparent increase in one-seed croton due to heavy grazing (Table 2). No interaction effects were observed (I70.05).
Conclusion
We believe the most significant implication of our results is the potentially high frequency of interaction effects between grazing pressure and soil type, Because habitat management largely means management of plant taxa and communities, wildlife managers need to understand how important taxa and communities respond to grazing pressure. With such knowledge, they can make grazing management decisions consistent with goals of wildlife manage- ment. Our findings imply that the proper decision may vary according to soil type, and by extension, may be influenced by other factors that affect site productivity, such as annual precipita- tion and length of growing season. Whereas attention to interac- tion effects complicates management, it also makes possible sensi- tive and sophisticated management decisions. We recommend further research into the interactive effects of grazing pressure and environmental variables on wildlife habitat and populations.
Robimon, W.L., and E.G. Boles. 19M. Wildlife ecology and management. Macmillan Publ. Co. New York, New York.
Rossna, W., Jr. 1939. A preliminary investigation of the food habits of the mourning dove in Alabama. USDA Wiidl. Res. and Manage. Lea& 133. Ruaene, W. 1969. The bobwhite quail: its life and management. Rutgers
Univ. Press. New Brunswick, New Jersey.
Ryder,R.A. 191M.Songbirds,p. 291-312. fn:A.Y. Cooperrider, R.J. Boyd. and H.R. Stuart (Eds.). Inventory and monitoring of wildlife habitat. U.S. Gov. Printing Off Washington, D.C. -
SAS hutitute, Inc. 1982. SAS user’s guide: basics. SAS Inst., Inc. Gary. North Carolina.
Sdtula, P.A., and F.S. Guthsry. 1988. Effects of short duration graxing on northern bobwhites: a pilot study. Wildl. Sot. Bull. 16:18-24. WBkins, R.N. 1987. Influence of graxing management on population
attributes, habitats, and habitat selection of bobwhites in south Texas. M.S. thesis. Texas A&M Univ., College Station.
Wood, K.N. 19M. Bobwhite foods and nutrition in the Rio Grandc Plain of Texas. M.S. thesis. Texas A&I Univ., Kmgsville.
Distribution of nitrogen fractions in grazed and ungrazed
fescue grassland Ah horizons
JOHAN F. DORMAAK, SYLVER SMOLIAK, AND WALTER D. WILLMS
AbStUCt
Grazing
affects
the plant ecology and adds cxcreta, thereby lnfluenclng soll N relatlonshfps. Consequently, total N, mlnerallx- able N, exchangeable N, hydrolyxable N, and urease activity were assessed at the Agriculture Canada Research Substation, Stavely, Albert8, in the Ah horizons on rough fescue (F&ucu scafueI& Ton.) grasslands stocked at either light (0.8 ha/AUM) or very heavy (0.2 ha/AUM) fixed rates for 38 years and in exclosurea located within each field for an equal period of time. Even though total N expressed as t/ha per Ah horizon remained the same, changes in various N fractions were nevertheless evident. Graxing resulted in more NH&N and NO&N in both fields at the time of sampling and each was greater at the higher stocking rate. Although soll N was less mfneralixable, it was more acid- hydrolyxable at the nigher stocking rate. Urease activity also increased. The effect on soll N charrcteristics of increased excretr loads is complex and still not well understood.Key Words: mfneralixable nitrogen, hydrolyzable nitrogen, ex- changeable nitrogen, urease activity, stocking r&e
A number of previous studies on the grazing experiment sampled for the present study have been published. Johnston et al. (197 1) established that very heavy grazing of fescue (Festuca scu- brella Torr.) grassland range compared with light grazing changed the color of the Ah horizon from black to dark brown and the pH from 5.7 to 6.2, reduced the percent organic matter and percent total P, but increased NaHCOs-soluble P and soil temperature. Total N remained the same, but C/N ratios changed from 11.5 to 9.8. Soil moisture decreased with increased grazing intensity as water intake rate was reduced and, presumably, evaporation increased with the removal of litter. The potential for soil erosion by water is high when about 15% of the soil surface is bare (John- ston 1962). The soil of the very heavily grazed field was being transformed to a soil characteristic of a drier microclimate. Other than total nitrogen (N) which did not show any definite trends (Johnston et al. 1971; Dormaar et al. 1977), no other forms of N have been studied in thii long-term grazing experiment. Urease activity in soil from an ungrazed field was less than that in soil of the very heavily grazed field (Dormaar et al. 1984).
The most important forms of available N are NH;, NO& and certain simple organic compounds, principally those containing free amide or amino groups. The level of inorganic N in the soil, consisting of both Na and NH; ions, is governed in natural ecosystems by the balance between supply from mineralization of organic N, rain-borne N, and fixation and losses through immobil- ization, leaching, volatilization, and uptake by the vegetation (Stevenson 1986). The levels are normally low because of their rapid utilization by the range vegetation. With active grazing, an additional cycle is introduced and consists of N passing through the animal body, after which most of it is usually returned to the soil through excreta.
Following studies of old-field successions from abandonment of
AFthorn arc soil scientist, retired “ngs molo@st, and range ecolo ‘St, nspe$iv~ly, ~8~,u~rc Canada Rcscamh Stauon, Lahbndgc. Alberta TlJ 4 f 1. Contnbutlon
Manukipt accepted 23 March 1989.
6
cultivated soils to the climax, Rice (1984) established that the amount of NH&N increased from a minimum quantity in the first successional stages to a maximum in the climax and vice versa for NO&N. Further, Dormaar (1988) observed that the quality of the soil organic matter and, possibly, of root exudates may affect the formation of NH&N and NO&N. Grazing changes the vegetation composition and the chemical characteristics of soil (Johnston et al. 197 1) but its effect on the mineral N status is not clear. Nitrogen is a key element in the grassland ecosystem, because of its capacity to limit primary and secondary production. A study was made to determine the effects of grazing on the composition and quantity of nitrogen in the Ah horizon of the rough fescue grasslands and to assess the consequences of the effects.
Materials
and
MethodsThe study site was at the Agriculture Canada Research Substa- tion, Stavely, Alberta, situated in the Porcupine Hills, an area managed primarily for grazing by cattle. The vegetation is typical of the Fescue Grassland Association (Coupland and Brayshaw 1953). The soils are members of the Orthic Black Subgroup of the Chemozemic Order (Udic Haploboroll), developed on till overly- ing sandstone, and have a clay-loam to loam texture. The climate is dry subhumid and annual precipitation averages about 500 mm. Details of the overall grazing trial since 1949 have been given by Johnston et al. (197 1) and Wilhns et al. ( 1985).
On 15 Oct. 1986,2 fields grazed by cows with calves since 1949 and adjacent exclosures were selected for sampling. The fields were grazed each year from about 15 May to 15 Nov. The lightly stocked field (field L) was at a rate of 0.8 ha per animal unit month (AUM) and the very heavily stocked field (field VH) at the rate of 0.2 ha/ AUM. The grazing season of the latter field, because of deterio- ration of cover, varied from about 2.5 to 5 months since 1962. Cattle removed about 25 and 80% of available forage in fields L and VH, respectively.
Soil pits were dug and soil profiles were described at each site. In addition, the Ah horizon was sampled in 4 subplots in fields L and VH which were paired with 4 subplots in the exclosures within the same fields, giving a total of 16 samples. The paired plots had similar slope and aspect thereby reducing variability due to site. Only the Ah horizon was sampled because over 70% of the root system can be found here (Coupland and Brayshaw 1953). Even though organic matter and nitrogen levels fluctuate with the sea- sons (Dormaar et al. 1977, Dormaar et al. 1984), the sampling was made in autumn because the effects of excreta and trampling would be at their peak. The sampling period was similar to that reported by Johnston et al. (197 1) as part of a study examining grazing effects on soils.
The samples were hand-sieved through a 2-mm sieve the day they were collected. A portion of each sieved sample was stored in sealed, double polyethylene bags at 4’ C, the remainder was dried and ground to pass a 0.5-mm sieve. At the time of sieving, roots and other debris were removed from the soil and discarded. Moisture content of the soil was determined by drying a small portion overnight at lOSo C. The mineraliible N analyses were carried out
on the moist soil. All other analyses were carried out on the airdried soils.
Urease activity, which is important as a decomposing agent for urea, was determined at pH 9.0 by incubating 5 g with tris(hydroxy- methyl)-aminomethane buffer (0.05 M), urea solution, and toluene at 370 C for 2 hours, and measuring the ammonium released after steam distillation (Tabatabai and Bremner 1972). Total N was determined by the method outlined by the Association of Official Agricultural Chemists (1950) and hydrolyzable N, amino acid-N, amino sugar-N and NHs-N by methods described by Stevenson (1982). The relative ability of the soils to mineralize the N from the organic matter was determined as outlined by MacKay and Care- foot (1981); exchangeable NO&N and NH&N by KC1 extraction and steam distillation were as outlined by Keeney and Nelson (1982). All analytical results were expressed on the basis of oven- dried weight of soil,
The data were analyzed as if there were 4 treatments with 4 replications using a one-way analysis of variance, with the assump- tion that the sampling error represented the experimental error. Single degree of freedom contrasts (Steel and Torrie 1980) were used to test for differences between selected meanr.
Although replication and application of current statistical ana- lyses to newly established, replicated field plot experiments is common and undeniably desirable and useful, valid information and data can still be gained from early established, unreplicated field experiments including long-term grazing trials, by virtue of their antiquity (Ridley and Hedlin 1968, Dormaar and Pittman 1980).
Soil profiles were up to 69 cm thick (Table l), and gravel to cobble size quartxitic stones were present throughout the profile together with sandstone ghosts in the lower Bma and Ck horizons. Table 1. Pedon dwcription of the Ortbk BIack Cheruozemtc (UdIc
HapIoboroU) soil at the Agrkultwe Caaeda Reneueb Substation, Stavely, Alberta
HOtill Thickness (cm)
Ab 14 to 20 Black (IOYR 2/ 1. moist) clay loam; modetate fm gum*, soft, very friable; abundant fine to medium ran- dom roots; tongued boundary; mildly acidic.
Bml 8toZl Dark yellowish brown (IOYR 3/4, moist) clay loam; weak, fine sub angular blocky; slightly hard, fewer, fme to medium vertical roots; diffuse boundary; neutral.
Bms 12to20 Dark yellowish brown (IOYR 4/4. moist) loam to clay loam; moderate coarse, prismatic to subangular blocky; firm; few very fine, vertical roots; abrupt, wavy boundary; neutral.
ck 8 Yellowish brown (IOYR 5/4, moist)
with verv nale brown (10YR 8/3. moist) &y loam, angular blocks friable; strongly effervescent; few roots; mildly alkaline.
With progressive transformation of the soil due to increased grax- ing pressure, the color of the Ah horizon in field VH changed from black (1OYR 2/ 1, dry) to dark brown (1OYR 3/3, dry) indicating a loss of organic matter. The average water content of the Ah horiz- ons of the soils in the exclosures, field L, and field VH, at the time
of sampling, was 64,59, and 52% (w/w), respectively. Between 15 Sept. and 14 Oct. 1986,92 mm of precipitation occmred in the form of rain and wet snow.
The N characteristics of the samples from the 2 exclosures were similar in each comparison (FXJ.40) even though, geographically, one exclosure was in an upslope and the other was in a midslope position. Therefore, their data were combined for comparisons with the graxed fields (Table 2).
Total N, exchangeable N, hydrolyzable N, and urease activity in soils increased with graxing intensity, while mineralizable N and amino sugar decreased (Table 2). Soils of the exclosure were sim- ilar, with respect to total N and amino sugar, to the soil of field L.
Dinmsdon
Willms et al. (1985) noted that prior to the initiation of the grazing study in 1949, the area was moderately stocked for summer graxing with cattle from 1884 to 1908, with horses from 1908 to 1920, and with cattle again from 1920 to 1943. The latter period, however, included heavy use during the 1930’s drought. Finally, the area was used lightly for winter pasture from 1944 to 1949. In 1949, when this study was started, exclosures were established. Even though the range condition in the exclosure of field L had reached near stability 14 years later in a level upslope position and the range condition in the exclosure of field VH was still improving in 1981 due to its steep midslope position (Willms et al. 1985), the soil profile descriptions of the 2 exclosures were now quite similar. In addition, the soil characteristics measured were in the same steady state. The changes in color and depth of the Ah horizons, as noted by Johnston et al. (1971), and the changes in the various N parameters measured (Table 2), thus represent either an intensifi- cation or an amelioration of the characteristics existing in 1949 by the grazing scheme imposed.
Soil samples were not taken at the start of the present grazing study in 1949. The first samples analyzed were in 1967 (Johnston et al. 1971); however, the exclosures were not sampled and bulk densities were not determined at that time. Total N at that time was 0.59 and 0.57%for fields Land VH, respectively. These values were the averages of 10 samples randomly selected from grids superim- posed on these fields. Of these samples, those closest to and in equal positions to the sites sampled in 1986, averaged 0.78 and 0.79% N for field L and VH, respectively (Table 3). Even though both fields appeared to gain in N, the corresponding C/N values for fields L and VH were generally not out of line (Table 3).
Since the increase in percent N cannot be explained and may be attributed to a sampling discrepancy between 1967 and 1986, it is more meaningful to compare the N of the exclosures with that of field VH as found at the time of sampling in 1986, For this compar- ison, N mass in the Ah horizon is a more realistic parameter because it accounts for the depth of the Ah horizon and the concentration of N which has, presumably, reached equilibrium with the grazing regime imposed on it.
Concentration of N per se in the Ah horizon cannot explain the effects of grazing soil quality since erosion of the Ah horizon and its bulk density had also been affected. However, on the basis of the N concentrations, depth of Ah horizons and the bulk densi- ties, the Ah horizons in the exclosure and under the VH field contained 12.96 and 13.07 t/ha of N, respectively (Table 3). Although grazing animals ingest a large amount of N in feed, about 75% is excreted (Peterson et al. 1956). The N was, therefore, concentrated in a more dense Ah horizon of the VH field. Sim- ilarly, the mass of N in t/ ha for field L was 12.94 (Table 3). Hence, rather than using concentrations, the focus has been on more meaningful biochemical parameters to examine the effect of in- creased grazing pressures on the quality of the soil, i.e., the redis- tribution of the N within the system.
Table 2. some nitrogen ~huddtici+
of
the Ah ~O~ZOIM of 8 Bieck Cbernozcmic eoii, hmpied 15 Oet. 1986, from 2 fieide etocked at either iWIt or VeY beevy r8ta end from their esciomree (n=4).Exciosures stockiig rate’
(E) L VH
Total N (%) 0.93 0.94 1.10
Mineralizable N (pg/g of soil)2 13.9 66.2 49.8
Exi$yble N @g/g) 9.2 12.9 18.3
NOGN 4.56 6.72 10.90
Hydrolyzable N (o/o of total N)
Total 74.9 82.5 85.0
Amino acid 25.2 27.5 30.2
Amino sugar 8.0 7.2 6.0
Ammonium 23.5 32.8 36.2
Urease activity3 252 316 410
Xiit (L) - stocked at 0.8 ha/AUM, Very Heavy (VH) -stocked at 0.2 ha/AUM. Thangc of (NH; + NOs>N from 2 successive incubations at I and 2 wk periods. ‘NFL&N r&ascd, pg/g of dry soil per 2 hours.
Contrasts
Evs.L E vs. VH L vs. VH
0.55 co.01 <o.oi
co.01 <O.Ol <o.oi
<O.Ol co.01 <o.oi
co.01 co.01 <o.oi
<O.Ol co.01 0.06
0.04 co.01 0.03
0.34 0.02 0.18
<o.oi co.01 0.01
co.01 <o.oi <o.oi
Tebie 3. C/N ratioe rod total N per Ah horizon of a Bieck Cbernozemic roil, umpied 15 Oct. 1986, from 2 fkide etocked at either iigbt or very heavy rates end from their excioeuree (~4).
Exclosuns 19862
organic c (%) 10.4
Total N (%) 0.93
C/N il.2
Depth Ah (cm) 17
Bulk density (Mg/m3) 0.82 Total N in Ah (t/ha) 12.96
Stocking Rate’
L VH
1967 1986 1967 1986 10.4
0.94 11.1
16 12
0.86 0.99
12.94 13.07
‘Light (L) - stocked at 0.8 ha/AUM; Very Heavy (VH) -stocked at 0.2 ha/AUM. 2Pcrcent C and N and bulk density were not determined in the cxclosures in the I%7 study (Johnson et al. 1971).
The increased grazing pressure resulting from the high stocking rate has altered the N properties of the range soil. Part of this can be related to the increased excreta load. For example, the excreta- related parameters, such as available N (MacDiarmid and Watkin 1972), increased in the grazed areas. Although the mineralizable N, i.e., the potential availability of N, of the whole soil was lower in the grazed than in the ungrazed soils (Table 2), dung N per se has been found to be a very efficient nutrient for plant growth because of its slow-release availability (MacDiarmid and Watkm 1972). Urease activity similarly increased in the very heavily grazed range.
Since there is less mulch and less standing biomass under the very heavily grazed regime, the soil warms up quicker in the spring (Johnson 1962, Johnstonet al. 1971) and will be drier (Johnston et al. 1971, Dormaar et al. 1989). There is more NH&N than NGN in rough fescue grassland than in grassland associations of semiarid areas. Nevertheless, in this experiment, concentrations of both forms of nitrogen increased with intensity of grazing. Bauer et al. (1987) noted that the difference between ungrazed and grazed levels of soil N could be caused by greater denitrification losses in ungrazed grasslands because of cooler and more moist conditions early in the season. Naturally, with more standing crop, more N will be taken up as well.
A decrease in mineralization rate was to be expected for several reasons. It has been shown that the Black Chemozemic soil under increased grazing pressures changes to a soil characteristic of a drier microclimate (Johnston et al. 1971). Neal (J.L. Neal, Jr., unpublished data) found that soil microbial mass decreases from
8 JOURNAL OF RANGE MANAGEMENT 43(l), Januaty 1990
the dry, subhumid to the semiarid climate of southern Alberta and from field L to field VH. Finally, over 90% of N in most surface soils is organically combined (Stevenson 1986). However, 3 other factors will have to be considered in this context as well. With heavy grazing, the quality of the soil organic matter has changed, since, in spite of increased total N content, thii N was not as potentially available. Herbage removal resulted in considerable reduction in weight of roots (Johnston 1961) and thus in root exudates. There is also evidence (Neal 1969) that roots of increas- ing and invading plants on overgrazed grasslands produce sub- stances that inhibit nitrification. This could be a mechanism where- by these plants conserve the low amounts of nitrogen available in grassland soils. The NH&N uptake characteristics of these increas- ers and invaders are, however, virtually unknown. Finally, the chemistry of the pathways of decomposition of the excreta under the influence of the changing microclimate and the root exudates of the increasers and invaders has not been studied in much detail. Although Sowden et al. (1977) showed that between 86 and 89% of the total N in soils from widely differing climatic zones was hydrolyzable by hot 6M HCl, the range for this study was 75 to 85%. For a sequence of native range to recently revegetated native range on an Orthic Brown Chemozemic (Aridic Ustochrept) soil, this range was 75 to 81% (Dormaar and Smoliak 1985). As grazing pressure increased, the fraction of the hydrolyzable N presented as amino acid-N and NHs-N gradually increased, while the propor- tion as amino sugar-N essentially remained the same. Some of the NHr,-N will be derived from indigenous fixed NH&N and part comes from partial destruction of amino sugars (Stevenson 1982). Nevertheless, the composition of a large percentage of the N in the soil is still unknown. Schnitzer and Hindle (1981) felt that the unidentified N was not proteinaceous, because relatively more ‘unknown’N occurred in the inorganic than in the organic fraction of the soil.
Models of N cycling and N budgets have tried to account for soil NH&N and NOGN, soil organic matter, and N content of above and below-ground biomass together with the actual plant, micro- organisms, and soil interactions (Patton and Risser 1977). How- ever, more detailed analyses of the Ah horizon subjected to various grazing pressures, in terms of the organic and inorganic composi- tion of excreta and root exudates of dccreasers, increasers, and invaders, will be necessary to expand these models in order to account for the accompanying plant ecological and microclimato- logical transformation.
able N decreased with graxing intensity. This change is real regard- less of the time of sampling. Nevertheless, in a study of this nature, time of sampling may be crucial. Tie and extent of availability are essential parameters for optimal plant growth. However, different plants have different N requirements, both in terms of timing and of NG or NH; requirements. Rough fescue is largely eliminated by very heavy grazing, while the new grasses and forbs will have different needs that fit the new ecological niche created by over- grazing and inueased excreta load.
Literature cited
Assachtion of Offkid
Agrkdhud Chemista. 1950. Gffiil methods of analysis. 7th ad., Washington, D.C.Bauar, A., C.V. Cole, and A.L. Black. 1987. Soil property comparisons in virgin grasslands between graxcd and nongmxcd management systems. Soil Sci. Sot. Amer. J. 51:176182.
Coupland, R.T., and F.C. Braphaw. 1%3.The fescue grassland of Saskat- chewan. Ecology M386-405.
Dormaar, J.F. l!M8. Effect of plant roots on chemical and biochemical properties of surroundingdiseretc soil zones. Can. J. Soil Sei. 68:233-242. Donnur, J.F., A. Joknston, and S. Smolhk. 1977. Seasonal variation in chemical characteristics of soil organic matter of graxcd and ungraxcd mixed prairie and fescue grassland. J. Range Manage. 3Ozl95-198. Dormur, J.F., A. JoImstou, and S. SmoBak. 1984. Seasonal changes in
carbon content, and dehydrogenase, phosphatase, and urease activities in mixed prairie and fescue grassland Ah horizons. J. Range Manage. 3231-35.
Dormau, J.F., and U.J. P&man. 1980. Decomposition of organic residues as affcctcd by various dryland spring wheat-fallow rotations. Can. J. soil. Sci. 6097-106.
Dormaar, J.F.,and S. Smoliak. 191)s. Rccovcry of vegetative cover and soil organic matter during revegetation of abandoned farmland in a semi- arid climate. J. Range Manage. 38487-491.
Dormaar, J.F., S. Smohk, and W.D. WUlmr 1989. Ve8ctation and soil responses to shortduration grazing on Fescue Grasslands. J. Range Manage. (in press).
Johnston, A. 1961. Comparison of highly graxcd and ungrared range in the Fescue Grassland of southwestern Alberta. Can. J. Plant Sci. 413615622.
Jokmtort, A. 1962. Effects of grnzing intensity and cover on the water- intake rate of Fescue Grassland. J. Ranac Manaac. 1579-82.
Jobmton, A., J.F. Donaaar, and S. Sm&ak. 19?1. Long-term grazing effects on Fescue Grassland soils. J. Range Manage. 24zi8E188, _ Kearay, D.R.,and D.W. N&on. 1982.NitrogenInorganic forms. In: A.L. Page (cd.), Methods of soil analysis. Part 2. Chemical and microbiologi- cal properties. Agron. 9643698. Amer. Sot. Agron., Madiin, Wii. MacDlarmId. B.N.. and B.R. W&In. 1972. The cattle duna oatch. 2.
Effect of a dung patch on the chemical status of the soil, and &no&a nitrogen losses from the patch. J. Brit. Grassl. Sot. 27:4w.
MacRay, D.C., and J.M. Cuefoot. 1981. Control of water content in laboratory determination of mineralixable nitrogen in soils. Soil Sci. Sot. Amer. J. 42444-446.
Neal, Jr., J.L. 1969. Inhibition of nitrifying bacteria by grass and forb root extracts. Can. J. Microbial. 15:633435.
Puton, W.J., and P.G. Riner. 1977. Nigrogen cycling in a true prairie. Bull. Ecol. Sot. Amer. 58:7.
Petmen, R.C., W.W. Woodbow+ Jr., and ILL. Locu. 19%. The distri- bution of excreta by freely graxing cattle and its cffcct on pasture fertility: II. Effect of returned cxcrcta on the residual concentration of some fertilimr elements. Agron. J. 48444-449.
Rke,
E.L.
1984. Allelopathy. 2nd ed. Academic Press, Inc., New York. BIdIcy, A.D., and R.A. Hedlln. 1968. Soil organic matter and crop yields asintluenced by the frequency of summerfallowing. Can. J. Soil Sci. 48:3lMU.
Selmltxer, M, and D.A. Hide. 1981. Effects of different methods of acid hydrolysis on the nitrogen distribution in two soils. Plant Soil 60237243. Sowden, F.J., Y. Cben, aed M. Schdtca. 1977. The nitrogen distribution
in soils formed under widely differing climatic conditions. Geochim. Cosmochim. Acta. 41:1524-1526.
Steel, R.G.D., and J.H. Torrie. 1989. Principles and procedures of statis- tics. A biometric approach. 2nd cd. McGraw-Hill Book Co., Toronto. Stevenson, FJ. 1962. NitrogcnGrganic forms. In: A.L. Page (HI.),
Methods of soil analysis. Part 2. Chemical and microbiological proper- tics. Agron. 9625641. Amer. Sot. Agron., Madison, Wii.
Stevemoo, F.J. 19%. Cycles of soil carbon, nitrogen, phosphorus, sulphur, micronutrients. John Wiiy & Sons Inc., New York.
TabatabaI. M.A.. and J.M. Bremner. 1972. Away of urease activity in soils. Soil Bioi. Bioehem. 41479487.
WBbus, W.D., S. Smolhk, and J.F. Dormaar. 1985. Effects of stocking rate on a Rough Fescue Grassland vegetation. J. Range Manage. 38220-225.
SRM Election Results
The Elections Committee, along with several other Colorado Section members, counted the ballots for new officers at the Society for Range Management headquarters. Elected officers are:
Second Vice President-John L. “‘Jack” Artx
Directors (1989-1991)-Murray L. Anderson and Will H. Blackbum
Directors Anderson and Blackbum will replace retiring Direc- tors Samuel and Sanders in February 1990.
The amendment to the Bylaws regarding Emeritus Membership was approved.
Ballots and tally sheets are retained in the Denver office for one year for review. Approximately 31% of the membership voted.