University of Windsor University of Windsor
Scholarship at UWindsor
Scholarship at UWindsor
Electronic Theses and Dissertations Theses, Dissertations, and Major Papers
2010
Heuristics for Cultural Algorithm Knowledge Driven Search in
Heuristics for Cultural Algorithm Knowledge Driven Search in
Dynamic Social Systems
Dynamic Social Systems
Viranthi Peiris
University of Windsor
Follow this and additional works at: https://scholar.uwindsor.ca/etd
Recommended Citation Recommended Citation
Peiris, Viranthi, "Heuristics for Cultural Algorithm Knowledge Driven Search in Dynamic Social Systems" (2010). Electronic Theses and Dissertations. 334.
https://scholar.uwindsor.ca/etd/334
HEURISTICS FOR CULTURAL ALGORITHM KNOWLEDGE DRIVEN
SEARCH IN DYNAMIC SOCIAL SYSTEMS
By
Viranthi R. Peiris
A Thesis
Submitted to the Faculty of Graduate Studies through Computer Science
in Partial Fulfillment of the Requirements for the Degree of Master of Science at the
University of Windsor
Windsor, Ontario, Canada 2009
HEURISTICS FOR CULTURAL ALGORITHM KNOWLEDGE DRIVEN SEARCH IN DYNAMIC SOCIAL SYSTEMS
by
Viranthi R. Peiris
APPROVED BY
M. Khalid, External Reader
Department of Electrical and Computer Engineering
R. Kent, Internal Reader School of Computer Science
Z. Kobti, Advisor School of Computer Science
S. Bandyopadhyay, Chair of Defense School of Computer Science
Author’s Declaration of Originality
I hereby certify that I am the sole author of this thesis and that no part of this thesis has been published or submitted for publication.
I certify that, to the best of my knowledge, my thesis does not infringe upon anyone’s copyright nor violate any proprietary rights and that any ideas, techniques, quotations, or any other material from the work of other people included in my thesis, published or otherwise, are fully acknowledged in accordance with the standard referencing practices. Furthermore, to the extent that I have included copyrighted material that surpasses the bounds of fair dealing within the meaning of the Canada Copyright Act, I certify that I have obtained a written permission from the copyright owner(s) to include such material(s) in my thesis and have included copies of such copyright clearances to my appendix.
ABSTRACT
Population evolution algorithms such as Cultural Algorithms (CA) enable a global repository known as the belief space consisting of common cultural traits or generalized schemas to influence the population space. Two important aspects of CA are the
knowledge and its propagation. Individuals in the population use social networks for communication. Knowledge representation is generally dependent on the application at hand. In this thesis the role of CA belief space knowledge in application neutral
simulation is explored. A standard benchmark function is used to study the performance of various heuristics on the quality of the belief space knowledge. The function captures the characteristics of a neutral world in static and dynamic settings. A multi-agent
DEDICATION
ACKNOWLEDGEMENTS
I would like to thank my advisor Dr. Kobti for his encouragement, guidance and immense help that enabled me to complete my research while juggling a new born and the thesis. Without his constant persistence, his innovative ideas, his own research and support throughout my entire M.Sc program I would not have been able to make this research a success. My sincere gratitude goes to Dr. Kent for his unconditional support and valuable advice. Also I would like to thank Dr. Khalid for his advice and support.
Table of Contents
Author’s Declaration of Originality ...iii
ABSTRACT...iv
DEDICATION...v
ACKNOWLEDGEMENTS...vi
List of Tables...ix
List of Figures...x
Chapter 1: Introduction...1
1.1 Problem Definition...1
1.2 Motivation...1
1.3 Thesis Statement...2
1.4 Thesis Contribution...2
1.5 Thesis Organization...3
Chapter 2: Literature Review/ Survey...4
2.1 Multi Agent Systems (MAS)...4
2.1.1 Applications of Multi-Agent Research...5
2.2 Social Complex Systems...6
2.2.1 Complex Systems...6
2.3 Social Networks ...7
2.4 Hill Climbing Algorithm...14
2.5 Evolutionary Algorithms...15
2.5.1 Ant Colony ...16
2.5.2 Genetic Algorithms (GA)...17
2.5.3 Particle Swarm ...19
2.5.4 Cultural Algorithm Framework...21
Chapter 3: Proposed Algorithms...24
3.1 Cones World Problem Generator [Morrison 1999]...24
3.2 Static Environment...26
3.3 Dynamic Environments...26
3.4 Strategy 1 (S1)- Hill Climbing Algorithm...27
3.5 Strategy 2 (S2) - Equal probability of Reputation for selecting a neighbour...28
3.6 Strategy 3 (S3) - Biased probability of Reputation for selecting a neighbour...29
3.7 Strategy 4 (S4) – S3 + Situational Knowledge of Cultural Algorithm...31
3.8 Strategy 5 (S5) - S4 + Mutation...34
3.9 Strategy 6 (S6) - Neighbours and Domain Knowledge of Cultural Algorithm...35
3.9.1 Domain Knowledge...37
3.10 Strategy 7 (S7) - Situational, Domain, Historical, and Topographical knowledge of Cultural Algorithm along with surrounding heights and the neighbours...38
3.10.2 Historical Knowledge...41
3.10.3 Topographic Knowledge...41
3.10.4 Domain Knowledge...41
3.10.5 Neighbours...41
3.10.6 Local area...41
3.11 Strategy 8 (S8) - Topographical Knowledge of Cultural Algorithm...42
3.12 Strategy 9 (S9) - Modified S8...45
3.13 Repast: The environment...48
3.13.1 Repast Setup:...48
3.13.2 Repast User Interface...50
3.13.3 Cones Model...51
3.13.4 Cones Space...52
3.13.5 Cones Agents...52
3.13.6 Statistics...52
Chapter 4: Experimental Setup...55
4.1 Static Environment – 10 cones and 20 agents ...56
4.2 Dynamic Environments – 10 cones and 20 agents ...63
4.3 Static and Dynamic Environments – 10 cones and 10 agents...67
4.4 Static and Dynamic Environments – 10 cones and 5 agents...68
4.5 Static and Dynamic Environments – 5 cones and 20 agents...70
4.6 Static and Dynamic Environments – 5 cones and 10 agents...71
4.7 Static and Dynamic Environments – 5 cones and 5 agents...72
Chapter 5: Discussion...73
5.1 Simulation Statistics...73
5.2 Statistical Results...79
Chapter 6: Conclusion and Future Work...81
6.1 Conclusion...81
6.2 Future Work...84
References...85
List of Tables
List of Figures
Figure 1: Pseudo code of Hill Climbing Algorithm ...15
Figure 2: Pseudo code of the basic Ant Colony Optimization [Maniezzo, 2000] ...17
Figure 3: Algorithmic steps for GA [Goldberg 1989]...18
Figure 4: PSO pseudo code [Kennedy 2001]...20
Figure 5: Cultural Algorithm Framework [Reynolds 2002]...21
Figure 6: Cultural Algorithm pseudo code from [Reynolds 2002] ...22
Figure 7: Formula for the base landscape [Peng, 2005]...24
Figure 8: Example of a three dimensional landscape generated by the df1 function. ...25
Figure 9: The surrounding heights of an agent...27
Figure 10: Pseudo code for strategy S1...28
Figure 11: Pseudo code for strategy S2...29
Figure 12: Number line showing how the biased probability is determined...30
Figure 13: Pseudo code for strategy S3...31
Figure 14: Pseudo code for strategy S4...34
Figure 15: Pseudo code for strategy S5...35
Figure 16: Pseudo code for strategy S6...37
Figure 17: Pseudo code for strategy S7...40
Figure 18: The surrounding heights of an agent...42
Figure 19: Pseudo code for strategy S8...45
Figure 20: Pseudo code for strategy S9...48
Figure 21: The main function routine...49
Figure 22: Repast tool bar...50
Figure 23: Cones Settings...51
Figure 24: Landscape with 5 cones...52
Figure 25: Scenarios of peaks...53
Figure 26: Number of steps taken to reach a peak...54
Figure 29: Strategy S2 – static - Equal Probability of Reputation for selecting a neighbour with 10 cones and 20 agents...57 Figure 30: Strategy S3 – static - Biased Probability of Reputation for selecting a
neighbour with 10 cones and 20 agents...58 Figure 31: Strategy S4 – static - Situational Knowledge of Cultural Algorithm with 10 cones and 20 agents...58 Figure 32: Strategy S5 – static - Situational Knowledge and Mutation with 10 cones and 20 agents...59 Figure 33: Strategy S6 – static- Neighbours and Domain Knowledge of Cultural
Figure 43: Shows the number of steps 20 agents are required to find the highest peak for strategies S6 – S9 in both static and dynamic environments with 5 and 10 cones
(neighbour size 50 pixels)...75 Figure 44: Shows the number of steps 10 agents are required to find the highest peak for strategies S6 – S9 in both static and dynamic environments with 5 and 10 cones
(neighbour size 50 pixels)...76 Figure 45: Shows the number of steps 5 agents are required to find the highest peak for strategies S6 – S9 in both static and dynamic environments with 5 and 10 cones
Chapter 1: Introduction
1.1 Problem Definition
To explore population based strategies in which individuals within a specified proximity are grouped into social networks where they communicate with one another to share required information to reach an optimum global in static and dynamic environments. Furthermore, evaluate the role of different knowledge types in Cultural Algorithms on population based strategies.
1.2 Motivation
Finding the global optimum faster is a very important problem in Artificial Intelligence. Evolutionary algorithms such as, Ant Colony Optimization (ACO), Particle Swarm Optimization (PSO), Cultural Algorithms (CA) and Genetic Algorithms(GA) are some of the algorithms that have been used to find the global optimum.
chapter 2.5.1.
With PSO [Eberhart, 1995] there is no guarantee that it will be able to find the global optimum since it is problem dependent. Similarly with GA there is no guarantee that it will be able to find the global optimum since this is also problem dependent and when it comes to our problem, GA will most likely find only suboptimal solutions. More information is given in Chapter 2.5.
CA enables population evolution over longer generation time, allowing faster convergence of the population. Knowledge plays an important role in Evolutionary Algorithms, particularly Cultural Algorithm. However, CA knowledge development is highly dependent on the application. Therefore an application neutral environment is required to evaluate the role of knowledge.
1.3 Thesis Statement
In this thesis we evaluate the role of different knowledge types in Cultural Algorithms. Using an application independent social simulation, one can isolate the role of each knowledge type in terms of its influence on the population's belief space observed by the population performance and convergence. The quest is to identify the extent to which each type of knowledge plays in goal optimization with the hypothesis that some types have more influence over others.
1.4 Thesis Contribution
benchmark function to capture the characteristics of a neutral world in static and dynamic settings was used. The following nine strategies were developed to find which strategy(s) has the best performance. The strategies implemented are briefly listed here:
Strategy 1 (S1) - Hill Climbing Algorithm.
Strategy 2 (S2) - Equal probability of Reputation for selecting a neighbour.
Strategy 3 (S3) - Biased probability of Reputation for selecting a neighbour.
Strategy 4 (S4) - S3 + Situational Knowledge of Cultural Algorithm.
Strategy 5 (S5) - S4 + Mutation.
Strategy 6 (S6) - Neighbours and Domain Knowledge of Cultural Algorithm.
Strategy 7 (S7) - Situational, Domain, Historical, and Topographical knowledge of
Cultural Algorithm along with surrounding heights and the neighbours.
Strategy 8 (S8) - Topographical Knowledge of Cultural Algorithm.
Strategy 9 (S9) - Modified S8.
The question in this research is how knowledge types play a role in Cultural Algorithms efficiency.
1.5 Thesis Organization
Chapter 2: Literature Review/ Survey
This chapter includes a short survey on Multi Agent Systems (MAS), complex social systems, social networks, Evolutionary Algorithms such as Ant Colony Optimization (ACO), Particle Swarm Optimization (PSO) , Cultural Algorithms (CA) and Genetic Algorithms (GA).
2.1 Multi Agent Systems (MAS)
Recently there has been a growing interest in agent based systems technology in artificial intelligence research because it has been hailed as a new paradigm for conceptualizing, designing and implementing software systems [Sycara, 1998]. Agents are active, persistent (software) components that perceive, act, reason and communicate in environments that are distributed and open to solve many complex problems. There are many agent based systems which consists of only a single agent. Due to the increased technological complexity, the need for complex applications have risen that require systems consisting of multiple agents who can communicate in a peer to peer fashion.
A Multi Agent System consists of many autonomous agents such as software programs or robots who interact with each other to perform a set of tasks or to achieve a set of goals.
communicate with each other to find out the tasks other agents are able to perform. The middleware services are provided by an agent's Information Communication Technology (ICT) environment, which is often called the MAS platform, where the agents are embedded. Some examples of middleware services are, data storage, message transport, and service discovery. Replacing these services with agent equivalents may cause some disadvantages such as overhead in message invocation and less robust service designs. Also agents not only should be able to communicate with other agents but also should be able to invoke non agent software services. Sometimes agents not only interact locally within their own platform but also interact with remote agents in other platforms. In the future there would be many heterogeneous MASs.
MASs are used to develop complex, large or unpredictable systems as they are mainly developed in a modularized manner. The modular components (agents) will use the most appropriate paradigm to solve a particular problem. When interdependent problems arise, the agents would communicate and coordinate with one another to ensure that interdependencies are handled appropriately.
Most of the distributed computation problems involve open and dynamic environments. In an open system the structure of the system itself is capable of dynamically changing [Katia Sycara, 1998]. In such a system an agent alone is not able to solve the entire problem due to certain constraints, incompetency in performing certain tasks, inaccessibility to critical data, etc. Therefore open systems require MAS.
2.1.1 Applications of Multi-Agent Research
2.2 Social Complex Systems
2.2.1 Complex Systems
A “complex system is a system for which it is difficult, if not impossible to restrict its description to a limited number of parameters or characterising variables without losing its essential global functional properties” [Pavard].
A complex system consists of parts that interact in a non-linear fashion within the environment and their behaviours are non-predictable, emergence also is an essential property. It is important to differentiate between a complicated system such as a computer or a plane and a complex system such as economic systems or ecological systems. Complicated systems contain many functionally distinct parts which are predictable . But in complex systems the parts interact non-linearly within their environment, and their components have properties of self organization which make them non-predictable. In addition, complex systems are completely irreducible. This means that it is impossible to derive a model from this system without losing all its relevant properties.
Recently there has been a growing interest in applying complex system approaches to social systems [Eve et al 1997, McKelvey 1997, McKelvey 1999, Goldspink 1999 and Marion 1999]. Many social systems are modelled using simple agents [Epstein and Axtell 1996]. Therefore Social Complex Systems consists of many individuals (autonomous agents) who interact non-linearly within the environment and their behaviour is unpredictable .
Some of the characteristics of Social Complex Systems are:
Non-determinism and non-tractability [Pavard] –
Agent based -
Systems comprise of many agents.
Dynamic -
Some parts of the system may change, as the agents adapt to their environment. The behaviour of the agents change since they are unpredictable and they learn from their experiences. The dynamics of these systems are usually non-linear sometimes even chaotic. Also the systems are rarely stabilized.
Organization -
Most of the time the agents are categorized into groups. These groups are mostly structured and will influence how the system evolves over time.
Distributed nature of information and representation [Pavard]-
A complex system possesses properties comparable to distributed systems (in the connectionist sense), example: some of its functions cannot be precisely localised. In addition, the relationships that exist within the elements of a complex system are short-range, non-linear and contain positive and negative feedback loops.
Emergence and self-organization [Pavard] -
This is the process of deriving some new and coherent structures, patterns and properties of the system due to non-linear and distributed interactions between agents of the system. They are observed at a macro level even though they are generated in the micro level.
2.3 Social Networks
friendship or co-working. By analysing the social networks, one can find out different categories of relationships that occur between people, organizations and groups etc. People are represented as nodes in the network and relationships among the people are represented as edges. Also the structure of the network can contain many sub structures such as, groups and cliques. By analysing these substructures we can find out the likely behaviour of the network as a whole.
The term social network was first coined by J.A Barnes in 1954. Since then a lot of work has been carried out in social science fields such as, anthropology, sociology and social psychology.
With the rapid growth of Internet many cyber social networks have emerged recur to social network software and social network websites [Zhao, 2006]. Cyber social networks have virtual relationships, but reflect some common law of real world social relationships. The most popular Internet social network is Friendster which is a network of virtual friends.
Then there is a fairly new phenomenon called Social Networking Services (SNSs) [Ahn, 2007]which enable individuals and tools to communicate with people by providing private space for them. Also they help people to find others who have common interests, to create forums for discussions, to exchange photographs and personal news. The social networks of SNSs most of the time accurately reflect the real life social relationships of people than any other online networks. Also because of their size it gives a good opportunity to study human social networks.
Online SNSs –
Social Networking Services enable users to share personal information such as, hobbies, photographs, birthdays, etc. Most SNSs offer features that will help users to form and maintain online networks with other users. One such feature is called a “friend”. A user can invite another user to be one’s friend. Then if the invited user accepts the invitation then a friend relationship is established between them.
The following gives a brief description about the three SNSs:
Cyworld –
This is the oldest and largest online social networking service in South Korea. Cyworld was started in September 2001 and has been growing ever since. This consisted about 12 million registered users in November 2005. Cyworld users can establish, maintain and can dissolve a friend relationship online.
MySpace –
friends’ pages, their friends’ pages so on.
Orkut –
This was initially started in September 2002, by some Google employees and became an official Google service in January 2004. Till recently one could create an account only if one was invited by an existing user, which is different from Cyworld and MySpace. Ever since it allowed a user to create an account without an invitation it expanded greatly. Today it consists of more than 33 million users. When a user joins Orkut, the user can publish one’s profile, join other communities and upload photographs. This also offers friend relationships.
What influence individuals to join particular communities, which communities grow rapidly and how the communities evolve over time? Are some of the questions that are addressed in [Backstrom, 2006]. The probability of an individual joining a community depends on the following:
1. The number of friends one has in the community. 2. Activity level of a community.
3. Friendship level of one’s friends in the community (Connectedness).
The probability of an individual joining a community is higher when that individual’s friends in the community are connected.
The members of a social network fall into three categories [Kumar, 2006]. They are,
Singletons –
Singletons are users who are loners. Those who have never made any connections with others and are very inactive in the network.
Giant component –
are either indirectly or directly connected to the large potion of the entire network.
Middle region –
Middle region consists of isolated communities who have created small groups and communicate with each other.
Then there are sub groups and sub structures in social networks [Jamali, 2006]. Members who have similar interests, or who are in the same age, race, ethnicity, gender, religion may form cliques or sub groups to share information among each other.
Even the web can be considered as a social network [Jamali, 2006]. These Social networks are formed by hyper- linking web pages to other web pages. Creating communities is one of the important activities in a web. Bibliographic metrics and Bipartite Cores are two approaches which are used to identify communities in a link topology.
each other are given below. There are two algorithms. They are:
• Rounding Algorithm –
In this algorithm the users will assign {0,1} ratings to all the neighbours, and in every step of the algorithm a node will return {0,1} values. Then the source polls the neighbours who have got positive ratings (1) and the others (0) are ignored. Each neighbour will return their ratings for the sink. The source will then find the average of these ratings and will round the final value. This rounded value is the reputation rating from source to sink.
• Nonrounding algorithm –
In this algorithm the nodes do not round the values before they return the values. At the end of the algorithm the original source will round the average of the values returned by the neighbours. Therefore the final inferred value will be 0 or 1.
After analysing the above mentioned algorithms the authors have come up with the following results.
• In the rounding algorithm the accuracy at each step increased.
• Rounding algorithm will out perform the nonrounding algorithm.
• Algorithms will be more effective on larger networks with higher average degrees.
Nowadays it is almost impossible to do one’s work without email. But when a lot of spam and junk mails are received it is a very tedious task to find the important emails. Therefore the authors have introduced the TrustMail prototype to filter out the unwanted messages.
This is an email client that adds trust ratings to each message in the folder. Therefore a user can read the trust rating and can sort the messages accordingly. The users highly benefit from this because users do not have to open unwanted junk mail to find whether they are from trusted parties or not. This program extracts the sender and uses trust algorithms to find out whether the person can be trusted or not.
According to [Goecks, 2004] current user applications and end user applications in social networks provide very limited support such as, current applications mostly do not allow the users to manage and to be aware how their information is transferred to the other users. Therefore lots of users have privacy concerns because they do not know who has access to their information and information dissemination was a hassle. This brings to the fact that there is a need for an infrastructure that enables users to manage and control information sharing. Therefore the authors built Saori to solve this problem. Saori is a computational infrastructure that enables users and applications to manage and control information dissemination within social networks. All information dissemination occurs along ties between individuals who are connected to the social network. Users can leverage their personal networks and the extended networks to share information. Saori maintains an information database that can be shared. It presumes that the information is in the form of a pointer or a url and each instance of information is owned. Saori has two policies. They are Level of Detail (LoD) and Word of Mouth (WoM). To enforce these policies Saori must be able to access users’ social networks and attributes. Also maintains a database of this information, by mining users’ email messages. Saori obtains user attributes and personal social networks and stores these in the database.
The author has been an active participant with Friendster users and also an active observer with the social networking software creators.
The following are some social networks
Yahoo! – Flickr – [Kumar, 2006]
Flickr is a popular and an active network. It was launched in Feb 2004. This allows the users to Upload photographs and share them with their friends. A Flickr user can invite a friend to join the network or can add an existing user as a friend. According to Jan 2006 data the Flickr time graph consisted about one million nodes and eight million directed edges.
Yahoo! 360 – [Kumar, 2006]
Yahoo! 360 is a part of the Yahoo! User network. This is a social networking website. This is mainly used to create and to share albums, photographs among friends. Users can add contacts and invite others to join the network. According to the Jan 2006 time graph Yahoo! 360 had about five million nodes and about seven million directed edges.
2.4 Hill Climbing Algorithm
Hill Climbing is a mathematical optimization technique which falls into the family of local search [Wikipedia, 2006]. Hill Climbing algorithm begins with an initial solution which is usually chosen at random. The string is then mutated, and if the mutation gives a higher fitness for the new solution than the previous solution, then that solution will be used at the next iteration. This process is repeated till a higher fitness is not found [Marczyk, 2004]. Usually the current solution is close to the optimal solution, but cannot guarantee that it will always be close to the optimal solution. This algorithm is widely used in Artificial Intelligence for reaching a goal state from a starting node.
Example [Marczyk, 2004]:
landscape represents one particular solution. Those solutions that are better are higher in altitude, forming hills and peaks; those that are worse are lower in altitude, forming valleys. A "hill-climber" is then an algorithm that starts out at a given point on the landscape and moves inexorably uphill.) Hill-climbing is what is known as a greedy algorithm, meaning it always makes the best choice available at each step in the hope that the overall best result can be achieved this way.
Pseudo codeof the hill climbing algorithmis given in figure 1.
1 Each agent will check the surrounding height
2 If surrounding height > current height then
3 Move agent to the surrounding height.
4 Else
5 If surrounding height = current height then
6 Move agent randomly by one step within the allowed x, y cones space range.
7 Else
8 Agent remains at the current position
9 Repeat till surrounding height <= current height.
Figure 1: Pseudo code of Hill Climbing Algorithm
2.5 Evolutionary Algorithms
2.5.1 Ant Colony
Ant Colony Optimization (ACO) takes inspiration from the foraging behaviour of ants [Dorigo 2006]. Ants deposit a chemical substance called pheromone on the path when walking to and from a food source. Other ants sense the presence of pheromone and tend to follow a trail that is rich in pheromone. Thus they are able to find the shortest path from a food source to the nest. Also ants are capable of adapting to changes in the environment. For example being able to find a new shortest path when the old path is no longer feasible due to obstacles.
In the Ant Colony Optimization Algorithms proposed by Dorigo [2006] the ants are defined as computational agents, which iteratively build solutions to an optimization problem. ACO has been applied to optimization problems in areas such as asymmetric and symmetric travelling salesman problem, scheduling, routing and partitioning problems.
In [Peng, 2005] Each ant will move from a state ι to another one ψ corresponding to a more complete solution. Each agent at each step will compute a set of feasible expansions to its current state by using the following probability distribution,
α. τ ι ψ + (1- α). η ι ψ
∑ (τ ι v) + (1 – α). η ι v if ι ψ ∈ tabuk ∉ tabuk ρk ι ψ =
0, otherwise
Will move to the new position only if it is better than the previous step. tabuk represents a
set of feasible moves for an agent k. Parameter α defines the relative importance of the trail. Then after each iteration t of the algorithm, the trails are updated by the following formula,
ρ is a user defined co-efficient and Δ τ ι ψ represents the sum of the contributions of all agents that used the move ι ψ to find the next position.
The pseudo code from [Maniezzo, 2000] describes how the basic Ant Colony optimization works.
1. (initialization)
initialize τ ι ψ, ∀ ι, ψ 2. (construction)
for each ant k do repeat
compute η ι ψ, ∀ ι, ψ
choose in probability the state to move into
append the chosen move to the kth ant 's set tabuk
until ant k has completed its solution [apply a local optimization procedure] end do
3. (Trail update)
For each ant move (ι, ψ) do
compute Δ τ ι ψ and update the trail values 4. (Terminating condition)
If not (end condition) and go to step 2.
Figure 2: Pseudo code of the basic Ant Colony Optimization [Maniezzo, 2000]
2.5.2 Genetic Algorithms (GA)
fittest solutions. Most of these functions are stochastic so that only a small proportion of less fit solutions would be selected. This is done to keep the diversity of the population large and to avoid premature convergence on poor solutions. Then would test the selected solutions to find whether the optimal solution is found. If not found then would apply recombination and mutation to breed the next generation (new solutions). Generally the average fitness would have increased in this generation since only the best solutions (parents) are selected for recombination and mutation. This process will be repeated till the optimal solution is found or till a fixed number of generations have been reached or successively better solutions have not been found.
Figure 3 gives the basic algorithmic steps presented by Goldberg [Goldberg 1989].
1 t = 0;
2 initialize P(t)
3 evaluate structures in P(t) 4 repeat
5 t = t + 1
6 select_reproduction C(t) from P(t-1)
7 recombine and mutate structures in C(t) forming C'(t); 8 evaluate_structures in C'(t)
9 select_replace P(t) from C'(t) and P(t+1); 10Until (termination condition satisfied)
Figure 3: Algorithmic steps for GA [Goldberg 1989]
individuals from C'(t) and P(t-1). This process would be repeated till the termination condition is satisfied.
Cannot guarantee that GA s are able to produce optimal solutions because of its evolutionary nature. For example:
Requirement is to find the highest peak of a given landscape. The algorithm will prefer solutions that lie on a peak. The individuals will generate solutions and at each iteration the best solutions will be kept and mutated expecting better solutions and the rest will be eliminated. Once the individuals have reached either the same peak or different peaks the solution with the highest value will be selected assuming that is the highest peak. But there can be another higher peak which has not been found by any of the individuals since when they reach a peak, the surrounding area is not higher so they will stop exploring the landscape. Therefore the solution that was thought as the optimal is actually only a sub optimal solution.
2.5.3 Particle Swarm
When compared with genetic search, Particle Swarm Optimization (PSO) is a relatively recent optimization technique of the swarm intelligence paradigm [Windisch, 2007]. PSO is a population based optimization technique [Eberhart, 1995], inspired by the behaviour of schools of fish, herds of animals or flocks of birds. Particle Swarm Optimization is somewhat similar to genetic algorithms because both of them are population based. In PSO the system is initialized with a population of random solutions called particles. These particles move through the problem space in search of the global minima or maxima. Each particle keeps track of its past best performance/ fitness and its neighbours (specified proximity radius) best performance to decide on its next move. Also the swarm is aware of the global best achieved by all the particles. At each iteration the particles will update its velocity and position by using the following (a) and (b) equations.
v[] = v[] + c1 * rand() * (pbest[] - present[] ) + c2 * rand() * (gbest[] - present[]) (a)
v[] is the agent's velocity, present[] is the current position of the agent and rand() is a random number between 0 and 1. C1 and C2 are the learning factors and usually c1 = c2 = 2. The previous best position of particle i is denoted by pBesti and the previous global best is denoted by gBest.
The pseudo code of the initial version of PSO for real valued variables is given in [Kennedy 2001] as follows,
1 For each particle 2 initialize particle 3 End For
4 Do
5 For each particle
6 calculate fitness value
7 if the fitness value is better than the best fitness value (pBest) in history 8 set the current value as the new pBest
9 End
10 Choose the particle with the best fitness value of all the particles as the gBest 11 For each particle
12 calculate particle velocity according to equation (a) 13 update particle position according to equation (b)
14 End
15While maximum iterations or minimum error criteria is not attained.
Figure 4: PSO pseudo code [Kennedy 2001]
and performance is problem dependent.
2.5.4 Cultural Algorithm Framework
The Cultural Algorithm (CA) is a class of computational models derived by observing the cultural evolution process in nature [Reynolds 1978, 1994]. The Cultural Algorithm consists of three major components which are population space, belief space and a communication protocol that describes how knowledge is exchanged between population space and belief space [Reynolds, 2005]. The knowledge that is generated in the population space is selectively passed to the belief space which is a global knowledge repository which will influence the changes made by the next generation in the population space. Each individual in the population space has access to the knowledge that is in the belief space, therefore as these individuals evolve to achieve a goal the knowledge is modified and passed to the belief space. Cultural algorithms are mainly designed to model the society including humans. But it is equivalently applicable to non social search problems such as, Constraint Satisfaction or optimization problems. Following diagram shows the basic CA framework.
Figure 5: Cultural Algorithm Framework [Reynolds 2002]
some of the knowledge that is generated in the population space. In Cultural Algorithms evolution happens both in the population space and belief space through communication. As the population in the population space evolves the belief space will be updated accordingly by the acceptance function and the knowledge in the belief space will influence the agents in the population space. The Reproduction function will generate the new generation and the modify function causes mutation or changes to the new generation. The performance function will identify the optimal state of the system.
The CA pseudo code presented by Reynolds [Reynolds 2002] is given in the figure 6.
1Begin
2 t = 0;
3 Initialize Population POP(t); 4 Initialize Belief Space BLF(t);
5 repeat
6 Evaluate Population POP(t);
7 Adjust (BLF(t), Accept(POP(t)));
8 Adjust (BLF (t));
9 Variation(POP (t) from POP (t-1)); 10 until termination condition achieved 11End
Figure 6: Cultural Algorithm pseudo code from [Reynolds 2002]
The Cultural Algorithm is a population based algorithm just like Ant Colony Optimization (ACO) and Particle Swarm Optimization (PSO), but unlike ACO and PSO, Cultural Algorithm uses five basic knowledge models in the problem solving process. They are,
Situational Knowledge: Situational knowledge was proposed by [Chung, 1997] for real valued function optimization problem solving in static environments. This contains knowledge of exemplars.
Normative Knowledge: Defines a set of standards within which maximum fitness is expected.
environmental patterns can be identified.
Domain Knowledge: This was introduced into CA by Reynolds and Saleem in [Reynolds, 2005] in order to solve dynamic optimization problems. This is generated from the problem domain to predict trends in the resource landscape.
Historic Knowledge: This was also introduced into CA by Reynolds and Saleem in [Reynolds, 2005] in order to find about global dynamics and to be able to backtrack when necessary. While domain knowledge provides information about local changes in terms of geometrical or gradient considerations, historic knowledge provides a more global perspective of the changes.
Chapter 3: Proposed Algorithms
We have incrementally developed a number of strategies of increasing complexity that can be applied on an application neutral system which contains static/dynamic environments which are inspired from a standard benchmark function the Cones World Problem Generator.
3.1 Cones World Problem Generator [Morrison 1999]
This was originally developed by De Jong and Morrison [Morrison 1999]. They called it DF1. It is a standard and a rigorous test function generator that is used to study the performance of evolutionary algorithms in changing environments [Peng 2005]. It is capable of providing instances of a wide variety of dynamic landscapes.
The cones world generates a multi dimensional problem landscape in which resource cones of different heights and slopes would be scattered. This would be carried out in two steps.
Step1:
Specify a baseline static landscape of the desired complexity. The base landscape will be generated according to the following formula,
Figure 7: Formula for the base landscape [Peng, 2005]
Where,
K : The number of cones
n: dimensionality
Hj: Height of cone j
Cj,i: coordinate of cone j in dimension i
The values for each cone (Hj, Rj and Cji) are randomly assigned based on user specified
ranges.
Hjϵ (Hbase, Hbase + Hrange)
Rjϵ (Rbase, Rbase + Rrange) and
Cji ϵ (-1, 1)
Each of these independently specified cones are blended together using the max function. If two cones overlap then the height at a point is the height of the cone that has the highest value at that point. [Peng, 2005]
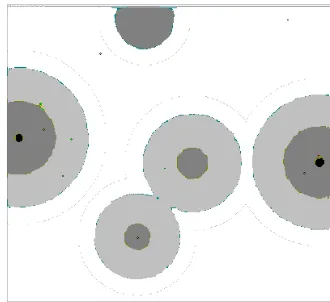
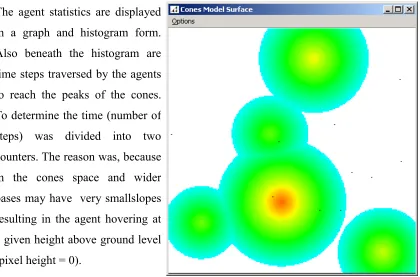
For this thesis a three dimensional landscape was used in which K = 5, Hbase = 3, Hrange = 3, Rbase = 10 and Rrange = 2. Example of a cones world environment is given in figure 8.
Figure 8: Example of a three dimensional landscape generated by the df1 function.
x ϵ (-1, 1) , y ϵ (-1, 1), with n = 2, H ϵ (3, 6) and R ϵ (10, 12)
Step2:
Specify the dynamics. Dimension Cj,i , height Hj and slope Rj of every cone j can be
Yi = A * Yi-1 * (1-Yi-1)
A is a constant and Yi is the value at iteration i
The generator will randomly generate cones each time it is called. Cones World Problem Generator was selected because it is able to generate test functions over a wide range of surface complexities and problem dynamics. Also it is able to evaluate the system in a more flexible and a systematic way.
3.2 Static Environment
In the static environment, once the cones are randomly generated they remain in that position. The cones do not move.
3.3 Dynamic Environments
Initially just like the static environment cones will be deployed on the landscape. Then after hundred and fifty steps the cones will be moved to different locations. Then after the next hundred and fifty steps (three hundred steps) not only the cones will be moved but also the heights of all the cones will be changed. This will be repeated till number of steps are six hundred. There are four different dynamic environments. When the environment changes the agents will start exploring from where they stopped.
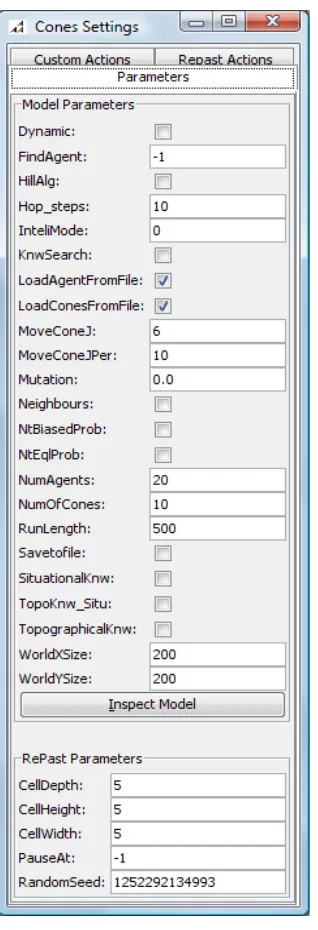
The user is able to select or enter the following for the nine strategies.
Particular strategy.
Number of cones.
Number of agents.
Static/ dynamic environment.
Number of pixels for a step (step size).
3.4 Strategy 1 (S1)- Hill Climbing Algorithm.
Implemented the Hill Climbing Algorithm. Once an agent is randomly placed on the landscape, the agent's current and surrounding pixel heights are passed to the algorithm as shown in figure 9. Note that the agent is at H11.
The three basic rules for the heuristic algorithm are as follows:
1) Move the agent to the surrounding pixel with the highest height, higher than its current height.
2) If there are any surrounding pixels with height equal to its current height H11, then the
agent is randomly moved by one pixel within the allowed x and y cones space range.
3) Otherwise the agent remains at the current position.
These rules are repeated all the way to the top of the peak where the agent is located. If the peak is a plateau rather than a point (single pixel), then the agent will randomly wonder along the plateau at the same height in search of a higher pixel.
Figure 9: The surrounding heights of an agent.
H
00 H01 H02
H10 H11 H12
The pseudo-code for strategy S1 is given in figure 10.
1 Each agent will check the surrounding height
2 If surrounding height > current height then
3 Move agent to the surrounding height.
4 Else
5 If surrounding height = current height then
6 Move agent randomly by one step within the allowed x, y cones space range.
7 Else
8 Agent remains at the current position
9 Repeat till surrounding height <= current height.
Figure 10: Pseudo code for strategy S1.
3.5 Strategy 2 (S2) - Equal probability of
Reputation for selecting a neighbour.
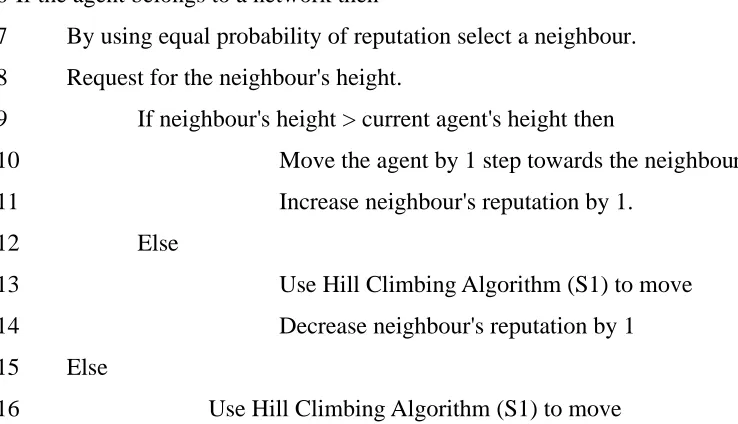
The agents who are within fifty pixels apart are grouped into networks. Initially all the agents reputation will be zero. Then each agent by using equal probability (50/50 probability of picking any neighbour) will pick a neighbour and will request for its height. If the height is greater than itself then will move one step towards the neighbour's location and increase the neighbour's reputation by one. Otherwise the agent will use hill climbing algorithm to decide on the next move and decrease the neighbour's reputation by one. If an agent does not have any neighbours then it will use hill climbing algorithm to decide on its next move. The pseudo code is given in figure 11.
1 For each agent, check within 50 pixels for another agent
2 If there is an agent within 50 pixels apart then
3 Add that agent to the current agent's network
4 End For
6 If the agent belongs to a network then
7 By using equal probability of reputation select a neighbour.
8 Request for the neighbour's height.
9 If neighbour's height > current agent's height then
10 Move the agent by 1 step towards the neighbour.
11 Increase neighbour's reputation by 1.
12 Else
13 Use Hill Climbing Algorithm (S1) to move
14 Decrease neighbour's reputation by 1
15 Else
16 Use Hill Climbing Algorithm (S1) to move
17 Repeat till user selects stop or till the number of iterations = number of iterations given
in the user settings menu.
Figure 11: Pseudo code for strategy S2.
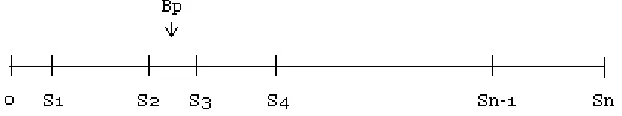
3.6 Strategy 3 (S3) - Biased probability
of Reputation for selecting a
neighbour.
will request for its height. If the height is greater than itself then it will move one step towards the neighbour's location and increase the neighbour's reputation by one. Otherwise, will use hill climbing algorithm to decide on the next move and decrease that neighbour's reputation by one. If an agent does not have any neighbours then it will use hill climbing algorithm to decide on its next move.
Figure 12: Number line showing how the biased probability is determined
The pseudo code is given in figure 13.
1 For each agent, check within 50 pixels for another agent 2 If there is an agent within 50 pixels apart then
3 Add that agent to the current agent's network 4 End For
5 For Number of iterations 1 – 5 do 6 Strategy S2
7 End For
8 For Number of iterations 6 - till user selects stop or till the number of iterations = number of iterations given in the user settings menu
9 Calculate the sum of reputations of all the neighbours 10Store the first neighbour's reputation and id in an array
11Then add the next neighbour's reputation to the previous neighbour's reputation and store that value in the same array.
reputation.
13BiasedRep = ceiling (Rand * sum of reputations of all the neighbours) 14Check whether BiasedRep is less than or equal to any value in the array. 15Then get the id of the first value that is greater than or equal to it. 16The agent who has that id is this agent's neighbour.
17 Request for the neighbour's height.
18 If neighbour's height > current agent's height then
19 Move the agent by 1 step towards the neighbour.
20 Increase neighbour's reputation by 1.
21 Else
22 Use Hill Climbing Algorithm (S1) to move
23 Decrease neighbour's reputation by 1
24 Else
25 Use Hill Climbing Algorithm (S1) to move
26End For
Figure 13: Pseudo code for strategy S3
3.7 Strategy 4 (S4) – S3 +
Situational Knowledge of Cultural
Algorithm.
will be decreased by one and will select another agent based on biased probability of reputation from the neighbourhood. If the agent (A ) decides to pick a neighbour from the neighbourhood the agent will perform strategy S3 as described in the previous section. The pseudo code is given in figure 14.
1 Nth Iteration = false (Nth Iteration = 10)
2 For Number of iterations 1 – till the user selects stop or number of iterations = number of iterations given in the user settings menu do
3 If Number of iterations mod 10 = 0 then 4 Nth Iteration = true
5 Else
6 Nth Iteration = false 7 If Nth Iteration = true then
8 Evaluate all the agents reputations
9 Select the top 10% agents based on their reputations and store their id, x,y and z coordinates in the belief space.(Global repository)
10 Randomly pick a neighbour or the belief space.
11 If belief space is selected then
12 By using Biased probability of reputation select an agent
from the belief space.
13 If selected agent's height > current agent's height then
14 Move the agent by 1 step towards the neighbour.
15 Increase selected agent's reputation by 1.
16 Else
17 Decrease selected agent's reputation by 1.
18 By using Biased probability of reputation select an
agent from the network.
19 If no neighbours then
20 Do Strategy S1
21 Else
23 If neighbour's height > current agent's height then
24 Move the agent by 1 step
towards the neighbour.
25 Increase neighbour's
reputation by 1.
26 Else
27 Use Hill Climbing Algorithm
(S1) to move
28 Decrease neighbour's
reputation by 1
29 Else
30 By using Biased probability of reputation select an agent from the network.
31 If no neighbours then
32 Do Strategy S1
33 Else
34 Request for the neighbour's height.
35 If neighbour's height > current agent's
36 height then
Move the agent by 1 step towards the
37 neighbour.
38 Increase neighbour's
reputation by 1.
39 Else
40 Use Hill Climbing Algorithm
(S1) to move
41 Decrease neighbour's
reputation by 1
43 If Number of iterations 1 – 10 then
44 Do Strategy S3
45 Else
46 Follow the selected agent till the next Nth Iteration 47 Increase Number of iterations by 1.
Figure 14: Pseudo code for strategy S4
3.8 Strategy 5 (S5) - S4 + Mutation.
The user is given a choice whether to mutate an agent or not. If the user decides to mutate the agents, then the user can enter a mutation probability in the Mutation field of the Parameter settings. If the user decides not to mutate agents then zero should be entered.
Once a mutation probability (ex: 0.05) is entered, every ten iterations a random number between 0 to 100 is generated and if it falls between 0 to 5 (0.05 * 100), the agent will be mutated for the next ten iterations. As soon as the agent is mutated, random x-y coordinates will be generated to which the agent will travel towards. The agent will travel to its destination and while doing so will share and gather information with encountered neighbours along the way. If the destination x-y is reached prior to the expiration of the ten iterations the agent will remain at its destination until the time expires. If the random number is not within 0 and 5, that agent will not be mutated and will use S4 strategy as described in the previous section. The pseudo code is given in figure 15.
1 Nth Iteration = false
2 AmIMutated = false
3 For Number of iterations 1 – till the user selects stop or number of iterations = number
of iterations given in the user settings menu do
4 If Number of iterations mod 10 = 0 then
5 Nth Iteration = true
7 Nth Iteration = false
8 If Nth Iteration = true then
9 If Mutation > 0 then
10 Get the mutation probability from the user settings menu.
11 Random number generator will generate a number
12 If that number*100 < user entered probability * 100 then
13 Agent is mutated
14 Else
15 Agent is not mutated
16 If agent is mutated then
17 x,y coordinates will be randomly generated
18 Agent will move by 1 step towards x,y
19 AmIMutated is set to true
20 Else
21 Do all the steps after “If Nth Iteration = true
22 then” in strategy S4
23 Else
24 Do all the steps after “If Nth Iteration = true
25 then” in strategy S4
26 Else
27 Follow the selected agent till the next Nth Iteration.
28 Increase number of iterations by 1.
Figure 15: Pseudo code for strategy S5
3.9 Strategy 6 (S6) - Neighbours and
Domain Knowledge of Cultural
Algorithm.
pixels) denoted as MyMap. This is to reflect a miniature outline of the landscape forming 200 x 200 pixels. Each cell in MyMap is initialized with -1 and does not contain any cones.
At each step all the agents will check within 50 pixels apart for neighbours. If neighbours are found the agent will retrieve their maps and update it's own map. With the updated map the agent will select the closest location none of its neighbours have been (i.e. by determining the closest initialized value of -1) and travel toward it. On its way if the agent comes across a cone it will calculate the peak of the cone without climbing it and also will check for neighbours within 50 pixels and update it's map. At the end of each update of MyMap the agent checks if it's map is complete (i.e. no more -1s). With a complete map, the agent will find the highest height and travel to the location. The pseudo code is given in figure 16.
1If (myMap is not complete) then
2 Get my height
3 If (has reached destination) or (No of steps >= 0) then
4 Store my height in the relevant x and y coordinates in myMap. 5 Get neighbours who are within 50 pixels.
6 If (no of neighbours >= 1) then
7 Get the neighbours maps.
8 Update myMap.
9 Out of all the -1's in myMap, the random number generator will select the closest x and y coordinate.
10 Move agent by 1 step towards the selected location. 11 Clear has reached destination flag.
12 If (my height = 0) then
13 Calculate Domain knowledge
14 Move agent by 1 step towards the selected location.
15 Out of all the -1's in myMap, the random number generator will select the closest x and y coordinate.
16 Store my height in the relevant x and y coordinates in myMap.
18 Calculate Domain knowledge
19 Move agent by 1 step towards the selected location.
20 Out of all the -1's in myMap, the random number generator will select the closest x and y coordinate.
21 Store my height in the relevant x and y coordinates in myMap. 22 Check whether myMap is complete.
23 If (myMap is complete) then
24 myMap complete flag = true.
25 Find the highest height in myMap.
26 Take 1 step towards the location of the highest height.
Figure 16: Pseudo code for strategy S6
3.9.1 Domain Knowledge
This strategy involves the agent estimating the peak of the cone without climbing to the top of the cone. First the agent finds an edge of the cone. This point is marked as A. Then the agent travels 20 steps along the edge of the cone to point B and will save each point along the way into an array. With the coordinates of point A and B the radius can be calculated using the formula below.
Where:
H above is the distance between the middle point in the array and the middle point between A and B.
Once the radius is calculated the agent travels a few steps towards the centre of the cone just enough to determine the slope of the cone. Finally the height of the cone is calculated as shown in the formula below.
3.10 Strategy 7 (S7) - Situational, Domain,
Historical, and Topographical knowledge of
Cultural Algorithm along with surrounding
heights and the neighbours.
neighbours. Once an agent has reached the selected destination it will check the above mentioned knowledge sources, neighbours and the local area and will select the closest location that none of its neighbour's have been nor a location given by the above mentioned knowledge sources. Once all the agents have taken a step, Situational knowledge, Topographic knowledge and Historical knowledge sources are updated. Also the agent's map is checked to determine if all the values in the myMap are filled. If it is, then will search for the highest value in myMap, and will update the Situational knowledge with the highest value and will set myMap complete flag to true. Then all the agents will travel to this location. The pseudo code is given in figure 17.
1If (myMap is not complete) then 2 Get my history list.
3 Get my height.
4 If (has reached destination) or (No of steps >= 0) then
5 Store my height in the relevant x and y coordinates in myMap 6 Get neighbours who are within 50 pixels.
7 If (no of neighbours >= 1) then
8 Get the neighbours maps.
9 Update myMap.
10 Check the local area.
11 If (No of steps >= 1) then
12 update myMap with topographic knowledge.
13 Check Historical knowledge.
14 Update myMap with the surrounding values, situational knowledge and historical knowledge.
15 Out of all the -1's in myMap, the random number generator will select a particular x and y coordinate.
16 Move agent by 1 step towards the selected location. 17 Store the historical values in the history list
18 Store my height in the relevant x and y coordinates in myMap. 19 Clear has reached destination flag.
21 Calculate Domain knowledge
22 Out of all the -1's in myMap, the random number generator will select a particular x and y coordinate.
23 Move agent by 1 step towards the selected location.
24 Update myMap with the surrounding values, situational knowledge and historical knowledge.
25 Store the historical values in the history list
26 Store my height in the relevant x and y coordinates in myMap
27 else
28 Calculate Domain knowledge.
29 Out of all the -1's in myMap, the random number generator will select a particular x and y coordinate.
30 Move agent by 1 step towards the selected location.
31 Update myMap with the surrounding values, situational knowledge and historical knowledge.
32 Store the historical values in the history list
33 Store my height in the relevant x and y coordinates in myMap 34 Check whether myMap is complete.
35 If (myMap is complete) then
36 myMap complete flag = true.
37 Find the highest height in myMap.
38 Update situational knowledge.
39 else
40 Take 1 step towards the location of the highest height.
After all the agents have taken a step the knowledge sources will be updated.
Figure 17: Pseudo code for strategy S7
3.10.1 Situational Knowledge
3.10.2 Historical Knowledge
At each step, the historical knowledge contains each agent's highest ten heights. Therefore when ever an agent queries the historical knowledge the agent will know the ten highest heights found until that time step. Then the agent will update its map with this information.
3.10.3 Topographic Knowledge
The landscape is divided into 16 cells. The Topographic knowledge consists of the highest height found by an agent in each cell. When ever a value is higher than the current value in that cell, that value will be replaced by the new found higher value.
3.10.4 Domain Knowledge
Domain knowledge is explained in chapter 3.9.1.
3.10.5 Neighbours
The agents who are within 50 pixels apart are neighbours. An agent will check the neighbours maps to find out the locations where the neighbours have been and will update its map. This is performed so that another agent does not have to go to a place where another has been. Then the entire landscape can be explored much faster.
3.10.6 Local area
H00 H01 H02
H10 H11 H12
Figure 18: The surrounding heights of an agent.
The agent at H11 will check the local area which are coloured in gray to check whether the next step at any direction is higher than its current position. The agent will update its map with the values in the surrounding area.
3.11 Strategy 8 (S8) - Topographical
Knowledge of Cultural Algorithm.
The landscape is divided into sixteen cells. Initially the agents will randomly be scattered on the landscape. There is a master topographical map with sixteen equal cells of 50 by 50 pixels each. If there are less than sixteen agents then each agent will be assigned to the closest cell according to their current location. For example:
If there are two agents that will fall into the same cell then the first agent will be assigned to that cell and the other agent will be assigned to the next closest cell. When ever an agent is assigned to a cell the master map is updated. But if there are more than sixteen agents then the first sixteen will be assigned to the sixteen cells and the others depending on their current locations and according to the master map will be assigned to cells.
If there are no more unexplored cells then the agents who have finished exploring their assigned cells will come to the middle of the landscape.
When all the agents are in the middle of the landscape, they will update their maps. Then will check for the highest height and all the agents will travel to the highest height. An agent's step = 10 pixels in this simulation.
With each agents map being 20 by 20 cells (10 by 10 pixels for each cell) and the topographical map being 4 by 4 cells (50 by 50 pixels for each cell) the worst case (Twc)
and best case (Tbc) exploration steps can be calculated as follows:
With number of agents (nAgents)>= 16
Steps to explore a topographical cell (S) = 5steps x 5steps = 25 steps
Worst case to assigned cell (wcs) is 28 steps (diagonal length = sqrt(202+202))
Worst case steps to come to the middle from a corner of the landscape (wcm) ≈ 14 steps
Worst case to the corner of the landscape from the middle (wcmh) ≈ 14 steps
Lowest number of agents in a cell (nApc) = floor(nAgents/16) (i.e. div. into 16 cells)
Twc (nAgents) ≈ ceiling(S/ nApc) + wcs + wcm + wcmh
Tbc (nAgents) ≈ ceiling(S/ nApc) + wcm + wcmh
With number of agents (nAgents)< 16
Twc (nAgents) ≈ S*(celling(16/nAgents)) + wcs + wcm + wcmh
Tbc (nAgents) ≈ S*(celling(16/nAgents)) + wcm
The pseudo code is given in figure 19.
1cntTopo = 0
2 If (cntTopo = 0) then
4 cntTopo = cntTopo + 1
5If (No of steps = 0) then
6 Get my x coordinate
7 Get my y coordinate
8 Assign a cell
9 Store my height in the relevant x and y coordinates in myMap array
10 Check whether the agent has finished exploring
11 Get neighbours within 50 pixels apart
12 If (no of neighbours > 0) then
13 Get the neighbours maps.
14 Update myMap with the values in the neighbours maps.
15 If (No of steps > 0) and (Not finished exploring) then
16 Move agent by 1 step in the cell
17 Store my height in the relevant x and y coordinates in myMap array
18 If (No of steps > 0) and (Finished exploring) then
19 Got a cell = false
20 Check Master Topo array to find whether there are any more unexplored cells
21 If (unexplored cells = true) then
22 Assign a cell
23 Move agent by 1 step in the cell
24 Store my height in the relevant x and y coordinates in myMap array
25 Finished exploring = false
27 Finished exploring = true
28 Reached centre = false
29 Check whether the agent is in the centre of the landscape
30 If (reached centre) and (Not got highest height)
31 Get neighbours who are within 50 pixels.
32 Count number of neighbours
33 If (number of neighbours = number of agents – 1) then
34 Get the neighbours maps.
35 Update myMap with the values in the neighbours maps.
36 Get the highest height
37 Got highest height = true
38 Move agent by 1 step towards the highest height
39 Else if (Not reached centre) and (Not got highest height) then
40 Move agent by 1 step towards the centre
41 Else if (got highest height = true) then
42 Move agent by 1 step towards the highest height till the highest height is reached.
Figure 19: Pseudo code for strategy S8
3.12 Strategy 9 (S9) - Modified S8.
If there are two agents that will fall into the same cell then the first agent will be assigned to that cell and the other agent will be assigned to the next closest cell. When ever an agent is assigned to a cell the master map is updated. But if there are more than sixteen agents then the first sixteen will be assigned to the sixteen cells and the others depending on their current location and according to the master map will be assigned to cells.
Once an agent lands on a cell the agent will start exploring the cell and will check for agents within 50 pixels apart(neighbours) then will update its map with the value(s) given by the neighbours and also with its own explored locations. This way more than 1 agent would not explore any area that was explored by another. Then when it has finished exploring that particular cell the agent will check the master map for cells that are not been explored by any agent. If there are any unexplored cells then that agent will be assigned to that cell.
If there are no more unexplored cells and all the agents have finished exploring the assigned cells then will go through the maps of all the agents and find the location of the highest height and all the agents will travel to the highest height. The pseudo code is given in figure 20. The worst case (Twc) and best case (Tbc) steps are same as S8.
1cntTopo = 0
2 If (cntTopo = 0) then
3 Initialize the Master Topo array
4 cntTopo = cntTopo + 1
5 If (No of steps = 0) then
6 Get my x coordinate
7 Get my y coordinate
8 Assign a cell
9 Store my height in the relevant x and y coordinates in myMap array
11 Get neighbours within 50 pixels apart
12 If (no of neighbours > 0) then
13 Get the neighbours maps.
14 Update myMap with the values in the neighbours maps.
15 If (No of steps > 0) and (Not finished exploring) then
16 Move agent by 1 step in the cell
17 Store my height in the relevant x and y coordinates in myMap array
18 If (No of steps > 0) and (Finished exploring) then
19 Got a cell = false
20 Check Master Topo array to find whether there are any more unexplored cells
21 If (unexplored cells = true) then
22 Assign a cell
23 Move agent by 1 step in the cell
24 Store my height in the relevant x and y coordinates in myMap array
25 Finished exploring = false
26 Else if (Not got highest height) then
27 Finished exploring = true
28 Store my height in the relevant x and y coordinates in myMap array
29 If (Finished exploring = true) then
30 Get the neighbours maps.
31 Find the location of the highest height
32 Got highest height = true
![Figure 5: Cultural Algorithm Framework [Reynolds 2002]](https://thumb-us.123doks.com/thumbv2/123dok_us/1453681.1178100/34.612.122.453.411.599/figure-cultural-algorithm-framework-reynolds.webp)