ISSN(Online): 2320-9801
ISSN (Print): 2320-9798
I
nternational
J
ournal of
I
nnovative
R
esearch in
C
omputer
and
C
ommunication
E
ngineering
(A High Impact Factor, Monthly, Peer Reviewed Journal) Website: www.ijircce.com
Vol. 7, Issue 5, May 2019
Attribute Evaluation of Dataset Using
Chi-Square Test in Rapid Miner Studio
Swathi Rathi
EAS SAP Analytics, Cognizant Technologies, Bangalore, India
ABSTRACT: Attribute evaluation is a very popular and mandatory process in data analysis. Today the data is increasing very fast. The amount of data is increasing by multiplying itself. As increased data, the analysis of data is very tough work now. And to find the appropriate prediction is very chasing. So instead of analysing whole dataset, if we could find such variables or attributes which plays major role for predicting the final outcome, then it would be very helpful in analysis. There are various such techniques for this kind of operations. In our study we are implementing one of these techniques names as Chi-Square Test, which examines the dataset and find the most appropriate attribute for finding the prediction. The attribute having maximum weight, would be the main predicting attribute.
KEYWORDS: Statistical data, Chi-square, dataset, variable, attribute prediction.
I. INTRODUCTION
A 'Household Survey' is that the manner toward gathering and work info to modify US to understand the final circumstance and express attributes of individual home or all households within the public. throughout a home survey, field scientists analysis and record realities, perceptions and encounters from the instance households that area unit illustrative of all households within the examination territory. Instruments used for gathering info incorporate a progression of inquiries, perception agendas and records of talks.
A Chi-Square Examination is a genuine assumption Examination in like manner formed as X2 Examination. It is achieved when invalid assumption is legitimate. We played out this Examination for getting finding out about the most Variable and their weight[1-4]. In our data set, to evaluate the Variables among them, we played out this kind of Examination. As outcome it re-establishes a couple of burdens nearby the Variable. From this outcome, we can envision what Variable could without much of a stretch contrast with others to anticipate the outcome.
The variable identification plays a crucial role in the accuracy of the models we use with machine learning and deep learning. In the scenario we are considering in the further section we are explaining the other scenarios which are already done with the best variable identification and the success rate of those based on our requirement. The next section will be explaining the literature reviews related to the Chi-Square mechanism and also related to other suitable mechanisms in identifying the most impeccable features which are focusing on highest accuracy in the outcome. The later sections will cover literature review, proposed work and some other important outcomes of the models[5-8].
II. LITERATURE REVIEW
Some of the recent findings of the accuracy measurement of the features and the models state that we have pre-defined methods for understanding the basic features which are most used in the implementation of the identification of best features.
ISSN(Online): 2320-9801
ISSN (Print): 2320-9798
I
nternational
J
ournal of
I
nnovative
R
esearch in
C
omputer
and
C
ommunication
E
ngineering
(A High Impact Factor, Monthly, Peer Reviewed Journal) Website: www.ijircce.com
Vol. 7, Issue 5, May 2019
The above image states the important of the features extraction and its process. We have the group of features and components which are with the noisy information. We need to select the features with the following methodologies:
i. Backward Elimination
Backward elimination will be considered to be the best practice of identifying the best features to increase the accuracy. The P and SL values define the requirement of identifying the best feature and we can check the accuracy of the models and the results will explain the concept of features identification[9-12].
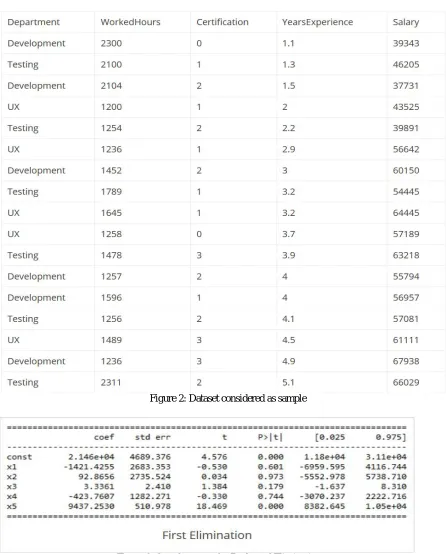
Below we consider one sample example of information and we are trying to analyse the information of the features and what are the features which are most useful the prediction model design. Here we have five features and the last salary feature is the predicted value and it is a dependent variable.
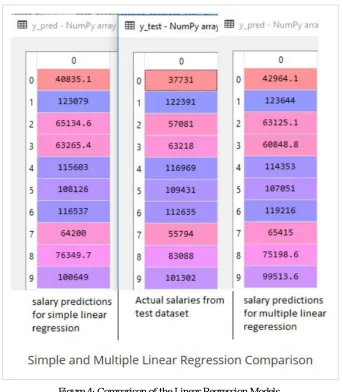
Based on the information we acquired we tried to implement Simple linear regression and multiple linear regression. The results are as follows and which can be identified as the huge difference in the predicted value. The result is as mentioned below.
The middle image is actual dataset values and the right side we can see that there is a difference between the simple linear regression and multiple linear regression models by comparing with actual data provided with the dataset[13-15].
The process of identifying the best feature with backward elimination consists of identifying the significance level, then later fit the model with all the possible independent variables, the highest p- value features will be identified, if the p-value is more than the significance value then it can be eliminated, then repeat the same procedure with the variables which are not eliminated.
Here we are considering significant variable and p-value as the statistical terms and here just our libraries we are using[16-17].
At this point y_pred contains predicted salaries of X_test matrix. values of y_pred are already compared with actual salaries in above screenshot.
Now, as we know in multiple linear regression, y = b0+b1X1+b2X2+b3X3+….+bnXn
we can also represent it as
y = b0X0+b1X1+b2X2+b3X3+….+bnXn where X0 = 1
ISSN(Online): 2320-9801
ISSN (Print): 2320-9798
I
nternational
J
ournal of
I
nnovative
R
esearch in
C
omputer
and
C
ommunication
E
ngineering
(A High Impact Factor, Monthly, Peer Reviewed Journal) Website: www.ijircce.com
Vol. 7, Issue 5, May 2019
Figure 2: Dataset considered as sample
ISSN(Online): 2320-9801
ISSN (Print): 2320-9798
I
nternational
J
ournal of
I
nnovative
R
esearch in
C
omputer
and
C
ommunication
E
ngineering
(A High Impact Factor, Monthly, Peer Reviewed Journal) Website: www.ijircce.com
Vol. 7, Issue 5, May 2019
Figure 4: Comparison of the Linear Regression Models
The above image will give the implementation of backward elimination. ii. Stepwise Regression
In statistics, stepwise regression includes regression models in which the choice of predictive variables is carried out by an automatic procedure.
Stepwise methods have the same ideas as best subset selection but they look at a more restrictive set of models. Between backward and forward stepwise selection, there's just one fundamental difference, which is whether you're starting with a model:
With no predictors (forward) With all the predictors. (backward) At each step:
ISSN(Online): 2320-9801
ISSN (Print): 2320-9798
I
nternational
J
ournal of
I
nnovative
R
esearch in
C
omputer
and
C
ommunication
E
ngineering
(A High Impact Factor, Monthly, Peer Reviewed Journal) Website: www.ijircce.com
Vol. 7, Issue 5, May 2019
we're just going to choose the variable that gives the biggest improvement to the model we just had a moment earlier.
iii. Overfitting and Underfitting
Backward and forward eliminations cannot guarantee for the best output of the result with selecting the features with the ratio of P and Sl will not give the complete result of implementation. This cannot be achieved single handily. So we are into implementation of overfitting and underfitting. Whenever we are in the need to features we shouldn’t add them, that comes under overfitting. When we didn’t reach the required things that comes under underfitting [18].
The above computation theory can help the implementation of both stepwise implementation of backward and forward elimination proves with over fitting and under fitting of the features.
III. PROPOSED WORK
In our study we’ll analyze the dataset with two main phases. One phase is to demonstrate the data using visuals in which data will be visualized in graph format which consist of some important statistical measures such as data type, max value, Min Value, Average, deviation and missing values if present. This would be helpful to identify the data whether it is complete or contains errors or incomplete data. And another work will be done in our study is that we will apply the chi-Square Test on the dataset variables to find the predicting attribute having maximum weight. The Chi-Square technique for attribute evaluation is one of the most significant techniques for attribute evaluation. In previous studies the prediction was gathered through evaluating each and every attribute of the dataset. But in our study we find only the major attributes those performs best for predicting the outcome[19-20].
(i)
Database Review using Graphics: Here we are displaying summarizedcapture for each Variable with its stats.ISSN(Online): 2320-9801
ISSN (Print): 2320-9798
I
nternational
J
ournal of
I
nnovative
R
esearch in
C
omputer
and
C
ommunication
E
ngineering
(A High Impact Factor, Monthly, Peer Reviewed Journal) Website: www.ijircce.com
Vol. 7, Issue 5, May 2019
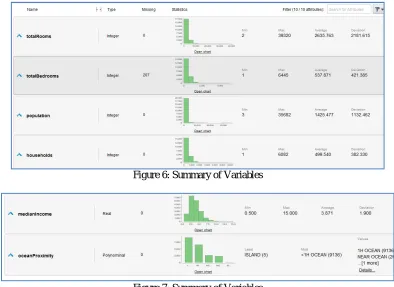
Figure 6: Summary of Variables
Figure 7: Summary of Variables
ISSN(Online): 2320-9801
ISSN (Print): 2320-9798
I
nternational
J
ournal of
I
nnovative
R
esearch in
C
omputer
and
C
ommunication
E
ngineering
(A High Impact Factor, Monthly, Peer Reviewed Journal) Website: www.ijircce.com
Vol. 7, Issue 5, May 2019
The raised table portrays the Basic outcomes of the EDA methodology, which involve huge quantifiable data of each Variable. The quantifiable data joins the Variable name, Maximum estimation of Variable in educational file, Minimum estimation of Variable in instructive gathering, Average estimation of Variable in enlightening file, Std.Dev. of the estimation of Variable, Mod, Lost Values of Variable in educational accumulation and Invalid estimations of Variable in educational gathering.
In our outcome, we will have better perception about the information. In raised table we've examined that the Variable full scale Bedrooms have most outrageous lost characteristics for instance 207. We name Median house estimation as outcome ant Variable, which we have to envision dependent on various Variables of instructive file. he illuminating social event combines the Spatial information named as “longitude”, degree of house as geo spatial -area. With the assistance of result we can expect that the maximum house coordinated on the longitude of - 114.31 and degree of 41.95.Most of the houses are set where sea district is <1H and Minimum house are set close to ISLAND. When we take a gander at the database we can't foresee this result. We looked Maximum individuals of the houses is 35682.0 and least is 3.0. this conveys the database of house has Maximum masses is 35682 in house.
Chi-Square Examination: Here we’ll examine the database variables for its best predictability by implementing the Chi-Square Test technique. We will discretize the dataset variables and takes the discredited variable to the Chi Square operator.
Figure: 8: Simulation Process for Chi-Square Examination
ISSN(Online): 2320-9801
ISSN (Print): 2320-9798
I
nternational
J
ournal of
I
nnovative
R
esearch in
C
omputer
and
C
ommunication
E
ngineering
(A High Impact Factor, Monthly, Peer Reviewed Journal) Website: www.ijircce.com
Vol. 7, Issue 5, May 2019
.
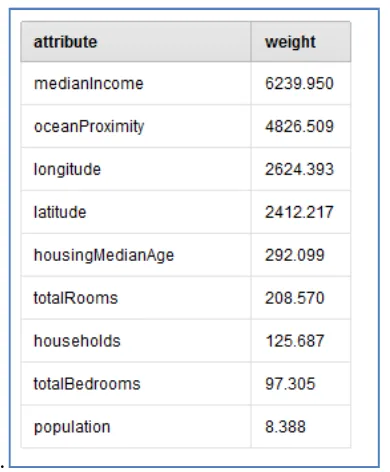
Figure 9: The Outcome of Chi-Square Examination
The raised table demonstrates the Variable name and their heaps. As ought to be evident that the Variable median income has most noteworthy burden than various Variables, which exhibits that this Variable is most critical for envisioning the house estimation. As this thought we can sort or find any 4 to 5 dynamically huge Variables from the whole database. It is known as the Variable appraisal.
IV. RELATED WORK
ISSN(Online): 2320-9801
ISSN (Print): 2320-9798
I
nternational
J
ournal of
I
nnovative
R
esearch in
C
omputer
and
C
ommunication
E
ngineering
(A High Impact Factor, Monthly, Peer Reviewed Journal) Website: www.ijircce.com
Vol. 7, Issue 5, May 2019
In this scenario mentioned in the above image we can consider the pixels which are worth to be considered and maintain the matrix with the sum and average of the instances of the images.
V. CONCLUSION
The relationship between each and every feature define the strength of the model in the prediction scenario. The ratio between the features and the importance of the modelling helped to design this work and we are happy to present you the feature analysis using the chi- square analysis and the predictions are performed using the P and SL values in the backward elimination process and the process of implementation was explained clearly in the proposed work section of this article. We conclude that chi-square analysis is the best one to be followed and all the symbols and the information provided to the model in the form of features are furthered check with the importance.
REFERENCES
[1] K. B. To and L. M. Napolitano, ``Common complications in the critically ill patient,'' Surgical Clinics North Amer., vol. 92, no. 6, pp. 1519_1557, 2012.
[2] C. M. Wollschlager and A. R. Conrad, ``Common complications in critically ill patients,'' Disease-a-Month, vol. 34, no. 5, pp. 225_293, 1988.
[3] S. V. Desai, T. J. Law, and D. M. Needham, ``Long-term complications of critical care,'' Critical Care Med., vol. 39, no. 2, pp. 371_379, 2011.
[4] N. A. Halpern, S. M. Pastores, J. M. Oropello, and V. Kvetan, ``Critical care medicine in the United States: Addressing the intensivist shortage
and image of the specialty,'' Critical Care Med., vol. 41, no. 12, pp. 2754_2761, 2013.
[5] A. E. W. Johnson, M. M. Ghassemi, S. Nemati, K. E. Niehaus, D. A. Clifton, and G. D. Clifford, ``Machine learning and decision support in critical care,'' Proc. IEEE, vol. 104, no. 2, pp. 444_466, Feb. 2016.
[6] O. Badawi et al., ``Making big data useful for health care: A summary of the inaugural MIT critical data conference,'' JMIR Med. Informat., vol.
2, no. 2, p. e22, 2014.
[7] C. K. Reddy and C. C. Aggarwal, Healthcare Data Analytics, vol. 36. Boca Raton, FL, USA: CRC Press, 2015.
[8] D. Gotz, H. Stavropoulos, J. Sun, and F. Wang, ``ICDA: A platform for intelligent care delivery analytics,'' in Proc. AMIA Annu. Symp., 2012, pp.
264_273.
[9] A. Perer and J. Sun, ``Matrix_ow: Temporal network visual analytics to track symptom evolution during disease progression,'' in Proc. AMIA Annu. Symp., 2012, pp. 716_725.
[10] Y. Mao,W. Chen, Y. Chen, C. Lu, M. Kollef, and T. Bailey, ``An integrated data mining approach to real-time clinical monitoring and
deterioration warning,'' in Proc. 18th ACM SIGKDD Int. Conf. Knowl. Discovery Data Mining. 2012, pp. 1140_1148.
[11] J. Wiens, E. Horvitz, and J. V. Guttag, ``Patient risk strati_cation for hospital-associated C. Diff as a time-series classi_cation task,'' in Proc. Adv. Neural Inf. Process. Syst., 2012, pp. 467_475.
[12] S. Saria, D. Koller, and A. Penn, ``Learning individual and population level traits from clinical temporal data,'' in Neural Inf. Process. Syst. (NIPS), Predictive Models Personalized Med. Workshop, 2010.
[13] R. Dürichen, M. A. F. Pimentel, L. Clifton, A. Schweikard, and D. A. Clifton, ``Multitask Gaussian processes for multivariate physiological
time-series analysis,'' IEEE Trans. Biomed. Eng., vol. 62, no. 1,pp. 314_322, Jan. 2015.
[14] M. Ghassemi et al., ``Amultivariate timeseries modeling approach to severity of illness assessment and forecasting in ICU with sparse, heterogeneous clinical data,'' in Proc. AAAI Conf. Artif. Intell., 2015, pp. 446_453.
[15] I. Batal, H. Valizadegan, G. F. Cooper, and M. Hauskrecht, ``A pattern mining approach for classifying multivariate temporal data,'' in Proc. IEEE Int. Conf. Bioinformatics Biomed. (BIBM), 2011, pp. 358_365.
[16] T. A. Lasko, ``Ef_cient inference of Gaussian-process-modulated renewal processes with application to medical event data,'' in Proc.
Uncertainty Artif. Intell., 2014, p. 469_476.
[17] K. L. C. Barajas and R. Akella, ``Dynamically modeling patient's health state from electronic medical records: A time series approach,'' in Proc.
21st ACM SIGKDD Int. Conf. Knowl. Discovery Data Mining, 2015,pp. 69_78.
[18] X. Wang, D. Sontag, and F. Wang, ``Unsupervised learning of disease progression models,'' in Proc. 20th ACM SIGKDD Int. Conf. Knowl. Discovery Data Mining, 2014, pp. 85_94.
[19] M. J. Cohen, A. D. Grossman, D. Morabito, M. M. Knudson, A. J. Butte, and G. T. Manley, ``Identi_cation of complex metabolic states in critically injured patients using bioinformatic cluster analysis,'' Critical Care, vol. 14, no. 1, p. 1, 2010.
[20] J. Zhou, J. Liu, V. A. Narayan, and J. Ye, ``Modeling disease progression via fused sparse group lasso,'' in Proc. 18th ACM SIGKDD Int. Conf.
Knowl. Discovery Data Mining, 2012, pp. 1095_1103.
[21] E. Choi, N. Du, R. Chen, L. Song, and J. Sun, ``Constructing disease network and temporal progression model via context-sensitive hawkes
process,'' in Proc. IEEE Int. Conf. Data Mining (ICDM), 2015, pp. 721_726.
[22] R. Pivovarov, A. J. Perotte, E. Grave, J. Angiolillo, C. H. Wiggins, and N. Elhadad, ``Learning probabilistic phenotypes from heterogeneous