University of Windsor University of Windsor
Scholarship at UWindsor
Scholarship at UWindsor
Electronic Theses and Dissertations Theses, Dissertations, and Major Papers
2018
Energy Efficient Route Planning Using VANET
Energy Efficient Route Planning Using VANET
Nazmul Sumon University of Windsor
Follow this and additional works at: https://scholar.uwindsor.ca/etd
Recommended Citation Recommended Citation
Sumon, Nazmul, "Energy Efficient Route Planning Using VANET" (2018). Electronic Theses and Dissertations. 7398.
https://scholar.uwindsor.ca/etd/7398
This online database contains the full-text of PhD dissertations and Masters’ theses of University of Windsor students from 1954 forward. These documents are made available for personal study and research purposes only, in accordance with the Canadian Copyright Act and the Creative Commons license—CC BY-NC-ND (Attribution, Non-Commercial, No Derivative Works). Under this license, works must always be attributed to the copyright holder (original author), cannot be used for any commercial purposes, and may not be altered. Any other use would require the permission of the copyright holder. Students may inquire about withdrawing their dissertation and/or thesis from this database. For additional inquiries, please contact the repository administrator via email
Energy Efficient Route Planning Using VANET
By
Nazmul Huq Sumon
A Thesis
Submitted to the Faculty of Graduate Studies through the School of Computer Science in Partial Fulfillment of the Requirements for
the Degree of Master of Science at the University of Windsor
Windsor, Ontario, Canada
2017
II
Energy Efficient Route Planning Using VANET
By
Nazmul Huq Sumon
APPROVED BY:
_____________________________________
K. Tepe
Department of Electrical and Computer Engineering
_____________________________________
M. Kargar
School of Computer Science
_____________________________________
R. D. Kent, Co-Advisor School of Computer Science
_____________________________________
A. Jaekel, Advisor School of Computer Science
III
DECLARATION OF ORIGINALITY
I hereby certify that I am the sole author of this thesis and that no part of this thesis has been
published or submitted for publication.
I certify that, to the best of my knowledge, my thesis does not infringe upon anyone’s copyright
nor violate any proprietary rights and that any ideas, techniques, quotations, or any other
material from the work of other people included in my thesis, published or otherwise, are fully
acknowledged in accordance with the standard referencing practices. Furthermore, to the extent
that I have included copyrighted material that surpasses the bounds of fair dealing within the
meaning of the Canada Copyright Act, I certify that I have obtained a written permission from the
copyright owner(s) to include such material(s) in my thesis and have included copies of such
copyright clearances to my appendix.
I declare that this is a true copy of my thesis, including any final revisions, as approved by my
thesis committee and the Graduate Studies office, and that this thesis has not been submitted
IV
ABSTRACT
One of the key challenges in conducting dynamic route planning is the process of collecting and
disseminating instantaneous travel data in real time. Recent studies are evaluating VANET
(Vehicular Ad Hoc Network) and its associated WAVE (Wireless Access in Vehicular Environment)
standards to facilitate this process. In these studies, travel data accumulated from vehicle OBUs
(on board unit) are shared with other vehicles over DSRC (dedicated short- range communication)
medium using centralized or distributed approach. In most studies, data collection and
dissemination process are not scalable enough for high density traffic environment. Specifically,
with a centralized approach, if traffic management center (TMC) or Road Side Unit (RSU)
performs route planning for vehicles, there will be many bidirectional communications between
the centralized entity and vehicles, leading to higher channel congestion in heavy traffic areas.
With a distributed approach, information shared by other vehicles might not be useful or
pertinent for some vehicles, leading to wastage of channel bandwidth. Methods used for data
collection also need to be intelligent to count in nontraditional circumstances to achieve
accuracy. In this thesis, we have proposed a three tiered architecture for data collection, analysis
and dissemination. In addition, 1) we demonstrated the concept of queuing delay at intersection
for travel time calculation and developed a hybrid metric that considers average travel time and
occupancy rate, 2) we offload the computation of route planning to vehicle OBUs and 3) we
developed an algorithm that determines the area of propagation for data that needs to be
disseminated. We evaluated the performance of our approach progressively using VEINS, SUMO
V
ACKNOWLEDGEMENTS
I would like to express my deepest appreciation to my supervisor Dr. Arunita Jaekel and
my co-supervisor Dr. Robert D. Kent for their support and inspiration during my Master’s program
at the University of Windsor. Dr. Kent, you have taught me how to pause, take a step back and
assess my current standing before setting future goals. Dr. Jaekel, you have always inspired me
by teaching how to correct and test small steps before trying a large one. I have had the chance
to meet some very talented colleagues who have taught and supported me during my years at
the university. Special thanks to Bryan St. Amour and Paul Preney for sharing their deep
understanding on programming languages with me.
To my wife Sharmina, without your unconditional support, I couldn’t have come this far.
VI
DEDICATION
VII
TABLE OF CONTENTS
DECLARATION OF ORIGINALITY III
ABSTRACT IV
ACKNOWLEDGEMENTS V
DEDICATION VI
LIST OF FIGURES IX
LIST OF TABLES X
1. Introduction ...1
1.1 ITS and VANET: ... 1
1.2 Motivation:... 2
1.3 Problem statement: ... 3
1.4 Solution outline: ... 5
1.5 Thesis organization: ... 7
2. Background ...8
2.1 Terminology ... 8
2.2 Dynamic Route Planning ... 11
2.2.1 Tools used for performance evaluation ... 12
2.3 Literature review on route planning based on VANET: ... 17
3. Proposed Fuel Efficient Route Planning ... 20
3.1 Traffic Management Center (TMC) Functionality ... 23
3.1.1 Create Edge to RSU association ... 23
3.1.2 Maintain Current Traffic Information ... 26
3.2 Vehicle OBU Functionality ... 30
3.2.1 Send Travel Time Updates ... 30
3.2.2 Update Vehicle Route ... 30
3.3 RSU Functionality ... 34
4. Experiment Setup and Results ... 36
4.1 Experiment Setup ... 36
VIII
4.1.2 Graph node and edge extraction ... 37
4.1.3 Internal junction and edge elimination ... 38
4.1.4 Node, edge and RSU association, and driving permissibility ... 38
4.1.5 RSU placement selection ... 38
4.1.6 Database setup ... 39
4.1.7 TMC setup ... 40
4.1.8 Vehicle setup ... 41
4.1.9 Vehicle – RSU interaction ... 42
4.1.10 Route file / Demand generation ... 42
4.2 Results ... 43
5. Conclusion ... 47
5.1 Future Work ... 47
References ... 49
IX
LIST OF FIGURES
Figure 2.1 DSRC/WAVE protocol stack 1 ... 9
Figure 2.2 Control (CCH) and Service (SCH) Channels of DSRC Spectrum ... 10
Figure 2.3 A map in .osm format as viewed in SUMO ... 13
Figure 2.4 Simulation capture showing internal junctions and edges, and signalized intersection ... 14
Figure 2.5 a very high level overview of connections between SUMO, VEINS and OMNET++ ... 16
Figure 3.1 High level overview of proposed approach 1 ... 21
Figure 3.2 Edge-RSU relationship using n=2. The colored RSUs will broadcast metric value of prospective edge ‘e’ with start node ‘j’ for nearby vehicles to influence route planning ... 24
Figure 3.3 TMC process flow chart ... 29
Figure 3.4 Vehicle application flowchart ... 31
Figure 3.5 Driving permissibility is required to be consulted for correct operation of FERP ... 33
Figure 3.6 RSU application process flowchart ... 35
Figure 4.1 High level setup of the experiment 2 ... 41
X
LIST OF TABLES
Table 3.1 Terminologies used for proposed approach 1 ... 22
Table 4.1 Notations used in experiment 1 ... 36
Table 4.2 Tables used in the database1 ... 40
Table 4.3 Summary of simulation properties1 ... 43
Table 4.4 Result of setup 1 ... 44
Table 4.5 Result of setup 2 1 ... 45
1
1. Introduction
1.1 ITS and VANET:
Intelligent Transportation System (ITS) - was first envisioned in the early 1980’s primarily for
surface transportation with the purpose of improving safety, efficiency and convenience [1]. ITS
was first officially recognized by Transportation Equity Act (TEA-21), passed by the US Congress
in 1988 [2]. Three main disciplines of ITS are Advanced Traveler Information System (ATIS),
Advanced Vehicle Control and Safety System (AVCSS) and Advanced Transportation Management
System (ATMS) [2]. While the ATMS discipline addresses monitoring and management of
real-time traffic, detections of traffic pattern, driver error, system performance and vehicle state are
addressed by AVCSS. ATIS provides notifications on incidents, road conditions, restrictions,
weather etc. through variable message signs in roads and highways.
With the advent of Controller Area Network (CAN) bus [3] that are installed in vehicles 1996
and newer, a wide array of vehicle’s system state and performance data can be tracked and
recorded such as velocity, acceleration, different engine state, wheel state, brake state etc.
Additional state data can also be gathered using Radio Detection And Ranging (RADAR), Light
Detection And Ranging (LIDAR), and other sensor devices [31]. Vehicular Ad Hoc Networking
(VANET) [1] brings in new dimension to ITS since these state data can be disseminated and shared
among cars using On Board Units (OBU) that are installed in vehicles and, or infrastructure
2
VANET got a large boost in its development when US allocated dedicated short range
communication (DSRC) channel for vehicular operation in 1999 [2]. VANET got more formal
specification with DSRC’s 802.11p amendment to the traditional 802.11 standard along with
other standard extensions of 1609.x in WAVE [1][2]. Apart from VANET’s safety application to
assist with collision avoidance and accident data dissemination, numerous research is being
conducted to develop applications that can aid Traffic Information/Management Centers
(TIC/TMC) to address efficient route management, route planning and diversions [21].
1.2 Motivation:
One of the key contributing factors of global warming is traffic congestion due to
overloaded and inefficiently planned road infrastructure and traffic management system. Apart
from pollution, congestion costs an estimated $160 billion of lost productivity in the USA alone
[4]. Canadian cities are not behind [5] and by 2050 an estimated 9 billion people with 2.9 billion
cars will share the road [6][7]. More vehicles require more well-planned traffic management
system along with a balanced and efficient infrastructure expansion plan. ITS comprising of a set
of emerging technologies for surface transportation can be an effective tool to assist
policymakers in building such a plan. VANET - now an integral part of ITS, is capable of sharing
pertinent information of road and vehicular data with other vehicles and Road-Side Units in ‘real
time’. These disseminated data then can be analyzed by the central traffic monitoring system to
coordinate route planning and scheduling of vehicles. This will result in reduced congestion on
roads and provide faster, fuel efficient trip time for vehicles. However, it is important to also
3
1.3 Problem statement:
At present, route planning using traditional Global Positioning System (GPS) [8] advises
drivers on the shortest trip based on static route database and with the help of subscribed data
feed over ‘Radio Data System’ that broadcasts current traffic congestion over ‘Traffic Message
Channel’ [9] and more recently using push notifications over the internet [11]. The inefficiencies
of such route planning are mainly as follows -
Does not consider the results of aggregated load on alternative lighter paths where the
vehicles are rerouted to [10]
Due to low bit rate of traffic message channel [9], delay in broadcasting such information
is considerably high leading to route planning using outdated information
Use of internet service requires data subscription
The timing is important since the current congestion doesn't mean it will remain
congested for an indefinite period. If infrequent or, occasional congested routes that gets
cleared in short time are considered during initial route plan, vehicles will be subscribed
into frequently congested route leading to further poor traffic distribution.
One way to tackle the problem of outdated data is to have instantaneous road data for each
road segment that can be analyzed in centralized or distributed manner. The parameterized road
segments represented as graph edges can also be recalibrated for dynamic weight redistribution
4
be collected using a combination of roadside units, and OBUs installed in the vehicles. Vehicles
then can be rerouted based on some decision-making process and on the basis of gathered road
data that are usually converted into metrics. The decision making can be conducted either by the
ego vehicle alone or, by a cluster of adjacent vehicles that are in certain close proximity to each
other or, by a centralized traffic monitoring center or, by any combination of them
[12][13][15][20].
A commonly used road data for calculating edge weight is the average trip time of vehicles
collected as they pass through edges [12][13][15][17][19]. However, proper considerations need
to be taken on - how trip time data are collected, where those data are assessed and how the
assessed data are disseminated. These considerations are important to achieve maximum route
planning efficiency with minimum channel congestion and bandwidth stress on the network. For
example consider the following cases –
If route planning is performed by the traffic monitoring center, there will be numerous
one to one communication between the vehicles and the traffic monitoring center which
is not scalable.
If the route planning is performed by ego vehicles, analyzed data from traffic monitoring
center needs to be disseminated in proper areas that are applicable to ego vehicle.
If trip completion time for edges is used as the method for calculating travel time, vehicles
5
edges’ provides delayed feedback of that edge resulting erroneous reporting of that edge
to be congestion free.
1.4 Solution outline:
In this paper, we closely followed the work of Hamed et al. [12] in collecting real-time trip data
where travel time are collected instantaneously on edges and used immediately for road metric
calculation. In addition, we proposed three modified approaches in collecting travel time data,
calculating edge metrics and disseminating the data as follows -
A.Offload route planning computation to OBUs:
We offload the tasks of performing ‘travel time calculations of individual edges’ and ‘route
planning’ to the vehicles themselves instead of RSUs or traffic monitoring centers. In other
words, OBUs are responsible for receiving travel time for all vehicles, process and send
them to TMC. TMC, in turn, send updated Current Trip Time (CTT) to RSU for broadcast.
Vehicles do not query RSU/TMC for route planning, rather they do the planning by
themselves using updated CTTs.
B. Develop an RSU-EDGE relationship:
This method is for choosing how far the congestion data of a particular edge should be
disseminated, so a vehicle can determine whether that edge should be selected in its route
plan or, not. This is achieved by binding of an RSU R, with an edge set E, where R is
responsible for broadcasting metrics for E. By using this three-tiered structure, we limit the
6
the network. The decision of choosing the boundary of such dissemination is empirical since
having too short boundary means vehicles might choose locally optimum path and face
heavily congested areas down the route plan that are not known to them in advance.
Having the boundary too broad can also be a problem as sparsely and occasionally
congested distant areas that quickly become uncongested might alter initial route plan of
vehicles to choose lower degree of congested areas that are persistently congested.
C. Consider intersection queue or red light delay in computing edge metrics:
If there is a long queue at an intersection due to traffic backlog on next edge and/or, traffic
light phasing, vehicle(s) may not able to deliver travel time updates to RSUs. This is the case
when vehicle broadcasts the travel time for the previous edge, upon getting into a new
edge. This results in RSUs erroneously assuming that the edge is free of congestion. An
alternative approach is that vehicle waiting in the queue sending travel time that equals to
the time to reach current position plus delay time that is beyond certain threshold.
In this thesis, we have used SUMO [22] as road traffic generator and OMNET++ [23] with
VEINS [24] for DSRC’s WAVE stack simulation. Using the simulations, we evaluated the
performance of our approach compared to the methods used previously by other researchers.
Several simulations are run using different value of queuing delay and RSU-EDGE relationship as
described above. The results indicate that the proposed approach will lead to better aggregated
7
1.5 Thesis organization:
The rest of the paper is organized as follows. Chapter 2 discusses related terminology and
literature review relevant to this area. Chapter 3 demonstrates our proposed approach, setup,
and algorithms. Chapter 4 provides the result analysis. In chapter 5 we conclude and summarized
8
2. Background
In this chapter we review some basic terminology and fundamental concepts to ITS and
VANET. We also describe in-depth the current techniques for dynamic route planning available
in the literature that are most relevant to this thesis.
2.1 Terminology
WAVE (Wireless Access in Vehicular Environment) refers to collective standards of 802.11p - an
extension of traditional 802.11 for operation in high speed vehicular environment with low
latency and 1609.x – that defines the additional OSI equivalent layers necessary to support such
communication using DSRC (Dedicated Short Range Communication) [25]. In most papers WAVE
protocol and DSRC protocol are used to refer same set of standard interchangeably.
DSRC refers to the ‘dedicated 75 MHz spectrum in the 5.9 GHz band allocated by US Federal
Communications Commission for automotive use’ and the corresponding set of protocols and
standards to support the communication using that spectrum [25]. The primary motivation of
DSRC was to facilitate the development of collision avoidance application [32]. The application
will rely on data from vehicle states such as speed, acceleration, position, brake states etc. and
data from road side infrastructure. Road side infrastructure often termed as RSUs can act as
communication relay point for distant vehicles and can also act as an intermediary between
9
for Automotive Engineer) J2735 standard, vehicle state data are encapsulated with WSM (WAVE
Short Message) for dissemination. For data dissemination purpose, all equipment such as OBUs
and RSUs needs to be of DSRC standards to maintain interoperability of such communication.
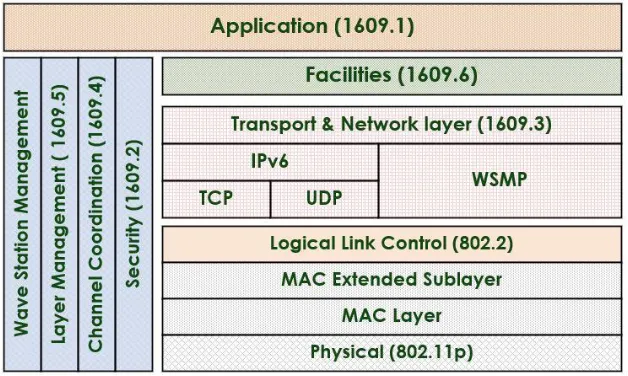
Figure 2.1 depicts the WAVE protocol stack in general. DSRC equipped devices need to maintain
communication with two channels instead of one as in traditional LAN based communication.
Therefore, DSRC incorporates an additional MAC sublayer for channel coordination and switching
as defined by the 1609.4 standard.
Figure 2.1 DSRC/WAVE protocol stack1
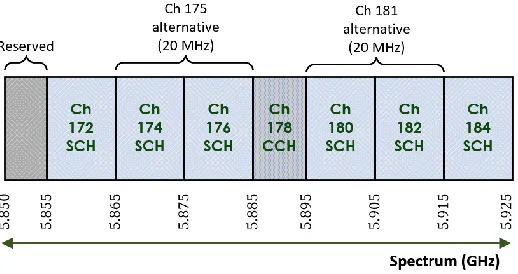
CCH and SCH refers to control and service channels of the DSRC spectrum. Out of the 75 MHz
spectrum 5MHz is used for guard band and rest is divided into 7 channels – each with 10 MHz
spectrum. The control channel is used for carrying management and higher priority messages
using WSMP while the service channel are used for other types of data using TCP/UDP. Security
10
depicted in figure 2.2. Channels 174, 176 can be combined to form one 20 MHz channel – 175.
Similarly channels 180 and 182 can be combined to form a 20 MHz channel – 181.
Figure 2.2 Control (CCH) and Service (SCH) Channels of DSRC Spectrum1
WSM refers to WAVE Short Message that uses either control or service channel of DSRC to carry
time-sensitive, high-priority information using WAVE Short Message Protocol [25]. WSM contains
extension like channel number, data rate, and transmit power so the upper layer can indicate the
purpose the message usage [33]. The syntax of such time sensitive messages is defined using
SAEJ2735 standard. Basic Safety Message (BSM) is an example which is delivered using WSMP
with a WSM header extension. BSM has two sets of information where set 1 is mandatory for
initial deployment of DSRC in USA and set 2 is optional. Set 1 of BSM is the information set that
contains space and time critical states of vehicles for the development of safety applications [33].
CAN BUS is a computer network, interconnecting embedded systems that control the vehicle and
vehicle’s performance. CAN in general refers to the protocol of using such bus where the protocol
works by exchanging messages between the components independently without the use of a
11
2.2 Dynamic Route Planning
Route planning in general involves the process of selecting a set of roads connecting
source and destination with some constraints involved such as fastest, shortest or most fuel
efficient route to destination. Each of these constraint imposes different ways of selecting one
or more metrics based on which the route planning algorithm decides the best route. The typical
metric stored in route planning instrument such as a GPS is travel time. Dividing a given road
segment’s length by posted speed of that segment produces travel time of the respective
segment. While travel time provides the fastest route to destination, an even simpler metric –
travel distance which is the actual length of road segments - can provide shortest route to
destination. Routing planning that considers travel cost makes fuel efficient route calculation
that can include additional metric such as road slope, length of idle time during transit etc. [27].
Route planning can also consider easiness of driving as described in [34] that factors in driver’s
preference for number of signals, number of turns and road width of the planned route.
Advanced route planning may also consider statistical traffic patterns possibly involving historical
data analysis along with current probe data to estimate future travel time [28][29].
Route planning using GPS make use of preloaded map data for route determination. The
validity of some data such as road closure, new road development etc. are dependent upon how
recently the map was loaded into the GPS unit. GPS can also receive some basic road state
information over RDS-TMC (Radio Data System – Traffic Message Channel) [34]. Due to limited
channel bandwidth [9], data received over RDS-TMC cannot be used to make real time route
12
Route planning using VANET involves the process of probing current road and vehicle
state data and disseminating the probed data for use of other vehicles using distributed and, or
centralized approach. In distributed approach vehicles share data with adjacent vehicles with the
formation of a cluster [13] and in centralized approach data is directly sent over to a centralized
entity for further processing [17]. The data probed, can be sourced from vehicle’s CAN bus, GPS,
passenger’s electronic devices and other available sensors such as camera, radar, LIDAR etc.
while the centralized entity can be road side units and, or traffic monitoring center. VANET also
brings new possibilities in route determination such as cooperative route planning [REFs] that
distributes traffic to reduce congestion but also factors in driver’s historical and current
preference such as avoidance of toll routes, highways etc. [36][37].
Performance evaluation of route planning methods in most cases involves the use of
simulated environment as setting up practical testbed for a large scale research is expensive and
unfeasible [26]. For VANET based route planning, a network simulator that implements the
VANET infrastructure for communication along with a road traffic generator is necessary.
2.2.1 Tools used for performance evaluation
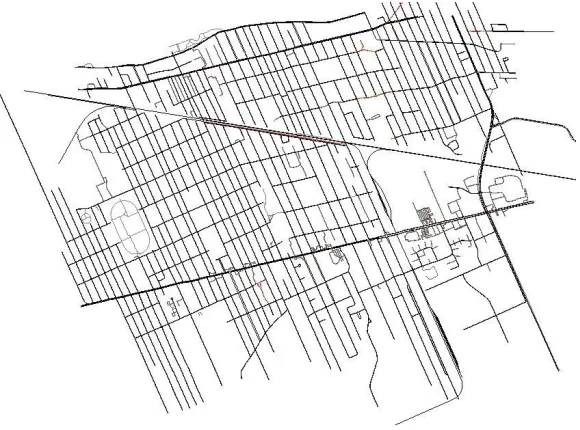
Open Street Map is an open source editable world map database that gets build upon
community contribution of volunteered geographic information. The maps are downloadable for
13
Figure 2.3 a map in .osm format as viewed in SUMO1
SUMO is a road traffic generator that is microscopic and multimodal - meaning different
transport such as vehicles, pedestrians and public transport are modeled explicitly [22]. SUMO
build its road map by using node and edge definition files named ‘*.node.xml’ and ‘*.edge.xml’.
Alternatively, it can also import open street map format and covert it to ‘.net’ file which
represents the map. Edge definition includes shape, lane, speed, length and traffic type of
respective edges where node definition includes intersection type, coordinates and included
lanes for respective nodes. Traffic generation is done through the definition of ‘*.route’ file. For
demand generation, route file can be constructed using ‘Activity-based demand generation’,
14
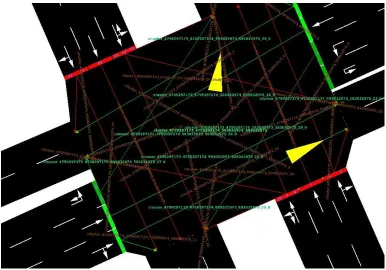
Figure 2.4 Simulation capture showing internal junctions and edges, and signalized intersection1
TraCI refers to SUMO’s online interaction server that provides interface to query, regulate
or control traffic parameters or characteristics during simulation.
TMC – throughout this paper, is referred to as Traffic Monitoring Center that processes
‘data sent by vehicles and RSUs’, analyze those data, store the analyzed data for future use and
purge obsolete data as necessary.
Junction refers to regular road’s intersection in SUMO with predefined or imported traffic
priority behavior from map. Traffic priority defines which traffic has the right of way through the
15
Internal Junctions and Internal Edges create links between lanes of two different road
segments inside a junction. During graph construction and query regular Junctions are treated as
nodes and regular Roads are treated as edges.
Traffic light phasing refers to the duration of different states such as green, amber and
red for traffic lights in an intersection.
Network Simulator in general simulates protocol specific communication between nodes
(or, hosts). The protocol definition and behavior of such communication are programmed into
the simulators. A user of the simulator has the ability to choose a protocol and to define
parameters of the communication and node’s characteristics using the simulator’s API, descriptor
or configuration files. OMNET++ is a network simulator that is modular and component based
and is extensible to suit most network protocols [23]. OMNET++ enables user to model existing
network protocols or user defined custom protocols that are used in communication network.
Modules that controls the behavior of the protocols, are programmed with C++. Interaction
between modules and their behaviors are set by the user using ‘*.ini’ (initialization) and ‘*.ned’
(network descriptor) files.
VEINS – a framework written in C++ - translates SUMO’s road traffic vehicles into network
nodes in OMNET++ and provides the mobility factor to them in adherence to WAVE’s working
mechanism. It provides the base for vehicular network simulation that closely implements
‘WAVE architecture and different models like physical layer, channel switching, interference,
propagation, antenna pattern, obstacle shadowing etc.’ to make the simulation very close to real
16
support VANET. In addition it implements Path Loss Model and Obstacle Shadowing Model to
bring real world radio propagation scenario. Models are also defined for channel sensing, radio
switching, and transmission window. A specific 1609.4 module is defined to support Enhanced
distributed Channel Access, (EDCA) which is responsible for frame queuing and transmission
based on priority.
Figure 2.5 a very high level overview of connections between SUMO, VEINS and OMNET++1
VEINS also provides bi-directionally coupled simulation by which control of vehicle in respect to
its changing network environments and based on user specified demand can be reflected back
17
together giving a notion of single simulation behavior [26]. Figure 2.5 depicts a very high level
overview of connectivity between SUMO, VEINS and OMNET++.
2.3 Literature review on route planning based on VANET:
In [13], Joshi et al. used clustering algorithm for vehicles for collecting real time
congestion information using GPS and for propagating the collected information using epidemic
diffusion - also known as rumor model [14]. The system was developed around the principle that
only vehicles - ‘deviating from posted speed limit combined with the prior knowledge of frequent
congestion history of a given road segment’ - needs to communicate the information. The
downside of this decentralized approach is ‘occasional congestion that are sparsely formed’ may
not be communicated to the distant traffic in sufficient time for alternate route planning.
In [15], Keshavarzi et al. proposed a system that amalgamates information on congestion
from sensors installed on the road and from inter vehicle communication through rumor. A cost
function that considers dynamic metric on segments along with expiry, delay and uncertainty
was proposed. The main limitation of this approach is how much congestion information on what
roads are to be exchanged between ‘road side units and vehicles’ and between the vehicles was
not clear. If congestion information on every roads of a locality or city are to be exchanged, the
packet size for transferring such data would be considerably high resulting in bandwidth stress
[16].
In [17], Collins et al. proposed a traffic management system that collects traffic data
18
suggests best routes to the vehicles based on their current positions and destinations. The
problem with this system is the centralized single tier approach where vehicles are directly
reporting to a central server and the central server directly proposing routes to vehicles. Apart
from scalability issue, this approach would put significant of stress in network bandwidth because
of the noisy communication overhead unless other approaches to mitigate the channel
congestion is used [18].
In [12], Noori et al. the authors proposed a method where RSUs on each end of roads
calculates passing vehicle’s travel time, averages the travel time for certain number of vehicles
and broadcast the data to other vehicles and traffic information center. To calculate the travel
time for a road segment, a bidirectional communication scheme between the vehicles and RSU
is established. First as a vehicle enters an edge which hosts an RSU, it receives a timestamp from
RSU. The timestamp is carried by the vehicle and delivered to next RSU upon arriving on the end
of the edge. RSU then calculates the travel time by subtracting the timestamp from the current
time and share this with other RSUs. Vehicles query RSUs for route planning of their sources and
destinations, RSUs in turn consults with traffic information center to provide such route planning
back to vehicles. The communication scheme for this approach is also have the same problem of
being quite chatty because of the bidirectional inquiries between vehicles and traffic information
center for determination of route planning. Also vehicle OBUs are underutilized since they do not
perform route planning and travel time calculation of their own as TMC and RSU do those
19
In [19], Change et al. proposed a hybrid approach that considers recent congestion data
from google map and data gathered and shared between vehicles to estimate future travel time
and make route planning decision. First, data from a proposed App installed in driver’s
smartphones are utilized in calculating travel time, average speed and fuel consumption. Next,
the collected data are shared using VANET with vehicles within a certain distance and up to a
certain time. Progressively, as more data are collected, more accurate picture of the road status
of a surrounding area is realized for an ego vehicle. The ego vehicle then also collects information
on congestion from Google Map and calculates final metrics for road of its surrounding area that
gets feed into an A* algorithm for route plan. The limitation of this approach is, the shared data
from a vehicle might be useless for a cluster of vehicles who will not use the roads of which the
data was shared. In addition, in an area populated by heavy traffic, this scheme also can
contribute to channel congestion due to the large amount of information shared between
20
3. Proposed Fuel Efficient Route Planning
The purpose of our proposed approach is to be fuel efficient in terms of lower aggregated
emission and lower aggregated trip time for all vehicles. The functionality of the proposed
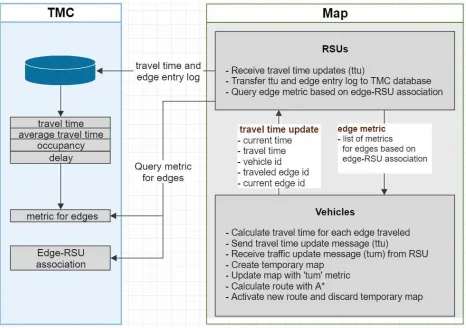
approach is implemented in 3 different components, as shown in Figure 3.1. Each component is
responsible for carrying out its own functions and communicating with the other components to
transmit/receive information as necessary. The main tasks implemented each component are
discussed below.
1. TMC functionality: The TMC is responsible for traffic analysis based on the
information relayed over from the RSUs. TMC performs calculation of road metric
using average travel time, intersection delay factor and occupancy window. To
determine the set of road segments an RSU is responsible for, ‘Edge to RSU
association’ algorithm is used which stores the association dictionary in TMC’s
database for RSU’s use. TMC also purges outdated information from the database
to minimize query time for the RSUs.
2. Vehicle functionality: Each vehicle is responsible for calculating travel time for
each road segment it has travelled, and broadcasting them. In addition route
planning algorithm run (section 3.2.2) to calculate the desired route is carried out
by the OBU of each vehicle independently.
3. RSU functionality: Each RSU is responsible for receiving travel time updates (ttu)
from the vehicles and transfer the updates to TMC’s database. The transmitted
21
metrics of road segments that the respective RSU is responsible for and broadcasts
them for vehicle use.
Fig 3.1 shows the high level interaction between three main components of our proposed
approach. The map container on the right shows interactions between RSU and Vehicles and
their message format for communication.
22
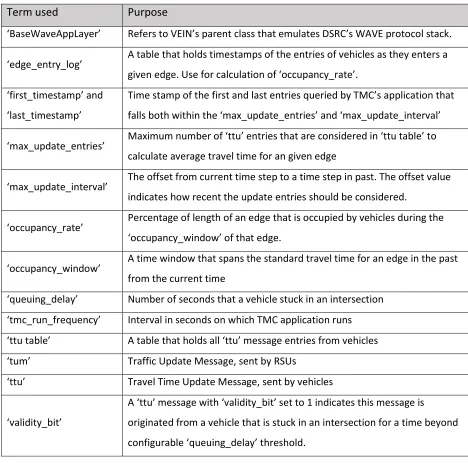
In the following subsections we will discuss each of the above three components in detail. Table
3.1 introduces some of the terminology that will be used in the following sections.
Table 3.1 Terminologies used for proposed approach 1
Term used Purpose
‘BaseWaveAppLayer’ Refers to VEIN’s parent class that emulates DSRC’s WAVE protocol stack.
‘edge_entry_log’ A table that holds timestamps of the entries of vehicles as they enters a given edge. Use for calculation of ‘occupancy_rate’.
‘first_timestamp’ and
‘last_timestamp’
Time stamp of the first and last entries queried by TMC’s application that
falls both within the ‘max_update_entries’ and ‘max_update_interval’
‘max_update_entries’ Maximum number of ‘ttu’ entries that are considered in ‘ttu table’ to calculate average travel time for an given edge
‘max_update_interval’ The offset from current time step to a time step in past. The offset value indicates how recent the update entries should be considered.
‘occupancy_rate’ Percentage of length of an edge that is occupied by vehicles during the ‘occupancy_window’ of that edge.
‘occupancy_window’ A time window that spans the standard travel time for an edge in the past from the current time
‘queuing_delay’ Number of seconds that a vehicle stuck in an intersection
‘tmc_run_frequency’ Interval in seconds on which TMC application runs
‘ttu table’ A table that holds all ‘ttu’ message entries from vehicles
‘tum’ Traffic Update Message, sent by RSUs
‘ttu’ Travel Time Update Message, sent by vehicles
‘validity_bit’
A ‘ttu’ message with ‘validity_bit’ set to 1 indicates this message is
originated from a vehicle that is stuck in an intersection for a time beyond
23
3.1 Traffic Management Center (TMC) Functionality
3.1.1 Create Edge to RSU association
In our proposed approach, RSUs do not perform route planning on behalf of the vehicles
rather the vehicles themselves do so by receiving the edge cost information of a limited
surrounding area of around the respective ego vehicle. It is thus important to cap the amount of
edge cost information being broadcasted by a particular RSU, specifically the edge set of which
the cost information is broadcasted must be relevant to the surrounding area of interest of the
vehicle receiving the broadcast.
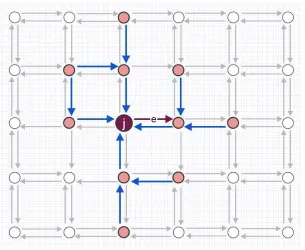
We therefore developed an algorithm that establishes relationship between an edge and
a set of RSUs where the RSUs are responsible for broadcasting metrics for that particular edge.
When determining an edge ‘e’ that will be associated to a set of RSUs ‘R’ - taken a given RSU ‘r’
‘s junction as center point ‘c’ where ‘c’ ‘s outgoing edge is ‘e’, we are interested for adjacent
junctions that are ‘n’ hops away from ‘c’ that can reach ‘c’ using their outgoing edges. The ‘n’ is
configurable based on user’s requirement to set for desired number of hops. The higher the
number of hops, the further a particular edge’s metric will be broadcasted by the RSUs. It is to
be noted that, although the computational complexity of this algorithm is O(n3), it is calculated
only once for a given map before the simulation run. Thus, the simulation runtime is not impacted
24
Figure 3.2 Edge-RSU relationship using n=2. The colored RSUs will broadcast
metric value of prospective edge ‘e’ with start node ‘j’ for nearby vehicles to influence route planning
1
Proposed Algorithm for Edge-RSU Relation
Input:
Node set, V
Edge set, E
Graph G = (V, E)
Max_hops = n
Result:
For any given directed edge e (v1, v2), find node set A, such that ∀v ∈ A, v can reach v1, in
n hops, using their outgoing edges, if there exists such an edge. The node set is analogous
to RSU set here.
Initialize dictionary D ← ∅, for edges as key and set of associated nodes as value
For each node v ∈ N do
Initialize outgoing edge set, O
25 for each outgoing edge, g ∈ O do
Initialize queue Q
Q.enqueue ((g, 0))
while Q is not empty do
current_node ← Q.front.first
hop_count ← Q.front.second
if hop_count > Max_hops then
Q.dequeue ()
Continue
if g is a key in D then
if current_node is not in D[g] then
Initialize temp ← ∅
temp ← D[g]
temp.push_back (current_node)
D[g] ← temp
else if g is not a key in D then
Initialize temp ← ∅
temp.push_back (current_node)
D[g] ← temp
Q.deque ()
for each edge e (v1, v2) ∈ E, do
if v2 = current_node
Q.enqueue (v2)
done
done
done
26
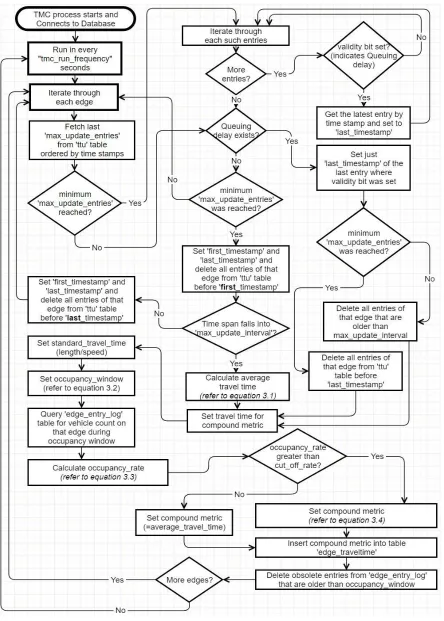
3.1.2 Maintain Current Traffic Information
TMC plays the central role for the overall setup in our approach by calculating edge travel
time and occupancy window, maintaining different table updates that can be queried by RSUs
and purging obsolete information to minimize different dynamic table entries reducing query
time. TMC runs in every ‘tmc_run_frequency’ interval indefinitely. This interval can be configured
to maximize or relax the degree of precision by which the information is processed and updated
in the central database.
The travel time sent by vehicles via RSU can be stored in a dynamic table – ‘ttu table’ in
which outdated data that are no longer needed gets deleted. For each edge, TMC first looks into
the ‘ttu table entries’ associated with that edge. It takes the latest ‘n’ number of entries that falls
into ‘m’ update interval. Both ‘n’ and ‘m’ can be variable and are configurable using ‘max update
entries’ and ‘max update interval’.
TMC application’s high level pseudocode
Start: For each edge in edge set -
I. Query travel time update entries up to the number of ‘max_update_entries’
II. For entries that fall in range of ‘max_update_interval’, calculate average travel time
III. For entries that are queueing delay update and within ‘max_udpate_interval’, set
average travel time equal to latest entry’s travel time
IV. Calculate occupancy rate within occupancy window
V. Calculate compound metric
VI. Delete outdated entries from the tables
27
The idea behind the ‘max update entries and interval’ restrictions is to limit how many
table entries should be considered in calculating the average travel time and during what window
these entries should be considered as valid, both in respect to the corresponding edge. These
restrictions provides granular control over how recently the data that are gathered should be
considered.
𝑎𝑣𝑒𝑟𝑎𝑔𝑒_𝑡𝑟𝑎𝑣𝑒𝑙_𝑡𝑖𝑚𝑒 𝑤𝑖𝑡ℎ𝑖𝑛 max _𝑢𝑝𝑑𝑎𝑡𝑒_𝑖𝑛𝑡𝑒𝑟𝑣𝑎𝑙
=∑ 𝑡𝑟𝑎𝑣𝑒𝑙_𝑡𝑖𝑚𝑒
max _𝑢𝑝𝑑𝑎𝑡𝑒_𝑒𝑛𝑡𝑟𝑖𝑒𝑠 𝑖=0
max _𝑢𝑝𝑑𝑎𝑡𝑒_𝑒𝑛𝑡𝑟𝑖𝑒𝑠 (3.1)
During the scanning of ‘ttu table’ entries, TMC also checks if any of the entries has its
‘validity_bit’ set to 1 which indicates that the given entry’s update came from a vehicle stuck
longer than 1 one ‘intersection traffic light phase cycle’ duration or, any other configurable time
based on the simulation requirement. Since an ego vehicle only transmits a ‘ttu’ when it
completes an edge trip, vehicles stuck in an intersection due to onward congestion never gets to
transmit that. A ‘ttu update’ with its ‘validity_bit’ set to 1 solves this problem by differentiating a
regular ‘ttu’ with a ‘ttu’ transmitted by a stuck vehicle. The necessity becomes more obvious
when TMC considers a ‘ttu table’ entry of a particular edge without meeting the requirement of
‘max_update_entries’ as there wouldn’t be enough entries to consider during as intersection
queuing delay. If TMC finds multiple entries with the ‘validity_bit’ set to 1, it considers the entry
with the latest timestamp. This can be achieved by having the ‘last_timestamp’ of the entries
28
The ‘average_travel_time’ is calculated using equation 3.1 and in the case where the
number of entries for an edge had not reached ‘max_update_entries’ but there was an entry
with the ‘validity_bit’ set to 1, the travel time posted by such entry is immediately considered
and set as the travel time for that edge.
Once the travel time is calculated, an ‘occupancy_rate’ value is measured for given edge
within the ‘occupancy_window’ – a time window that spans standard travel time for that edge.
‘occupancy_rate’ itself reflects how much length of an edge is occupied with vehicles. From
empirical point of view, higher occupancy should result in longer ‘intersection queuing delay’
resulting in longer wait time. So, we have considered this rate to be counted in the final metric
calculation of edges.
𝑜𝑐𝑐𝑢𝑝𝑎𝑛𝑐𝑦_𝑤𝑖𝑛𝑑𝑜𝑤 = 𝑙𝑎𝑡𝑒𝑠𝑡_𝑡𝑖𝑚𝑒𝑠𝑡𝑎𝑚𝑝 − 𝑒𝑑𝑔𝑒_𝑙𝑒𝑛𝑔𝑡ℎ
𝑒𝑑𝑔𝑒_𝑠𝑝𝑒𝑒𝑑 (3.2)
𝑜𝑐𝑐𝑢𝑝𝑎𝑛𝑐𝑦_𝑟𝑎𝑡𝑒 = (𝑣𝑒ℎ𝑖𝑐𝑙𝑒_𝑐𝑜𝑢𝑛𝑡 𝑖𝑛 𝑜𝑐𝑐𝑢𝑝𝑎𝑛𝑐𝑦_𝑤𝑖𝑛𝑑𝑜𝑤 ∗ 𝑠𝑡𝑎𝑛𝑑𝑎𝑟𝑑_𝑣𝑒ℎ𝑖𝑐𝑙𝑒_𝑙𝑒𝑛𝑔𝑡ℎ)
𝑒𝑑𝑔𝑒_𝑙𝑒𝑛𝑔𝑡ℎ ∗ 100
(3.3)
The ‘compound_metric’ is finally calculated with full weight of ‘average travel time’ and
partial weight of ‘occupancy_rate’. The weight is configurable as desired by setting the value to
‘occupancy_weight’ variable. The rationale for not considering a full weight of ‘occupancy_rate’
is to cap the metric value as there exists edges of short length in simulation that can produce
close to 100% occupancy rate with a few vehicles present.
29
30
3.2 Vehicle OBU Functionality
3.2.1 Send Travel Time Updates
As a vehicle enters an edge, it stores the ‘start time’ on that edge which is subtracted
from the ‘end time’ as the vehicle completes travelling that edge for finding the travel time. On
completion, it construct ‘ttu’ packet that holds the travel time for last completed edge and
broadcast it over the DSRC medium. In case of last edge being empty where the vehicle just
started its trip or, the last edge is an internal edge adjoining intersections, it ignores travel time
calculation for that edge. The ego vehicle also keeps track of idle time on any edge to find if it’s
waiting more than the queuing delay threshold. The threshold in this case is a value that is
configurable and ideally set to the total phase time of traffic light of the given intersections in the
simulation run. If the ego vehicle is waiting over this threshold in an edge, it immediately
construct ‘ttu’ message without completing travel on that edge. During ‘ttu’ packet construction,
it identifies the delay by setting the ‘validity_bit’ of the packet to 1. In such case, it also sets the
travel time equal to the combined time it spent on that edge at idle and mobile state.
3.2.2 Update Vehicle Route
If the ego vehicle receives a ‘tum’ message from RSU, it creates copy of its map (i.e. Graph)
and update the edge cost(s) as retrieved from the ‘tum’ message into the copied graph. It then
calculate new route using the proposed Fuel Efficient Route Planning (FERP) algorithm. FERP uses
an A* search algorithm to calculation the ‘best’ route from the ego vehicle’s current location its
destination. Once the new route is calculated, it submits the route as active in TraCI and discard
31
edge metric is received by the ego vehicle. Figure 3.4 depicts the high level process flow chart for
the vehicle application.
Figure 3.4 Vehicle application flowchart1
A benefit of A* over Dijkstra’s algorithm use for our purpose is to limit the algorithm’s
32
shortcoming of Greedy Best First Search algorithm (that occasionally miscalculates the shortest
path) by using both actual distance from starting point and estimated distance to goal instead of
just considering estimated distance alone. The proposed heuristic (FERP) uses –
𝑓(𝑛) = 𝑔(𝑛) + ℎ(𝑛)
𝑤ℎ𝑒𝑟𝑒, ℎ(𝑛) = |𝐴 − 𝐵| 𝑚𝑜𝑑 𝑙
Here f(n) is heuristic function, g(n) represents actual cost to current point, h(n) is the
heuristic cost to reach the destination from current point and A and B are location coordinates
of current point and destination. To make the heuristic function admissible i.e. to prevent
overestimation we mod of the absolute distance of two points by the shortest edge length in the
simulation.
Although our implemented graph engine constructs the graph using nodes and directed
edges, queries to FERP was made through both nodes and edges rather than one of them alone.
The node based adjacency and construction allows the graph to store coordinates for individual
nodes that are required to produce heuristic function values for FERP, whereas edge adjacency
list was consulted for neighbors and shortest path trace back for reason of driving permissibility
– which defines whether permission to enter an edge is valid from the current edge. This is
important since, there are traffic restrictions that disallow driving from an edge to another edge.
This is analogous to the real life traffic restriction scenarios such as ‘no left or right turn is
33
as there are valid edges and lower metrics, but infeasible since right turn is not allowed from
edge i → j to edge j → k.
Figure 3.5 Driving permissibility is required to be consulted for correct operation of FERP1
FERP algorithm pseudocode
Define ‘start’ and ‘end’ edge for source and destination
For trace back of already crossed edges, define dictionary, C ← ∅
For holding minimum cost to reach an edge so far, define dictionary M ← ∅
For travel time from ‘start’ to current edge, define g
For lowest estimated travel time from current edge’s end node to ‘end’ edge’s end node, define h
Define f , which holds combined cost of g and h
For current edge, define c
For holding explored edges and cost of reaching those edges, define Priority Queue, Q ← ∅
34 C[start] ← none
M[start] ← 0
While Q is not empty do
c ← Q.deque ( )
if c is ‘end’ then
break
for each driving permissible neighbor k of edge c do
g ← M[start] + actual cost to reach k from c
If k is not in M and g < M[k] then
M[k] ← g
f ← g + h(k, end)
Q.enque(k, f)
C[k] ← c
3.3 RSU Functionality
RSU application is hosted in the fixed RSU nodes in selected junctions as will be described
in section (4.1.5). It acts as a bridging point for receiving ‘ttu’ packets from nearby vehicles and
transfer them over to TMC for processing. Once the application is initialized and connection to
TMC’s database is made, RSU application processes two kind of messages. The first type is a
self-message set at predefined regular interval which prompts a given RSU to query TMC’s database
for metric updates of edges that the RSU is responsible for. If metric updates are available, the
metrics are encapsulated in ‘tum’ message and broadcasted over the DSRC medium. The second
type is a ‘ttu’ message broadcasted by an ego vehicle. The ‘ttu’ message contains information of
a vehicle’s entry timestamp to the current edge, travel time for previous edge and whether the
35
updated to the TMC’s database for further analysis. A high level process flowchart for this
application is depicted in figure 3.6.
36
4. Experiment Setup and Results
4.1 Experiment Setup
To experiment our proposed approach, we used three simulation tools, SUMO, OMNET++
and VEINS as introduced in section 2.2. For traffic generation, SUMO requires a set of xml files
that describes the road network and traffic demand. The network file also needs to be converted
to graph form so the vehicle application can query routes using A* algorithm. In the following
subsections, we will describe the processes used for extracting necessary files for the experiment
setup. Table 4.1 introduces some terminologies that will be used in the following sections.
Table 4.1 Notations used in experiment 1
Notation Description
‘.net’ Used by SUMO to realize map database
‘.osm’ Open Street Map file extension
NETCONVERT A python script that generates 'net' file from .osm format
‘xml_to_txt.py’
A python script that extracts sets of relevant junction and edge parameters
from the 'net' file.
‘.ned’
Network descriptor file used by OMNET to define parent and sub modules of the network simulation
‘.ini’
An initialization file that describes parameters for modules defined in
'.ned'
‘omnet_coord.txt’ Text file containing OMNET specific coordinates of junctions
‘traci_coord.txt’ Text file containing TraCI specific coordinates of junctions
‘inter_junction_finder.py’
A python script that selects candidate junctions from 'net' file for RSU
placement
‘junc_coord_extract.py’
A python script that generates RSU coordinates in format acceptable to
37
‘graph_input.txt’ produced by 'xml_to_txt.py' script and used for graph construction
‘rsu_junction_bind.txt’ Text file containing junction id and RSU id pairs
‘Edge_RSU_Relation.h’
An application that associates edges to RSUs in a many to many
relationship and exports the relationship into TMC's database
‘VEINS Extraction Run’
A simulation run in which 'omnet_coord.txt' and 'traci_coord.txt' files are
created and populated. Actual vehicle simulation run is skipped
‘VEINS Simulation Run’ Vehicles are simulated in this run
4.1.1 ‘.net’ file generation
.net file is an XML file that mainly defines how the junctions and edges are associated,
what are the connections between edges and between internal and external edges, what lanes
are available to each edges and their types, direction and permissions. The .net file is generated
using the NETCONVERT tool where input is a 4x4 square kilometers of University of Windsor’s
surrounding area map with .osm extension (OSM stands for Open Street Map). In our simulation,
the .net file is processed using ‘xml_to_txt.py’ python script.
4.1.2 Graph node and edge extraction
The ‘xml_to_txt.py’ script extracts the XML elements using python’s ‘ElementTree XML
library’ and produces three text files as output – ‘graph_input.txt’, ‘graph_edges.txt’ and
‘edge_adjacency.txt’. These output files are then processed using other scripts and graph engine
(a C++ file that maintains the graph) for graph creation and references to adjacencies of nodes
38
4.1.3 Internal junction and edge elimination
Connectivity between lanes through junctions are defined using internal junctions and
internal edges and these falls under the same tree element in the .net file as normal junctions
and edges. These internal junctions and internal edges are eliminated during the processing of
the three above mentioned output files by the ‘xml_to_txt.py’ python script since they will not
be used during graph construction. Also, edges that are only for pedestrians, trams, rails and
bicycles are also eliminated during processing of output files since vehicles will avoid those
routes.
4.1.4 Node, edge and RSU association, and driving permissibility
The graph engine maintains ‘list of nodes’ as junction dictionary and ‘list of edges’ that
holds the junction pairs to form directed edges between them. In addition, an ‘edge adjacency
list’, constructed by the ‘xml_to_txt.py’ script, is maintained that determines whether an edge is
associated to another edge in terms of ‘driving permissibility’ - as described in section 3.2.2. Also,
this ‘edge adjacency list’ filters out the edges that are dead ends and as such, those edges are
not associated with any other edges. The ‘Edge_RSU_Relation.h’ from the graph engine takes
care edge-RSU association using our proposed algorithm in 3.1.1.
4.1.5 RSU placement selection
RSUs are placed at every junctions except where the junction itself represents node of a
dead-end edge. This is done through the use of a python script ‘inter_junction_finder.py’ which
39
script ‘junc_coord_extract.py’. The purpose of this script is to define the placement of junction
definitions according to the corresponding formats acceptable by .ned (Network Descriptor) and
.ini (OMNET initializer) files. When producing the formats, the ‘junc_coord_extract.py’ script
cross reference ‘inter_junction.txt’ file for selecting the junction set for RSU placement that
intersects with the set of junctions listed in the text file.
‘junc_coord_extract.py’ script also takes two other files as input – ‘traci_coord.txt’ and
‘omnet_coord.txt’, for the purpose of producing corresponding coordinates accepted by the .ned
and .ini files mentioned above. The differences in such coordinates between OMNET and SUMO
for any point in the playground (the area where simulation runs) comes from the fact that the
point of origin for each systems are calculated differently. Thus an RSU’s placement coordinates
that works for SUMO will not work for OMNET and hence needs the above adjustment. The text
files ‘traci_coord.txt’ and ‘omnet_coord.txt’ are produced by Car node’s extraction run which will
be explained in section 4.1.8.
4.1.6 Database setup
MySQL version 4.1 is used for simulation parameter recordings as this version integrates
well with OMNET++. A series of pre-configured signals is emitted during simulation run from
OMNET++ which subsequently gets captured by ‘cMySQLOutputVectorManager’ and
‘cMySQLOutputScalarManager’ libraries of OMNET++. The captured signals are recorded directly
40
While the simulation vector data and scalar data such as trip time, CO2 emission, speed,
acceleration etc. automatically gets recorded into ‘test’ database during simulation runs, an
additional database named ‘traffic_monitoring_center’ records data sent by RSUs and data
processed by TMC application. It is to be noted that CO2 emission is calculated by VEINS using
statistical model proposed in [30].
Table 4.2 Tables used in the database1
Table Purpose
‘all_edges’ Holds edge properties such as ‘edge_id’, length and speed
‘edge_entry_log’ * Timestamps of vehicles entering edges, for ‘occupancy_rate’ calculation ‘edge_traveltime’ * Edge metrics for broadcasting
‘junction_edges’ Edges that a junction’s RSU is responsible for ‘rsu_junctions’ RSUs to junctions bindings
‘ttu’ * Travel Time Update for respective edges
* indicates entries are dynamically saved and purged
4.1.7 TMC setup
TMC application is developed using C++ and it interfaces with central database hosted in
MYSQL. As updates are pushed from RSUs to the central database interfacing TMC, TMC process
the updates through a series of steps described in section 3.2 to acquire relevant information,
store the information into relevant tables which in turn will be queried by RSUs for dissemination.
41
Figure 4.1 High level setup of the experiment1
4.1.8 Vehicle setup
Vehicle application is a C++ program that defines the behavior of a vehicle during
simulation run. In addition to that, this application also facilitates extracting OMNET++ and SUMO
coordinates for RSU placements as they are differently setup and have different values for
corresponding .ini and .ned files described earlier in section 4.1.5. In the application itself, an ego
42
time such as speed, acceleration, current edge etc. along with other simulation parameter values
using VEINS internal framework tool known as ‘TraCICommandInterface’.
4.1.9 Vehicle – RSU interaction
Vehicles interacts with RSU using two types of messages – ‘ttu’ (Travel Time Update) and
‘tum’ (Traffic Update Message). ‘ttu’ is sent by the ego vehicle to advertise the last completed
edge’s travel time whereas ‘tum’ is sent by the RSUs to advertise travel time information of a set
of prospective edges that the ego vehicle can choose for its route planning. Both of these
messages are an extension of WSM (Wave Short Message), which is the default message type
from the WAVE protocol stack using WSMP protocol. The messages add relevant information
such as completed edge ID, current edge ID, travel time, vehicle ID etc. based on the message
type before encapsulation down to MAC layer for transmission over 802.11p medium.
4.1.10 Route file / Demand generation
Route file describes when and which vehicles are inserted into the simulation containing
predefined edges to be taken. In our experiments, we have used route file generated by SUMO’s
built in script ‘randomtrips.py’ where the input is University of Windsor’s surrounding area’s .net
file. Two route files were generated for experiment – first, with an insertion rate of 1 vehicle per
0.20 second and insertion window of 0 to 400 seconds of the simulation run and second, with an
insertion rate of 1 vehicle per 0.15 second and insertion window of 0 to 500 seconds of the
43
source and destination of demand routes are 10 times more likely to be on the map edges rather
than on the center of the map.
4.2 Results
We have run two sets of simulations with the scenario summarized in table 4.3. The first
set of runs was with 2500 vehicles and the second set of runs with 3300 vehicles. With the first
set as shown in table 4.4, we found the best result with the combination of 55 seconds queuing
delay and 2 hops of Edge-RSU relationship. Since the improvement was marginal, we run the
second set of simulations with 3300 vehicles to put more stress into the road network.
Table 4.3 Summary of simulation properties1
Number of edges for vehicles 465
Total edge length for vehicles 98.09 km
Number of RSUs 200
EDGE-RSU associations with 2 hops 4230 EDGE-RSU associations with 3 hops 7536 EDGE-RSU associations with 4 hops 11579 EDGE-RSU associations with 5 hops 16171
RSU query TMC at every 4 sec
With the second set as shown in table 5.5, we found the best result with the combination
of 55 seconds queuing delay and 5 hops of Edge-RSU relationship. This resulted in 8% decrease
44
Figure 4.2 Screen capture of the simulation run from OMNET++1
We compared this best result without the presence of queuing delay factor. The result
shows with queuing delay factor we can achieve better efficiency in terms of aggregated trip time
and C02 emission. The result is summarized in table 4.6.
Table 4.4 Result of setup 1
Setup 1
Number of vehicles 2500 with insertion window 0 - 400 sec Dynamic
Route planning
Queuing Delay Edge-RSU relationship Aggregated trip time of all vehicles (in seconds)
Total C02 emission
No No 2 hops 82835 283836.58
Yes 35 seconds 2 hops 112206 309496.65
Yes 45 seconds 2 hops 104263 295971.14
Yes 55 seconds 2 hops 81996 279397.81
Yes 65 seconds 2 hops 81493 279068.95
45
Table 4.5 Result of setup 21
Setup 2
Number of vehicles 3330, insertion window 0 - 500 sec Dynamic
Route planning
Queuing Delay Edge-RSU relationship
Aggregated trip time of all vehicles (in seconds)
Total C02 emission
No No N/A 193701 508309.84
Yes 45 seconds 2 hops 157452 474846.65
Yes 55 seconds 2 hops 171688 490034.15
Yes 65 seconds 2 hops 157552 476243.29
Yes 75 seconds 2 hops 166634 480298.64
Yes 45 seconds 3 hops 154439 470269.69
Yes 55 seconds 3 hops 151234 465187.23
Yes 65 seconds 3 hops 157005 474678.55
Yes 75 seconds 3 hops 174675 491239.55
Yes 45 seconds 4 hops 159098 474087.41
Yes 55 seconds 4 hops 159626 474617.39
Yes 65 seconds 4 hops 197380 521643.51
Yes 75 seconds 4 hops 209215 534864.04
Yes 45 seconds 5 hops 176426 497980.34
Yes 55 seconds 5 hops 151673 464810.08
46
Table 4.6 Performance comparison with no dynamic route planning and no queueing delay1
Dynamic Route planning
Queuing Delay (in seconds)
Aggregated trip time of all vehicles (in seconds)
Total C02 emission
Decrease in aggregated trip time (%)
Decrease in Total C02 emission (%)
Yes* No 170034 484709.77 12.22 4.64
Yes* 55 seconds 151673 464810.08 21.70 8.55