Division 05
EVALUATION OF VIBRATION PROPAGATION OF REINFORCED
CONCRETE STRUCTURES SUBJECTED TO IMPACT LOADING
Sara Ghadimi Khasraghy1, Amin Karbassi1, Christian Schneeberger2, Peter Zwicky1
1
Basler & Hofmann AG, Consulting Engineers, Zurich, Switzerland 2
Swiss Federal Nuclear Safety Inspectorate ENSI, Brugg, Switzerland
ABSTRACT
Vibrations induced by impact loading on a structure can propagate through it and need to be considered while designing and evaluating structures exposed to impact and their components. Considering the structures subjected to impact, however, the local response of the structure behind the impacted area has been a topic of interest and the vibration propagation throughout the connecting structural elements and systems have not been researched extensively.
The third part of the OECD/NEA IRIS benchmark program (Improving Robustness assessment
methodologies for structures Impacted by miSsiles), launched recently, aims at extending the experience
gained from the two previous phases of the program. IRIS Phase 3 focuses on the propagation of the induced vibrations of structures subjected to a missile impact and on the transmission of these vibrations from the impacted wall to the connected walls and floors. In a round robin study of impact test data, various predictions by participating teams will be compared. IRIS Phase 3 tests are funded by several institutions including ENSI, EDF, IRSN, and STUK.
This paper outlines one contribution of the Swiss Federal Nuclear Safety Inspectorate ENSI and its consultant Basler & Hofmann AG in the IRIS Phase 3 benchmark. Numerical evaluation of the reinforced concrete structures subjected to impact loading and the results obtained from three-dimensional nonlinear explicit finite element analyses (including accelerations, displacements, and their response spectra) are discussed here. The predictions aim at improving the modelling and understanding of the overall structural response under impact loading and at drawing conclusions based on the main parameters influencing the structural vibrations.
INTRODUCTION
The Nuclear Energy Agency (NEA) of the Organization for Economic Co-operation and Development
(OECD) launched a benchmark project called IRIS. The acronym IRIS stands for Improving Robustness
Assessment Methodologies for Structures Impacted by MissileS. The first phase was called IRIS 2010 which was followed by the second phase IRIS 2012. The objective of the first two phases was to predict the non-linear, dynamic behaviour of the missile and the reinforced concrete target for three separate impact scenarios.
This paper outlines the contribution of ENSI and their consultants Basler & Hofmann AG to IRIS Phase 3. Calibration models (VTT tests V1) as well as numerical simulations of IRIS Phase 3 mock-up are described in this paper.
EXPERIMENTAL TEST DESCRIPTION
Test V1
The vibration propagation and damping test V1 was carried out as a part of the IMPACT III (impact of an aircraft against a structure) project, which is organized by VTT Technical Research Centre, Finland and funded by several institutions.
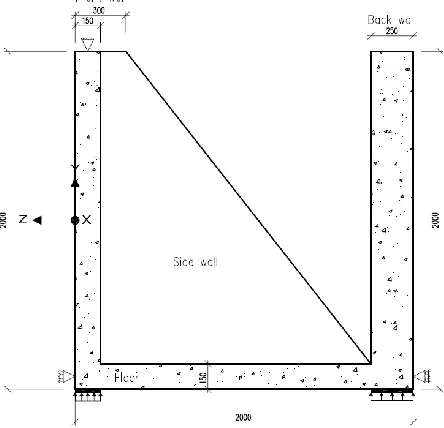
The test setup comprised of a reinforced concrete body with a front wall (subjected to impact), a connecting floor, a rear wall, as well as two triangular side walls (Figure 1). The size of the walls was 2 m in all directions. The thicknesses of front and rear walls were 0.15m, and 0.25m, respectively. The floor slab had a thickness of 0.15m. The testing structure was simply supported in horizontal (loading) direction, and was resting on elastomeric bearing pads in vertical direction.
A concrete class of C40/50 and a reinforcement yield strength of approximately 500 MPa was used. Details of the testing structure and supporting condition is outlined in Schneeberger et.al (2014).
Figure 1. Experimental setup for the test series V1
IRIS Phase 3 Mock-up
The IRIS Phase 3 mock-up test is a reinforced concrete 2.5 m wide specimen. The structure as seen in Figure 2 comprises a front “impacted” 2.0 m wall, a rear 3.0 m wall, as well as lower and upper connecting floors. All walls and floors are 0.15 m thick, except for the lower connecting floor, which has a thickness of 0.4 m. The test specimen is supported on four supporting pipes, which are assembled on a steel support structure frame.
Figure 2. Experimental setup for the IRIS Phase 3 mock-up
NUMERICAL ANALYSES
Method and Assumptions
Numerical simulations are carried out applying finite element method that uses explicit solutions of LS-DYNA software (R 8.0) for three-dimensional modelling of the impact on a reinforced concrete structure. Both predictions performed here are blind calculations.
It is assumed for both tests that the steel support structure frames provide enough stiffness and large target deformations are not expected. A perfect bond is assumed between concrete and reinforcement. Numerical simulations are carried out by fully modelling the impacting projectile.
Element Types and Finite Element Mesh for Test V1
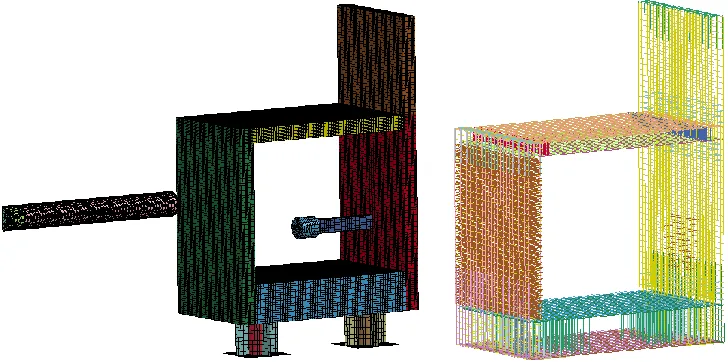
Figure 3. Finite element mesh of test V1 and its reinforcement layout
Element Types and Finite Element Mesh for IRIS Phase 3 Mock-up
The reinforced concrete structure here is also represented by solid elements for concrete, beam elements for bending reinforcement, as well as shear stirrups. The impacting projectile, supporting pipes, as well as the pseudo-equipment are modelled by shell elements. Slabs are represented by a mesh size of 25mm×25mm×15mm, where 10 elements are defined through the impacted wall thickness. Figure 4 illustrates the finite element mesh of the structure, as well as its reinforcement layout. The connection of the concrete solid elements with steel reinforcement beam elements is defined using Lagrange-in-Solid in LS-DYNA (LS-DYNA 2014).
Figure 4. Finite element mesh of IRIS Phase 3 mock-up and its reinforcement layout
Material Models
shear strain at failure to 60%. The values for the compressive strengths, as well as the elastic modulus of concrete are taken from experiments on concrete cylinders. The details of the material model can be found in the LSDYNA keyword and theory manuals (LS-DYNA 2014).
The constitutive model for the longitudinal bars and stirrups is bilinear, with strain hardening. The reinforcements erode when the strain in the beam elements exceeds 10%. The concrete and reinforcement elements are assumed to have a perfect bond.
The impacting missiles for both tests, as well as the supporting pipe of the mock-up model are modelled using bilinear models with strain hardening. For the bearing pads of the calibration model in test V1, an elastic material model based on the initial modulus of elasticity of the 20 mm thick bearing, adapted from its compression stress diagram, is used.
Loading and Support Conditions
The initial position of the impacting missiles is defined at the surface of the impacted wall to save computation time. The missile is then subjected to a predefined initial velocity. At the same time the rest of the model is subjected to acceleration due to gravity, to account for the self-weight of the structure. The analysis has been carried out with an impact velocity of 114 m/s for V1A test. The IRIS Phase 3 mock-up was subjected to two impacts with a velocity of 90m/s and a third impact with a velocity of 170 m/s. The numerical analyses here do not take into consideration the effect of consecutive impacts on the wall. therefore, two impact tests with velocities of 90 m/s (1st impact) and 170 m/s (3rd impact) have been analysed. The second impact test for the IRIS Phase 3 mock-up had the same impact velocity as the first one.
Symmetrical arrangements have been taken into consideration, where for both models only half of the test bodies and the impacting missiles are modelled. Contact surfaces are defined between the missiles and the concrete walls, as well as between the missiles and the reinforcement (if the missile penetration allows such a contact). The contact forces between relevant members are calculated by applying the penalty method. Eroding contact options are employed here, which allow deletion of the eroded elements.
The movement of the outer nodal points of the elastomeric bearing pads (V1 test) is restrained in the vertical direction. In support areas, horizontal and vertical displacements are restrained. For the IRIS Phase 3 mock-up model, the outer nodal points of the supporting pipes have been defined using fixed boundary conditions.
The damping is mainly accounted for by the material energy dissipation through material nonlinearity. A low additional Rayleigh damping of 1% is considered for the V1 test model.
PREDICTED RESULTS AND COMPARISON FOR V1 TEST
Impact Load Time Histories
Figure 5. Comparison of impact load time histories for V1A test
Deflection Time Histories
The calculated and measured deflections of the structure are plotted as a function of time in Figure 6. The values are compared at the location of three displacement measurement sensors. In this figure, P1 represents horizontal deflections at the centre of the front wall behind the loading area, P2 is the comparison of horizontal deflections at the top of the rear wall, and P3 represents vertical deflection at the bottom of the rear wall. The maximum and residual deflections at the centre of the front wall due to the impact loading is well predicted. The displacements of the rear wall are not very well predicted by finite element analysis. This may be due to simplified linear elastic modelling of the support bearing pads. Moreover, the basic modelling assumption that the supporting steel frame structure does not influence the results was not fully supported by the experimental outcome, in which the results for the similar impact velocities could not be reproduced.
Figure 6. Comparison of deflection time histories for V1A test
Support Reaction Forces
Figure 7. Comparison of horizontal support reaction forces for V1A test
Strains of Bending Reinforcement
Strain time histories of bending reinforcements are compared to the measured values for two strain gauges, in the centre of the front wall below the loading area, in Figure 8. Sensor V1 and H1, represent the strains in the vertical direction and the horizontal direction, respectively. The maximum vertical strains are in a good agreement, but the calculated maximum horizontal strain is higher than the measured value.
Figure 8. Comparison of strains at the centre of the front wall for V1A test
Acceleration Response Spectra
a) b)
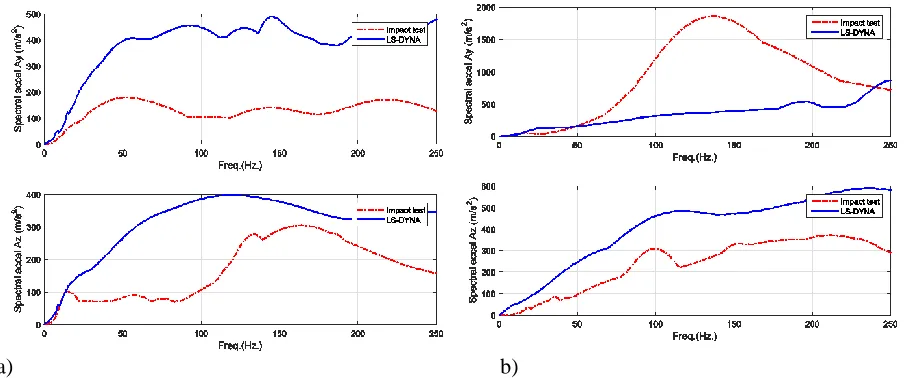
Figure 9. Acceleration spectra for V1A test at a) centre of the back wall, b) centre of the connecting floor, spectral damping 5%
PREDICTED RESULTS FOR IRIS PHASE 3 MOCK-UP
Impact Load Time Histories
For IRIS Phase 3 mock-up, the history of contact forces between missile and the impacted front wall
(impact load time histories) are plotted for 1st impact (90 m/s) and 3rd impact (170 m/s) in Figure 10. The
predicted missile shortening after 1st and 3rd impacts were 896 mm and 1559 mm, respectively.
a) b)
Figure 10. Predicted impact load time histories for IRIS Phase 3 mock-up for a) 1st impact and b) 3rd
impact
Deflection Time Histories
Figure 11 shows the deflections at the centre of the impacted wall below the loading area in the loading
direction for both impact velocities. The maximum calculated deflections for the 1st and 3rd impacts were,
a) b)
Figure 11. Predicted deflection time histories at the centre of the impacted wall for IRIS Phase 3 mock-up for a) 1st impact and b) 3rd impact
Strains of Bending Reinforcement
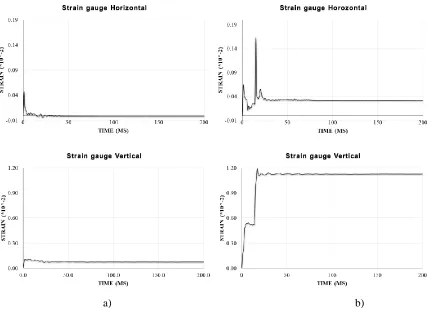
The reinforcement strain time histories are shown in Figure 12 for the sensors located at the centre of the front wall in the horizontal H and vertical V directions. For the 1st impact strains are much below the reinforcement yielding values, which imply that the reinforcements remain elastic. The reinforcement yield is observed for the 3rd impact at the wall centre below the loading area.
a) b)
CONCLUSION
Finite element analyses using explicit solutions with LS-DYNA software have been performed here for blind prediction of missile impacts on reinforcement concrete structures. Two impact tests, namely VTT test V1, as well as the IRIS Phase 3 mock-up were modelled. Several conclusions can be drawn based on the work performed and partially by comparison of the calculated results to the experimental measurements. The blind results obtained can be potentially improved by calibrating the model assumptions with the experimental data.
Test V1
The impact of the missile with an initial velocity of 114 m/s was simulated and the results were compared to the performed experiments. Numerical analysis performed well in realistically predicting the impact response of the structure. The local impact response of the specimen, such as horizontal displacements of the front wall, horizontal support reactions, and bending strains was predicted reasonably well. The global response of the test body, on the other hand (e.g. accelerations in the vertical direction and vertical displacement), was not so well predicted; this is mainly due to the challenges in realistically modelling the supporting conditions. Due to the complexity of the support condition, in which the supporting structure influenced the test results, calibration of the model assumptions with the test results was not performed for this test.
IRIS Phase 3 Mock-up
The impact response of the test specimen was analysed for impact velocities of 90 m/s and 170 m/s. The model with the velocity of 90 m/s showed no perforation or radial cracking of the impacted wall. The failure (erosion) of elements at the impact location predicted a small scabbing in the front wall. Additionally, the reinforcement strains indicated an elastic response of the front wall. When subjected to an initial velocity of 160 m/s, the model showed no perforation of the front wall. However, the residual displacement and plastic strains indicated a high damage in the front wall. Yielding of bending reinforcement was observed for this case below the loading area, which demonstrates a nonlinear response of the front impacted wall. The results of these blind calculations will be compared to the experimental data in IRIS Phase 3 numerical workshop, which is planned in June 2017.
REFERENCES
Hervé, G. (2016). “Description of IRIS Phase 3 Project”, EDF, Revision C.
LS-DYNA (2014). “Theory Manual”, Livermore Software Technology Corporation, Complied by J. O. Hallquist.
LS-DYNA (2014). “Keyword User’s Manual”, Version 971, Livermore Software Technology Corporation.
Schneeberger, C., Borgerhoff, M., Stangenberg, F., Zinn, R. (2014). “Analysis of vibration propagation
and damping tests of reinforced concrete structures within IMPACT III Project”, Proceedings of the
9th International Conference on Structural Dynamics, EURODYN 2014, Portugal, 3525-3532. Riera, J. D. (1968). “On the Stress Analysis of Structures Subjected to Aircraft Impact Forces,”