ISSN(Online) : 2320-9801
ISSN (Print) : 2320-9798
I
nternational
J
ournal of
I
nnovative
R
esearch in
C
omputer
and
C
ommunication
E
ngineering
(An ISO 3297: 2007 Certified Organization)
Vol. 4, Issue 4, April 2016
Stone Texture Classification and
Discrimination by Edge Direction Movement
Dr. D.Siva Kumar
Professor, Department of ECE, S V College of Engineering, Tirupati, A.P, India
ABSTRACT: Texture discrimination is the rich field in the area pattern recognition and pattern analysis. The texture
classification is the one of the major field in texture discrimination. In this paper derive an approach for texture group classification based on the direction movement. The edge movements are identified in each 3×3 window of the texture image. Based on the edge direction movements the texture images are categorized. Two texture groups used in this paper. Texture group 1 consists of Bark, Sand, Raffia and Pigskin images and Straw, Bsand, Wgrain and Grass image are treated as texture group2. In this paper, Horizontal, Vertical direction and also Right, Left Diagonal Edge direction movements are identified.
KEYWORDS: Edge Direction movements, texture classification, pattern recognition, texture group
I. INTRODUCTION
In Image processing, Texture analysis and classification plays a major role. The major areas are stone texture classification, medical imaging, quality of stone detection, character recognition, object detection and retrieval and remote sensing. Originally, texture mainly consists of uniform and non uniform patterns. The texture classification has two major problems such as extracting the best features for text the best classification technique for classification with selected features.
So many approaches are available in the literature for texture classification. The first and top most approach is Local Binary Pattern (LBP) approach [1, 2]. But LBP approach has some disadvantages like if the central pixel value changes at least 1, the LBP value is drastically changes. Some other approaches are Texture classification by statistical learning from morphological image processing [3], Texture classification based on random threshold vector [4], The main goal of texture classification is to classify images into homogeneous classes that have the same textural pixels [5]. Ashour et.al used Multidirectional Gabor filter to classify Engineering Machined dataset into six classes based on Principal Components Analysis (PCA) and Artificial Neural Network classifier [6]. A number of algorithms are designed for feature extraction of a texture image from the past 2 decades [7, 8]. Other approaches for texture classification are marble texture description [9], skeleton extraction of texture [10], long linear patterns using wavelets [11] wavelet transform [11, 12, 13]. And Gabor filters [14].
Study of patterns is the one of the popular approach for analysis and categorization of stone texture images. Recently, textures are classified into various categories by using various pattern ethods like long linear patterns [15, 16], edge direction movements [17] preprocessed images, marble texture description [18] and Avoiding Complex Patterns [19], Textures are also illustrated and classified by using various wavelet transforms: one based on primitive patterns [20], and another one based on statistical parameters [21].Ravi et al proposed a stone texture classification method based on texture patterns [22]. From the above literature, observe that no study has attempted to classify the textures with good classification results by using edge movement pattern approach with good classification results. The present paper attempted to classify the texture images based on Edge Movement approach.
ISSN(Online) : 2320-9801
ISSN (Print) : 2320-9798
I
nternational
J
ournal of
I
nnovative
R
esearch in
C
omputer
and
C
ommunication
E
ngineering
(An ISO 3297: 2007 Certified Organization)
Vol. 4, Issue 4, April 2016
II. PROPOSED METHOD: TEXTURE DISCRIMINATION USING FREQUENCIES OF EDGE MOVEMENTS
The present paper extends the concept on neighborhood and proposed a novel method of discriminating textures by using edge movement on a 3×3 window of the texture image. The edge moments of the texture image mainly consists of 4 steps. In the first step, covert the input color image into gray level buy using the HSI color model. Apply opening operation on the input image for removing the small objects from the foreground in the second step. In the third step, find the frequencies of the edge movements in each grey image. Based on the frequency occurrence of the edge movements, plot a graph for classifying the stone textures into four ?
the entire process is shown in figure1. Step1: Color to Grey using HSI color model:
Various color models are available in the literature for image processing. Generally, the color images are represented by using RGB. Here RGB is the color components: R-Red, G-Green and B-Blue. TO achieve the better features from the color image need to convert into another model. The present paper used the HSI color model. The HSV color model also has 3 components: Hue,
Saturation and Intensity. The Hue is a attribute of color which represents the dominant color component in RGB. The Saturation is an expression of the relative purity or the degree to which a pure color is diluted by white light. HSV color describes color relationship more accurately
ISSN(Online) : 2320-9801
ISSN (Print) : 2320-9798
I
nternational
J
ournal of
I
nnovative
R
esearch in
C
omputer
and
C
ommunication
E
ngineering
(An ISO 3297: 2007 Certified Organization)
Vol. 4, Issue 4, April 2016
Opening of the texture Image:
Opening is a morphological operation that generally smooth’s the contour of an object, breaks narrow isthmuses and eliminates thin protrusions. The present study advocates a new statistical method for classification of textures on the opening of the image.
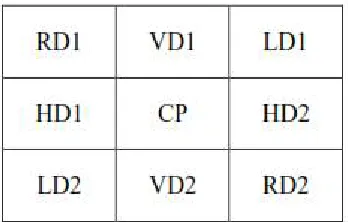
Find the Edge movement direction: n edge is a property connected to an individual pixel and is figured from the picture capacity conduct in an area of that pixel. with two segm ents, greatness and heading. The edge greatness is the size of the slope, and the edge course ø is turned regarding the inclination heading ψ by - 90 degrees. The inclination heading gives the course Opened Image of most extreme development of the capacity. The edge movement is find out in each 3×3 window of the image. The pixel positions in each 3×3 window is shown in figure 2.
Fig -2: A 3×3 window with 8-neighborhood that forms 4 directional vectors
The present paper finds out the edge movements by using the following algorithm.
Algorithm 1: Calculation of edge movement frequencies
BEGIN
Step1: Initialize FHG, FVG, FRDG and FLDG. Step2: Find HG=|HD1-HD2| and VG=|VD1-VD2| RDG=|RD1-RD2| and LDG=|LD1-LD2|
Step3: Find MAX (HG, VG, RDG, LDG) and increase the corresponding frequencies.
If MAX (HG, VG, RDG, LDG) is equal to HG then FVG=FVG+1;
If MAX (HG, VG, RDG, LDG)is equal to VG then FHG=FHG+1;
If MAX (HG, VG, RDG, LDG)is equal to RDG then FLDG=FLDG+1;
If MAX (HG, VG, RDG, LDG)is equal to LDG then FRDG=FRDG+1;
Step4: Repeat the steps 2 to 3 for entire image on convolution basis on a 3x3 window.
Step5: G1= FHG+FVG and G2=FRDG+FLDG Step6: Plot the graph of G1 on various textures. Plot the graph of G2 on various textures. END.
ISSN(Online) : 2320-9801
ISSN (Print) : 2320-9798
I
nternational
J
ournal of
I
nnovative
R
esearch in
C
omputer
and
C
ommunication
E
ngineering
(An ISO 3297: 2007 Certified Organization)
Vol. 4, Issue 4, April 2016
III. RESULTS AND DISCUSSIONS
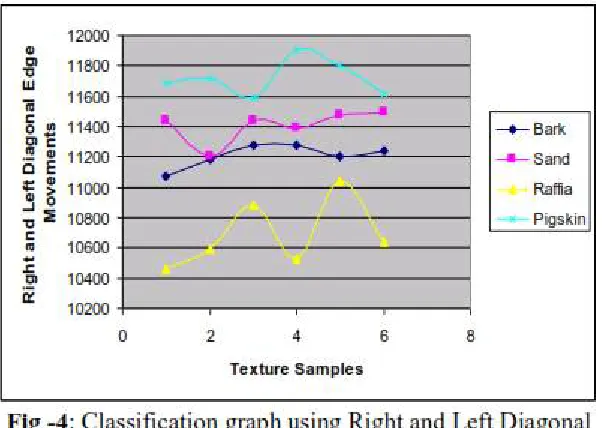
To find out the effectiveness of the proposed method it is evaluated on different texture groups the group 1(TG1) consists of Bark, Sand, Raffia and Pigskin. The frequency occurrences of the Horizontal and Vertical Edge direction movement of texture group 1 is listed out table 1 and the
classification graph is shown in figure 1. The frequency occurrences of the Right and Left Diagonal Edge direction movements of texture group 1 is listed out table 2 and the classification graph is shown in figure 3.
ISSN(Online) : 2320-9801
ISSN (Print) : 2320-9798
I
nternational
J
ournal of
I
nnovative
R
esearch in
C
omputer
and
C
ommunication
E
ngineering
(An ISO 3297: 2007 Certified Organization)
Vol. 4, Issue 4, April 2016
ISSN(Online) : 2320-9801
ISSN (Print) : 2320-9798
I
nternational
J
ournal of
I
nnovative
R
esearch in
C
omputer
and
C
ommunication
E
ngineering
(An ISO 3297: 2007 Certified Organization)
ISSN(Online) : 2320-9801
ISSN (Print) : 2320-9798
I
nternational
J
ournal of
I
nnovative
R
esearch in
C
omputer
and
C
ommunication
E
ngineering
(An ISO 3297: 2007 Certified Organization)
Vol. 4, Issue 4, April 2016
IV. CONCLUSION
Sample No. Sand Raffia Pigskin Straw Bsand Wgrain grass Bark
A clear discrimination between the textures of texture groups is visible in the graphs. To prove the further significance of the proposed method, nine similar textures from the texture groups G1, TG2 and TG3 are taken as a case study. On these eight similar textures frequencies Horizontal and vertical and Right and Left diagonal edge direction movements are calculated and plotted in the graphs shown in Fig 7 and Fig. 8. From the graphs it is evident that horizontal and vertical movements on the opening of the image clearly discriminate the nine textures. The present study concludes that in the chosen nine similar textures, horizontal and vertical movements show a significant difference. The proposed right and left diagonal edge direction movements fail in discriminating these eight similar However, the graphs in Fig. 5, 6, and indicate the usefulness of right and left diagonal edge direction movements which are discriminating, in some of the similar textures. By this, the present study concludes that 95% of the similar textures can be discriminated by horizontal and vertical edge movements after opening of the image.
REFERENCES
[ 1 ] Bovik, A. C., Clark, M. and Geisler, W. S. “Multichannel texture analysis using localized spatial filters”, IEEE Trans. Patt. Anal. Mach. Intell., 12, 1, pp. 55-73, 1990.
[ 2 ] R.M. Haralick, K. Shanmugam, I. Dinstein, “Texture features for image classification”, IEEE Transactions on System Man Cybernat, Vol. 8, No. 6, 1973, pp. 610621.
[ 3 ] Haralick, R. M. “Statistical and structural approaches to textureof 4th Int. Joint Conf. Pattern Recognition, pp. 45-60, 1979.
[ 4 ] Vijaya Kumar, V., Raju, U.S.N. , Chandra Sekaran , K. and Krishna, V. V. “ A New Method of Texture Classification using various Wavelet Transforms based on Primitive Patterns”, ICGST International Journal on Graphics, Vision and Image Processing, GVIP, Vol.8,
Issue 2, pp. 21-27, 2008
[ 5 ] Jia, W., Huang, D.S., Zhang, D.: Palmprint Verification Based on Robust Line Orientation Code. Pattern Recognition 41(5), 1504–1513 (2008)
[ 6 ] Anys, H., He, D.C.: Evaluation of Textural and Multi polarization Radar Features for Crop Classification. IEEE Transactions on Geoscience and Remote Sensing 33(5), 1170–1181 (1995)
[ 7 ] Ji, Q., Engel, J., Craine, E.: Texture Analysis for Classification of Cervix Lesions. IEEE Transactions on Medical Imaging 19(11), 1144–1149 (2000)
[ 8 ] M. Tuceyran and A.K. Jain, “Texture analysis, in Handboo and Computer Vision”, (2nd edition), World Scientific Publishing Co., Chapter 2.1, 1998, pp. 207-248. [ 9 ] F. Argenti, L. Alparone, and G. Benelli, “Fast algorithms for texture analysis using co-occurrence matrices”, IEE Proceedings-F, Vol. 137, No. 6, December 1990, pp. 443-448.
[ 10 ] Krishna, V. V(2005), “Classification of textures based on distance function of linear patterns using mathematical morphology”, Proceedings of ICEM, conducted by JNT University, Kakinada.
[ 11 ] Vijaya Kumar, V(2007), “An Innovative Technique of Texture Classification and Comparison Based on Long Linear Patterns”, Journal of Computer Science, Volume: 3 issue:08, pp.633-638