University of Windsor University of Windsor
Scholarship at UWindsor
Scholarship at UWindsor
Electronic Theses and Dissertations Theses, Dissertations, and Major Papers
2010
Crawling Deep Web using a GA-based set covering algorithm
Crawling Deep Web using a GA-based set covering algorithm
Shaohua Wang
University of Windsor
Follow this and additional works at: https://scholar.uwindsor.ca/etd
Recommended Citation Recommended Citation
Wang, Shaohua, "Crawling Deep Web using a GA-based set covering algorithm" (2010). Electronic Theses and Dissertations. 8109.
https://scholar.uwindsor.ca/etd/8109
Crawling Deep Web Using a GA-based Set Covering
Algorithm
By
Shaohua Wang
A Thesis
Submitted to the Faculty of Graduate Studies
Through Computer Science
In Partial Fulfillment of the Requirements for
The Degree of Master of Science at the
University of Windsor
Windsor, Ontario, Canada
2010
1*1
Library and Archives
Canada
Published Heritage
Branch
395 Wellington Street
Ottawa ON K1A 0N4
Canada
Bibliotheque et
Archives Canada
Direction du
Patrimoine de I'edition
395, rue Wellington
Ottawa ON K1A0N4
Canada
Your file Votre reference ISBN: 978-0-494-62753-2 Our file Notre reference ISBN: 978-0-494-62753-2
NOTICE:
AVIS:
The author has granted a
non-exclusive license allowing Library and
Archives Canada to reproduce,
publish, archive, preserve, conserve,
communicate to the public by
telecommunication or on the Internet,
loan, distribute and sell theses
worldwide, for commercial or
non-commercial purposes, in microform,
paper, electronic and/or any other
formats.
L'auteur a accorde une licence non exclusive
permettant a la Bibliotheque et Archives
Canada de reproduce, publier, archiver,
sauvegarder, conserver, transmettre au public
par telecommunication ou par I'lnternet, prefer,
distribuer et vendre des theses partout dans le
monde, a des fins commerciales ou autres, sur
support microforme, papier, electronique et/ou
autres formats.
The author retains copyright
ownership and moral rights in this
thesis. Neither the thesis nor
substantial extracts from it may be
printed or otherwise reproduced
without the author's permission.
L'auteur conserve la propriete du droit d'auteur
et des droits moraux qui protege cette these. Ni
la these ni des extraits substantiels de celle-ci
ne doivent etre imprimes ou autrement
reproduits sans son autorisation.
In compliance with the Canadian
Privacy Act some supporting forms
may have been removed from this
thesis.
Conformement a la loi canadienne sur la
protection de la vie privee, quelques
formulaires secondaires ont ete enleves de
cette these.
While these forms may be included
in the document page count, their
removal does not represent any loss
of content from the thesis.
Bien que ces formulaires aient inclus dans
la pagination, il n'y aura aucun contenu
manquant.
Author's Declaration of Originality
I hereby certify that I am the sole author of this thesis and that no part of this
thesis has been published or submitted for publication.
I certify that, to the best of my knowledge, my thesis does not infringe upon
anyone's copyright nor violate any proprietary rights and that any ideas, techniques,
quotations, or any other material from the work of other people included in my thesis,
published or otherwise, are fully acknowledged in accordance with the standard
referencing practices. Furthermore, to the extent that I have included copyrighted
material that surpasses the bounds of fair dealing within the meaning of the Canada
Copyright Act, I certify that I have obtained a written permission from the copyright
owner(s) to include such material(s) in my thesis and have included copies of such
copyright clearances to my appendix.
I declare that this is a true copy of my thesis, including any final revisions, as
approved by my thesis committee and the Graduate Studies office, and that this thesis
has not been submitted for a higher degree to any other University or Institution.
Abstract
An ever-increasing amount of information on the web today is available only through search interfaces: the users have to type in a set of keywords in a search form in order to access the pages from certain web sites. These pages are often referred to as the Hidden Web or the Deep Web. According to recent studies, the content provided by hidden web sites is often of very high quality and can be extremely valuable to many users. This calls for deep web crawlers to excavate the data so that they can be reused, indexed, and searched upon in an integrated environment.
Crawling deep web is the process of collecting data from search interfaces by issuing queries. It often requires the selection of an appropriate set of queries so that they can cover most of the documents in the data source with low cost. This can be modeled as a set covering problem which has been extensively studied in graph theory. The conventional set covering algorithms, however, do not work well when applied to deep web crawling due to various special features of this application domain. Typically, most set covering algorithms do not take into account the distribution of the elements being covered. For deep web crawling, the sizes of the documents and the document frequency of the queries follow the power law distribution.
A new GA-based algorithm is introduced in this thesis. It targets at deep web crawling of a database with this power law distribution. The experiment shows that it outperforms the straightforward greedy algorithm previously introduced to the literature.
Dedication
To my great parents. I love you.
Acknowledgements
My thanks and appreciation to Dr. Jessica Chen for persevering with me as my advisor throughout the time it took me to complete this research and write the thesis, and for her guidance on my research and during the course of my graduate study which is the most important experience in my life. The other important person who gave me many great ideas on my thesis work is Dr. Jianguo Lu. Without his great advice, I cannot finish my thesis work.
I am grateful as well to Dr. Zhengzhong Ma to be my external reader.
Table of contents
Author's Declaration of Originality Ill
Abstract IV Dedication V Acknowledgements VI
List of Tables VIII List of Figures IX
1. Introduction 1 2. Preliminary 9
2.1 4-Step framework 9 2.2 Set covering problem 10 2.3 Genetic algorithms 12 2.4 Evaluation criteria 15
3. Related work 17 4. Genetic algorithm (GA) -based algorithm 25
4.1 Overview of proposed GA-based algorithm 25 4.2 Representation and fitness function 25 4.3 Symbol notations used in our proposed algorithm 27
4.4 Initial population construction 28 4.5 Parent selection method 32 4.6 Crossover operator 34 4.7 Dynamic calculation of df/qw 39
4.8 Feasibility operator 43 4.9 Population replacement model 43
4.10 Mutation operator and mutation rules 44 4.11 The time complexity of our proposed GA 45
5. Experiment 47 5.1 Experiment setting 47
5.2 Experiment result 48 5.3 Parameter consideration 50
6. Conclusion 55 References 57 Vita Auctoris 60
List of Tables
Table 1. The GA is based on certain concepts of biological evolution 13 Table 2. Matrix A: the input matrix for set covering algorithm 18 Table 3. Matrix B: initial weight table of the example corresponding to Matrix
A 22 Table 4. Dynamic calculation df/qw 41
Table 5. The OR achieved by the proposed method and greedy method for four
corpora. The mutation rate is 0.03 and the generations are 500 48 Table 6. The overlapping rate after certain umber of generations in 10 test cases
for Gov corpus 50 Table 7. The overlapping rate after certain umber of generations in 10 test cases
for Wikipedia corpus 51 Table 8. The overlapping rate after certain umber of generations in 10 test cases
for Reuters corpus 51 Table 9. The overlapping rate after certain umber of generations in 10 test cases
for Newsgroup corpus 51 Table 10. The experiment results of each case of mutation rate on a SampleDB of
Table 11. Gov Corpus 53 Table 12. The experiment results of each case of mutation rate on a SampleDB of
Wiki Corpus 54
Table 13. The experiment results of each case of mutation rate on a SampleDB of Reuters Corpus 54
Table 14. The experiment results of each case of mutation rate on a SampleDB of
List of Figures
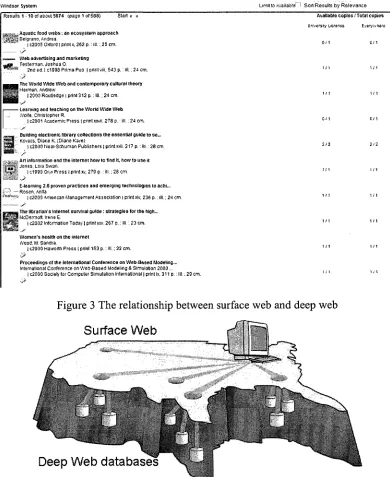
Figure 1. Search interface (query form) of Windsor library data base 1 Figure2. The "hidden" information returned by Windsor library through the
search Interface in Figure 1 1 Figure3. The relationship between surface web and deep web 2
Figure4. The process of collecting hidden data by issuing queries 4 Figure5. The advanced search interface with more search attributes 5
Figure6. The outline of Deep Web Crawling algorithm 10 Figure7. A set of subsets that cover all the nodes 11 Figure8. Asmallest subset of all subsets of the initial set 12
Figure9. Algorithm flow of basic genetic algorithm 14 FigurelO. Ordered representation of a solution (chromosome) 27
Figure 11. Parent selection strategy when there is a even number of solutions 34
Figurel2. How cut-and-splice crossover works 35 Figurel3. Experiment results of comparison of cut-and-splice and the proposed
method 38 Figure 14. The relationship between generations and average overlapping rate of
each corpus. Data is obtained from the mean of each 10 tests of each
case 51
1. Introduction
Today's search engines do not reach most of the data on the Internet- The Web has
been rapidly "deepened" by massive databases online [1]: While the surface Web has
linked billions of static HTML pages, it is believed that a far more significant amount
of information is "hidden". It is behind the search interface of searchable databases.
Such information may not be accessible through static URL links-They are assembled
into Web pages as responses to queries submitted through the surface interface of an
underlying database. In other words, they can only be accessed from surface interface.
These pages are often referred to as the Deep Web [2] or the Hidden Web [3]. Figure 1
shows what a search interface looks like. It is a search interface given by a Windsor
library system. Figure 2 shows the hidden information returned by the system as a
response to this interface.
Figure 1 Search interface (query form) of Windsor library data base
University C ^ '' of Windsor
Now Searching Windsor System
-Keyword » All Formats
£tkanc93Sear$ft University Libraries * Go'_
•
My Account
Basic Catalogue iHTML onk) I Ledflv Library I Law Library I Help I Browse Journals I Fines Journal Articles and Research Tools Copyright © 2006-2008 Georgia Pu&lic Library Service
Powered Sy: • :- -v^voiv.. i:
Windsor System Limit to Available: .1 Sort Results by Relevance Results 1-10ofa5out5674 tpagelofS&S) Start « a
WVW&tAQuatic *0 0 d w e b s •a n e c o sVs t e r n approach <(mt*i0 Belgrano, Andrea.
" I C2005 Oxford I print x, 262 p.: ill.; 25 cm. \S
M M . Web advertising and marketing ~JQI Testemian. Joshua 0.
* ^ « 2nd ed. I C1998 Prima PUD | print viii, 543 p.: HE.; 24 cm. •J
M H _ _ | The World Wide Web and contemporary cultural theory | § | | § i Herman. Andrew
i i i l j 1 2000 RcuUsdge i print 312 p.: iil.; 24 cm. I Learning and teaching on the World Wide Wet)
Wolfs. Christopher R.
]c2001 Academic Press (print xx«ii. 278 P-' ill.: 24 cm. ™ - Building electronic library cottectiona the essential guide to se„. | * B Kcvacs, Diane K. (Diane Kaye)
frSpj I c2000 Neai-Schuman Publishers | print xxii. 217 p.: ill.: 28 cm. , „p„^ • Art information and the internet how to find rt, hew to use it *™"l Jones, Lois Sw3n.
I « ^ i | c1999 Oivx Press I prints, 279 p.: ill.; 28 cm. ". ~,J
E4earning 2.0 proven practices and emerging technologies to actiL. - Rosen, .Anita
ir-n.ru.ii | C2003 American Management Association | print xw, 236 p. :iil.; 24 cm. Krmms The librarian's internet survival gufde: strategies for the high... | i | i l | McDermott. Irene £.
& p l | | I c2002 information Today | printxxv. 267 p.: III. •. 23 cm. Women's health on the internet
Wood. M.Sandra
I c2000 Haworth Press ! print 153 p.: ill.; 22 cm. v ^
Proceedings of the International Conference on Web-Based Modeling... international Conference on Web-Based- Modeling & Simulation 2000...
I c2000 Society (or Computer Simulation Internationa! | print Ix. 311 p.: ill.. 29 cm.
Available copies 1 Total copies Universe/Lfcrartss Everyv.-ftere
0/1 G/1
1 »M W 1
1/1 i <' i
on c/i
2/2 2/2
! / 1 i .' I
1 M 1.' 1
1/1 1/1
1/1 1/1
i ; i i ; i
Figure 3 The relationship between surface web and deep web
Surface Web
Deep Web databases
Source of Figure 3: http://www.er.doe.gov/News_Information/News_Roorn/2009/Aug%204.html
The "hidden" information is contained in Deep Web databases which can only be
accessed through the search interface. Figure 3 illustrates the relationship between the
surface web and the deep web.
According to many studies (e.g. [2]), the size of the deep web increases rapidly as
more organizations put their publicly available information online through an
easy-to-use search interface [1]. In [2], Chang et al. estimated that well over 100,000
deep web databases currently exist on the Web. Moreover, the content provided by
many deep web databases is often of very high quality and can be extremely valuable
to many users [1]. This calls for deep web crawling to excavate the data so that the
"hidden" information can be reused, indexed, and searched.
Crawling deep web [4][5][6][7][8] is the process of collecting "hidden" information
by issuing queries to deep web databases through various search interfaces including
HTML forms, web services and programmable web APIs (Application Programming
Interfaces). Here a web service refers to the API that can be accessed over a network,
such as the Internet, and executed on a remote system hosting the requested services.
Web API, when used in the context of web development, is typically a defined set of
Hypertext Transfer Protocol (HTTP) request messages along with a definition of the
structure of response messages, usually expressed in an Extensible Markup Language
(XML), or JavaScript Object Notation (JSON) format. XML is a language to define a
set of rules for encoding documents electronically. JSON is a lightweight computer
data interchange format.
Figure 4 below illustrates the process of collecting "hidden" information. Here, a boat
represents a query and the fish represents a unit of "hidden " information which can
only get a limit amount of fish: each query can only bring back a set of units of
information from databases. Crawling deep web is like the process of sending boats to
the ocean to do the fishing. Crawling deep web is important for various reasons, such
as indexing deep web pages.
Figure 4 The process of collecting hidden data by issuing queries
l-~^-> ii ^K ilm*, *M$!$JLim^&!&£&r/m
Source of Figure 4: http://www.mkbergman.com/category/deep-web/
There are two kinds of deep web databases:
• Structured database, such as relational database
• Un-structured database, such as text documents, video files
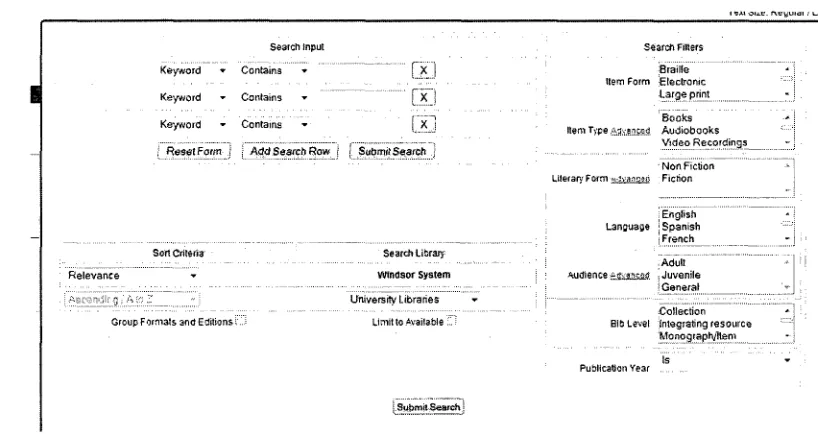
This thesis focuses on the Un-structured databases, especially textual documents
databases, i.e. those data sources that contain plain text documents only. The textual
data sources usually provide a simple keyword-based query interface instead of
multiple attributes as studied in [8]. Here, multiple attributes refers to multiple
keywords which can be used to search documents. An example of the query interface
with multiple attributes is illustrated in Figure 5 which shows an advanced search
interface of the Windsor library system. The search interface in Figure 1 is a basic one
of it.
Figure 5. The advanced search interface with more search attributes
Keyword » Keyword » Keyword I Reset Form-.
Search input Contains * Contains » Contains -| Aidd Search Row )
iJLl fx ! " ! x ]
]. Submit Search j
Group Formats and Editions t
Search Library Windsor System University Libraries
Limit to Available:'.'
i Submit Search
Braille Item Form ^Electronic
•Large print Books Item Type AgvascsiS Audiobooks
LiierarvForm ^va^;;*.*
Language
Audience-evasyas
Bit: Level
Non Fiction -1 Fiction
i English | Spanish • French .Aduli i Juvenile ! Genera* ^Collection 'Integrating resource Monograph/ftem Publication Year
No matter what kind of database is used, for deep web crawling there are two research
challenges.
• One is learning and understanding the interface and the returning result so that
query submission [17] and data extraction [18] can be automated.
• Another is selecting an appropriate set of queries so that they can be used to
download most of the documents in the data source with low communication cost.
In order to reduce the network traffic, previous work [7] [8] [18] considered to
minimize the number of queries issued. Here, the cost is measured by the number of
redundant documents that are retrieved. This is more applicable to the cases when a
redundant documents are returned by sending queries in deep web crawling, the lower
cost it is spent.
This thesis work focuses on the latter challenge. There are two difficulties in selecting
appropriate queries.
a. First, the selection of an appropriate set of queries can usually be modeled as a
set covering problem which is NP-Complete.
b. Second, the actual corpus is unknown to the crawler beforehand; hence the
crawler cannot select the most suitable queries with the global knowledge of the
underlying documents inside the database.
Since it is not possible to select queries directly from the entire data source, the
selection are made from a sample of the database. It is shown with the framework in
[9] that queries selected from a sample data source can perform on the total data
source as well as on the sample one. Using this sampling method, they solved the
difficulty mentioned above in Item b. Furthermore, considering the query selection
problem as a set covering problem, they used greedy method [7] [9] to select a proper
set of queries based on a sample database.
In this thesis work, this framework is adopted and the query selection problem is
viewed as set covering problem. However, a new method is proposed to select a
proper set of queries. The conventional set covering algorithms, e.g. greedy algorithm
[9], do not work well when applied to deep web crawling due to various special
features of this application domain. Typically, most set covering algorithms, do not
take the database distribution into consideration. For deep web crawling, the sizes of
the documents and the document frequency of a query, i.e. the number of documents
in the database that contain this query, follow the power law distribution. In order to
have a better algorithm for the databases with the power law distribution, a Genetic
Algorithm (GA) based heuristic is proposed.
Inspired by evolutionary biology, genetic algorithm is considered as a search
technique used in computing to find exact or approximate solutions to optimization
and search problems. It has several basic steps such as selection, crossover and
mutation. Changes in each step of GA are made and some more steps are added into
GA in order to increase its effectiveness in the present setting.
Experiments are conducted on four corpora which are Wiki, Gov, Newsgroup and
Reuters in order to compare our method with greedy algorithm and the results show
that the proposed method outperforms the straightforward greedy algorithm: It can
select a more proper set of queries.
This thesis is organized in the following way: Section 2 introduces preliminary
knowledge of the present work. Section 3 introduces some related work. It includes
Section 4 introduces the proposed genetic algorithm. In section 5, the experimental
2. Preliminary
In this section, some concepts which are used in our proposed method are introduced.
As mentioned in the introduction, for deep web crawling, there are two research
challenges. One is learning and understanding the interface and the returning result so
that query submission [17] and data extraction [18] can be automated. The other is
selecting appropriate queries so that most of the hidden data are harvested at a low
cost [7] [8] [19]. For selecting appropriate queries, one of the difficulties is that the
actual corpus is unknown to the crawler beforehand; hence the crawler cannot select
the most suitable queries with the global knowledge of the underlying documents
inside the database.
Lu et al [9] proposed a 4-step framework to face this challenge. The present work is
based on this framework.
2.1 4-Step framework
In 4-step framework [9], a sample set of documents is first downloaded from the total
database. From this sample, a set of queries is acquired from a query pool of this
sample database, i.e. a set of terms in this sample database. This set of queries is
selected in such a way that it can be used to cover most of the documents in the
Algorithm 1: Outline of the DeepWeb Crawling algorithm [9]
Input: the original data source TotalDB; sample size s, query pool size p .
Output: A set of terms kept in Queries
1. Create a sample data base SampleDB by randomly selecting s number of
documents from the corpus TotalDB;
2. Create a query pool Query Pool of size p from the terms that occur in
SampleDB;
3. Select a set of queries Queries from QueryPool that can cover at least 99% of
the SampleDB by running a set covering algorithm;
4. Mapping the selected queries into TotalDB
The structure of this algorithm illustrated in Figure 6
Figure 6 The outline of DeepWeb Crawling algorithm
T o t a l D a t a b a s e
„^^** S e n d t h e cn*eri«-s
n
S e l e c t c i o c s
I S a m p l e O a t alb a s e
V „ S e l e c t :-w o r c t s
Q u e r i e s 1
i~-~<
iQn&.G.Ty P Q
S e t ; c o v e r a l g o r i i t H r r i
"~1
o t
J
As it can be seen the third step of the 4-step framework [9] is to select a proper set of
queries from query pool. The solution of the 4-step framework [9] for this point is to
consider the query selection problem as a set covering problem.
2.2 Set covering problem
Let Aij be a zero-one matrix with m rows and n columns where Ejj denotes the
covering problem (SCP) is the problem of covering all the rows of Aij by a subset of
the columns at minimal (total) cost. Let Xj = 1 if column j is in the solution and Xj =0
otherwise. The SCP can be expressed as
Minimize >=1 (1)
YaCd}Xj>\,
Subject to J=l i = 1... m (2)
^
gM j = l...n (3)
Subjection (2) ensures that each row is covered by at least one column. If all the costs
Cj are equal, the problem is called the uni-cost SCP.
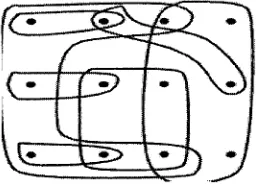
Example 1. In Figure 7, each circle covers a set of nodes. A set of circles {Ci,...Cm}
covers all nodes N ={l,...,n}. What is the smallest number of circles T which can
cover all the nodes in this figure? An answer is illustrated in Figure 8. In this example,
the cost of each circle is equal. Each circle can be represented as a column; each node
can be represented as a row. So the problem can be induced into finding smallest
number of columns to cover all the rows.
Figure 7 A set of subsets that cover all the nodes
Figure 8 A smallest subset of all subsets of the initial set
Source of the picture: http://www.cs.sunysb.edu/~algorith/files/set-cover.shtml
There are plenty of heuristics to solve set covering problem. The present work
proposes a GA-based heuristic within the context of deep web crawling. In the next
sub section, the original genetic algorithm is introduced.
2.3 Genetic algorithms
A genetic algorithm (GA) can be considered as a search technique having been
applied to a variety of combinatorial optimization problems [12]. The theoretical
foundations of GAs were originally developed by Holland [13]. The idea of GAs is
based on the evolutionary process of biological organisms in nature. During the
course of the evolution, natural populations evolve according to the principles of the
theory of biological evolution, especially that formulated by Charles Darwin, natural
selection and "survival of the fittest". Individuals more successful in adapting to their
living environment will have a good chance of surviving and reproducing; while ones
less fit will not survive. This means that the genes from individuals with better fit will
spread to an increasing number of individuals in each successive generation. The
combination of good genes from highly adapted individuals may produce even more
fit offspring. In this way, species evolve to become better adapted to their
environment.
A genetic algorithm simulates these biological evolutionary processes by taking an
initial population of individuals and applying genetic operators, such as crossover and
mutation, in each reproduction. Each individual in the population can be represented
by a string or chromosome which represents a possible solution to a given problem.
The fitness of an individual is evaluated with respect to a given objective function.
Highly fit solutions are given more opportunities to reproduce by exchanging pieces
of their genetic information, in a crossover procedure, with other highly fit solutions.
This produces new child solutions, which share some genes taken from both parents.
Mutation is often applied after crossover by altering some gene(s) in the strings. The
offspring can either replace the whole population (generational approach) or replace
less fit individuals (steady-state approach). This evaluation-selection-reproduction
cycle is repeated until a satisfactory solution is found.
Table 1 The GA is based on certain concepts of biological evolution
Genetic Term Chromosomes
Genes Crossover
Mutation
Fitness
Offspring
Microbiological Definition
a series of genes carrying genetic information, DNA
Section of chromosome carrying trait info. recombine two organisms where genetic information is exchanged
the elements of DNA are a bit changed
measured by success of the organism in its life
New generation after crossover
Model definition Solutions
bits of a solution two solutions be exchanged to produce new Offspring
Bit(s) within solutions are changed
Fitness function f(x)
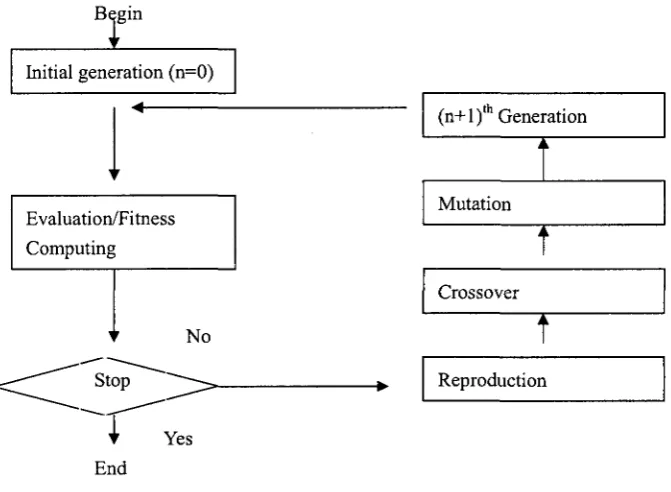
The basic steps of a simple GA are shown below. A more comprehensive overview of
GAs can be found in Refs. [12] [14] [15] [16].
Generate an initial population;
Evaluate fitness of individuals in the population; Repeat
Select parents from the population;
Recombine (mate) parents to produce children; Evaluate fitness of the children;
Replace some or all of the population by the children; Until a satisfactory solution has been found;
Algorithm flow is illustrated in Fig. 9
Figure 9 Algorithm flow of basic genetic algorithm
Begin
Initial generation (n=0)
Evaluation/Fitness Computing
No
Stop
"~~-I Yes
End
(n+1)' Generation
Mutation
Crossover
Reproduction
As it can be seen, the original GA is a generic algorithm. It can be modified to be
applied to some specific problem domain, such as deep web crawling. In order to
apply GAs to a particular problem domain, more details such as chromosome
representation and fitness function are needed. Such details for the present setting are
introduced in the later sections.
2.4 Evaluation criteria
The proposed algorithm is partly evaluated in terms of hit rate (HR) and overlapping
rate (OR).
Definition 5 (Hit Rate, HR) [9]: Given a set of queries Q = {ql, q2„.., qk} and a
database DB. The hit rate of Q on DB, denoted by HR (Q, DB), is defined as the ratio
between the number of unique data items collected by sending the queries in Q to DB
and the size of the database DB.
\(jS(q
p,DB)\
HR(Q,DB)= p-x " (4)
Here S(q,DB) denotes the set of documents obtained by sending query q to database
DB. The numerator of the right hand side of this equation denotes the number of
accumulated unique results obtained. |DB| is the size of the target dataset. In reality,
this number is usually provided by the data source. In summary, the HR is used to
evaluate the quantity of discovery, i.e. how many unique results, out of all the
expected results have been collected.
overlapping rate of Q on DB, denoted by OR(Q, DB), is defined as the ratio between
the total number of collected data items and the number of unique data items retrieved
by sending queries in Q to DB.
ZlSiq^DB)]
OR(Q,DB) = ^ (5)
\\JS{q DB)\
P=\
The denominator of the right hand side of the equation represents the number of
accumulated unique results obtained, and the numerator represents the accumulated
number of total results, including duplicates. This value measures the quality of the
extraction. Lower OR value indicates higher quality of the extraction. Together with
the number of queries issued (denoted as Q), they are considered the cost of the
discovery.
3. Related work
As mentioned before, two research challenges are in deep web crawling. One is
learning and understanding the query interface of database and the returning result.
The other one is selecting a proper set [7] [8] [18]. Several pieces of research work
[6][21] [22][23] have been conducted on learning and understanding the query
interfaces by discovering the correspondences among the attributes of the query
interfaces in order to obtain a general definition which is a common pattern that
accurately describes queries interfaces of deep web database. With the general
definition, a scalable solution for a deep web crawling task can automatically find the
deep web databases: it is impossible to locate deep web databases manually for deep
web crawling. In the mean while, understanding the interfaces is needed for inputting
queries into the search interface automatically.
With the popularity of publicly available web services that provide programmable API
[20], where input and output data formats are explicitly specified, automated
extraction of deep web data becomes more practical, and the problem of query
selection is becoming more prominent. Following the framework of [9], a proper set
of queries is selected based on a sample database and the query pool so that the cost
of mapping the selected queries into total database can be minimized.
Selecting an optimal set of queries can be viewed as a set-covering problem, which is
set covering problem. For the set covering problem (SCP) in the context of deep web
crawling, each query can be represented by a column; each document can be
represented by a row. In the matrix of SCP, the 0-1 values in a column can show
which rows can be covered by this column; the 0-1 values in a row can show which
columns can cover this row. In the same way, the matrix of SCP can also represent the
relationship between queries and documents. Example 2 shows how the query
selection problem is reduced into set covering problem.
Example 2 Table 2 gives a matrix A, where each column represents a query in
QueryPool = {ql, q2,..., q5}, and each row represents a document of SampleDB={dl,
d2,..., d9}. Cj = *-* is the document frequency (df) of q;. Document frequency of
a term qi, as illustrated in Table 2, is the number of documents in the database that
contain qi. One selection of the queries is S= {q3, q4, q5}, which can be obtained by
the greedy algorithm [9],
Table 2 Matrix A: an input matrix for set covering algorithm
Query 1 Query 2 Query 3 Query 4 Query 5
Document 1
Document 2
Document 3
'•• Document 4
Document5
i Document 6
Document 7 Document 8 Document 9 0 0 1 0 1 1 0 1 0
Several pieces of work viewed the query selection problem of deep web crawling as
set covering problem, but they proposed different heuristics to solve the set covering
problem in the context of deep web crawling.
In [7], the deep web extraction process is considered as a set covering problem and
the adaptive data extraction method has been proposed. The adaptive data extraction
method is a greedy approach that attempts to maximize the potential gain of the next
query issued to the data set. In the each iteration of the method, a new query is chosen
based on its "Estimate Efficiency" among all query candidates. The estimate
efficiency for each candidate keyword q\ is calculated using equation — , in
Cost(qi)
which the numerator stands for the amounts of new document that can be returned by
sending qi, and the denominator is the cost of issuing qi, i.e. redundant documents
returned by sending- q;.
One of the main shortcomings in [7] is that when a same query selected by the greedy
approach can harvest a large chunk of new returns, it may also bring back many
duplicates. In terms of network traffic, duplicated data far overweight the number of
queries.
To overcome this shortcoming, the work of [9] and [10] focused on reducing the
duplicates.
problem which has been extensively studied. They adopted the greedy algorithm in [7]
to select queries.
The greedy algorithm used in [7] [9] selects the most cost-effective query in each step.
Let Q be a set of queries already selected. According to these simple greedy
algorithms, the next query q is selected to cover as many as possible new documents
(i.e. documents not covered by any query in Q) per unit cost. The cost is in terms of
the document frequency df. In other words, q is selected to maximize the value of
new/df where new is the number of documents covered by q but not by any query in
Q-As an improvement of these simple greedy algorithms [7] [9], Wang et al [10]
introduced a new approach to select queries. They introduced the concepts of weights
into the straightforward greedy algorithm [7] [9] and proposed weighted greedy
algorithm. If a document can only be matched by one query, apparently that query
must be included into Q. In general, when selecting a query, more attention should be
paid to cover small documents i.e. those containing fewer terms, since usually they
can be matched by only very few queries. A weight is assigned to each document,
where small documents have larger weights. With this intuition, the weight of a
document is introduced:
Definition 1 (Document Weight, dw) [10]: Let sample database D = {dl, d2, ... ,dm}
and query pool QP = {ql,q2,..., qn}. Each document is considered as a set of terms.
Notation n e rf. is used to indicate that a term n occurs in document (~f.. The
OP
weight of a document with respect to QP and ^.(\<i<m), denoted by ^/vy,
(or dw for short), is the inverse of the number of terms in QP that occurs in
document^/., i.e.
dw
" = \d7^\
(6)
Definition 2 (Query Weight, qw) [10]: The weight of a query a (1 < j < n ) in QP
QP
with respect to D, denoted by qw (or qw for short), is the sum of the document
weights of all documents containing term {7 , i. e. ,
qw
QP= I dw
Qj (7)
As for weighted greedy strategy, queries qj with larger number of qw are preferred.
However, a larger number of qw should be obtained by fewer number of dw. Fewer
number of dw means fewer df. The relationship between qw and dw is shown in
Equation (7). In order to harvest more documents with less cost, fewer df is used to
obtain larger qw. Therefore queries with smaller df/qw are preferred because,
compared with queries having large df/qw, they usually lead to lower overlap. The
example of the relationships among dw, qw and df is explained in Example 3 below.
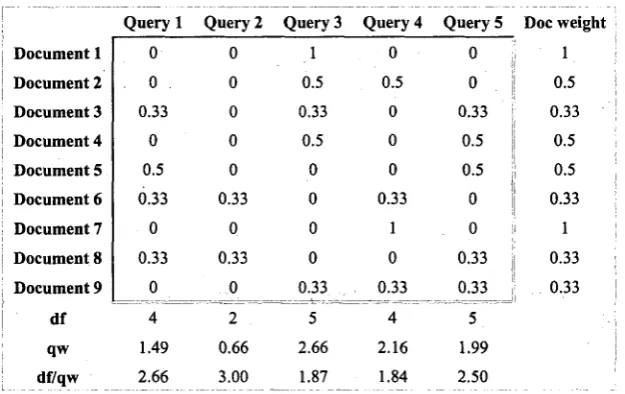
the top part of Table 3. The document frequency, the weights of the queries, and their
quotient are listed at the bottom of the table. For example, the document weight of dl
is one, the document weight of d2 is V2, and the query weight of q2 is the sum of the
weight of the documents that is covered by q2, i.e., 0.66. The query weight of ql is
1.49 which is the sum of the document weight of d3, d5, d6 and d8. The value of df of
ql is the number of non-zero weights of the documents which are covered by q l .
Table 3 Matrix B: the initial weight table of the example corresponding to Matrix A
Query 1 Query 2 Query 3 Query 4 Query 5 Doc weight
Document 1 Document 2 Document 3 Document 4 Document 5 Document 6 Document 7 Document 8 Document 9 df qw df/qw 0 0 0.33 0 0.5 0.33 0 0.33 0 4 1.49 2.66 0 0 0 0 0 0.33 0 0.33 0 2 0.66 3.00 1 0.5 0.33 0.5 0 0 0 0 0.33 5 2.66 1.87 0 0.5 0 0 0 0.33 1 0 0.33 4 2.16 1.84 0 0 0.33 0.5 0.5 0 0 0.33 0.33 5 1.99 2.50 , 1 0.5 0.33 0.5 0.5 0.33 1 0.33 0.33
The study of [10] used four corpora which are Gov, Wiki, Newsgroup and Reuters
under 4-step framework introduced in Section 2. It showed that
• The relationship between the df and the number of terms follows the power
law distribution in the sample databases.
• The relationship between the document size and the number of documents in
the sample database follows the power law distribution.
These two relationships follow the power law distribution, which means
• most of the terms are contained by very few documents; while some small df
terms are in most of the documents.
• most of the documents only contain few terms.
In order to take into account the database distribution, a new GA-based method is
proposed under the framework [9], which means a different method is used to select
the queries in order to get fewer duplicates at the third step of the four step
framework.
The present GA-based method makes sure that terms with smaller value of df/qw are
selected to the solution earlier. In addition, the nature of genetic algorithm can make
sure that more possibilities of the combination of genes of solutions can be provided.
Therefore in every generation, the present proposed GA may improve the solutions a
little bit, which lead to an overall better result.
Since GA is used to solve the query selection problem which is viewed as set covering
problem, [24] is also related to the present work. In [24], it has been presented a
genetic algorithm-based heuristic for set covering problems, although it is not for a
particular application domain such as deep web crawling. The authors in [24]
proposed several modifications to the basic genetic procedures including a new
fitness-based crossover operator (fusion), a variable mutation rate and a heuristic
their algorithm was evaluated on a large set of randomly generated problems.
Computational results showed that the genetic algorithm-based heuristic is capable of
producing better-quality solutions than a number of other heuristics [25] [26] [27].
4. Genetic algorithm (GA) -based algorithm
The basic genetic algorithm described in the previous section is refined in a way such
that problem-specific knowledge is considered.
4.1 Overview of proposed GA-based algorithm
The framework of our proposed GA-based algorithm for the deep web crawling SCP,
in line with the one introduced in Section 2.3, is given below.
1. Generate an initial population of solutions;
2. Repeat
• Repeat
i. Select parents from the population using rank selection;
ii. Recombine parents to form children using our proposed crossover
operator,
iii. Make children feasible by applying our proposed feasibility
operator to these that are not feasible;
Until all the solutions in parent generation are selected to do crossover; • Replace some or all of the children population with the same amount of
parent population;
• Mutate each solution in children generation based on mutation rate; 3. Until the satisfaction criteria is met;
Satisfaction criteria can be defined so that, for example, after 500 generations the
algorithm terminates, or if the best solution is not changed within 50 generations.
When the algorithm terminates, the best solution is given as the final result of the
algorithm. The algorithm is introduced in details in the following sub-sections.
4.2 Representation and fitness function
genetic algorithm for a particular problem is to devise a suitable representation
scheme for solution space. In the context of deep web crawling, a solution
(chromosome) is a set of queries that cover all the documents. Recall that the query
selection problem can be reduced into SCP where a column of SCP represents a query
and a row of SCP represents a row. Hence, a solution (chromosome) is a set of
columns that cover all the rows. Let n be the total number of columns in the SCP. S =
fan, q,2,-- -, qim} is a solution if ik ^ ij for any k, j e [l,m], k ^ j ; and ik e [l,n] for any
k e [l,m].
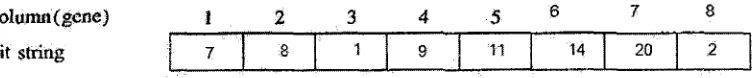
Furthermore, in this thesis work, a list of query ids is used to represent a solution
(chromosome), i.e. a set of queries. The list is ordered increasingly by the values of
the df/qw of the corresponding queries. This is to simplify the GA operations on the
solutions: the value of each bit (gene) corresponds to a column id. For example, S =
[7, 8, 1, 9, 11, 14, 20, 2] is a solution for a SCP with 20 columns and 10 rows. It is
illustrated in Figure 10 as an 8-bit string. Here the value of the 1st bit of solution S is 7,
which means the 7th column in deep web crawling SCP is in the solution.
A df/qw value of a query is considered as small if it is less than the average df/qw
among all queries in the query pool. The queries can then be divided into two groups
according to their df/qw values.
1. queries with small df/qw
2. queries with large df/qw
1
| 7
2
:s
3
1
4
9
• 5
11 6
14 7
20 8
2
Clearly, queries in group 1 are better than queries in group 2. In the following, when
constructing a solution, queries in group 1 will be considered before those in group 2.
Figure 10 Ordered representation of a solution (chromosome)
colunm(gene)
bit string
The fitness of a solution is directly related to its objective function. It is the sum of the
cost of each bit of the solution. It is calculated by
7=1
where Cj is the value of the cost of bit j in terms of document frequency.
4.3 Symbol notations used in our proposed algorithm
In this sub-section, some notations are used.
• TO denotes the initial weight table which contains all the initial df/qw for
each column (c.f. Table 3).
• OC denotes a list containing all the column ids of T. These column ids are
placed in increasing order based on their df/qw.
o OQ denotes the ith element of OC.
o OC-S denotes the sub-list of OC containing all the column ids in OC
such that the values of df/qw of the corresponding columns are smaller
than the average.
• S denotes a solution i.e. a list of column ids whose corresponding columns
• SI denotes a solution candidate: it is a list of column ids whose
corresponding columns cannot cover all the rows in the SCR
• WeightMap denotes a map containing the df/qw of some of the columns
keyed by their column ids. A key-value pair <k,v> represents column k with
its df/qw value v.
In Table 3 (Section 2.3), OC is [4,3,5,1,2]. OC-S of OC is [4,3,5]. S = [4,3,1] is a
solution. SI = [4,3] is an infeasible solution. A WeightMap keeps a set of 5 key-value
pairs which are {(4,1.8), (3,1.87), (5,2.5), (1,2.66), (2,3.00)}.
4.4 Initial population construction
The GA-based algorithm needs an initial set of solutions to do the crossover and
mutation. An initial population construction strategy is needed to generate a set of
solutions such that
• it has a moderate size
• its solutions contain more of the better queries
The initial set of solutions should have a moderate size ~ not too small and not too
big. A too small set will cause the GA-algorithm to terminate too early before
reaching a good solution; while a too big set will consume too much computation time
with adequate crossover and mutation operations.
The most popular way to generate the initial set of solutions is the random method
which means to obtain a set of solutions by repeatedly running an algorithm that
randomly generates a solution. The merit of random method is easy to reach a
moderate size of the solutions. The drawback is that it is hard to control the number of
better queries in the initial set of solutions, as the random method simply randomly
selects queries to construct a solution.
In order to put more of the better queries into the initial set of solutions, weighted
greedy method can be used, which means to obtain a set of solutions by repeatedly
running the weighted greedy algorithm [10]. Better queries are considered with higher
priority because in each step of the weighted greedy algorithm, a query with the
smallest df/qw is selected into the solution. However, the size of the solutions
generated by applying this method is too small due to the occurrences of identical
solutions. Identical solutions are often generated because greedy algorithms always
choose the locally optimal way to proceed, and thus, the queries selected as locally
optimal ones very often turn out to be the same. Experiment [10] has been conducted
to execute the weighted greedy algorithm on the four corpora Wiki, Gov, Reuters and
Newsgroup. It was shown there that, by running this weighted greedy algorithm 100
times on each of the corpora, the standard deviation of the results are 0, 0, 0, 2,
respectively. Note that the standard deviation of the result is 0 means that there is only
one solution generated; the standard deviation of the result is 2 implies there are only
several solutions generated. Apparently the size of the solutions of running the
weighted greedy method is too small.
developed to construct the initial set of solutions Sp. As mentioned before, queries
with their df/qw less than the average (Section 3, group 1) are better ones. When
constructing the initial set of solutions, in order to increase the chance to get a better
solution from the execution of the genetic algorithm, queries in group 1 are used as
most as possible. In addition to selecting more of the better queries, this method also
generates a moderate size of solutions. For example, by using present method, a set of
18 solutions for a sample database of Wiki corpora with 500 documents is obtained.
Running the weighted greedy method on the same data set, on the other hand, gives
only one solution.
In the following, the proposed method is introduced in details. Recall that in deep web
crawling SCP, a column represents a query. In the following, query and column are
used interchangeably.
Suppose that there are totally n queries, while m of them is in OC-S, with their df/qw
values less than average. To increase the occurrences of the columns whose df/qw is
less than the average, together with each of the queries in OC-S, a set of solutions is
constructed. For the query indexed by j in OC, solutions are derived from each suffix
of OC not containing that of j . A solution is obtained from query j and the shortest
prefix of such a suffix. In this way the occurrences of those queries with smaller
df/qw are increased. In the algorithm,
• Sp is the current set of solutions
• N is a required number of solutions given as an input
• St is a stack used to keep the record of the indexes of those column ids in OC
currently selected into a solution. column(St) denotes the list of all column ids
whose indexes in OC are in St
• index is a pointer to a column id in OC, which is the head of a suffix of OC
currently considered
Algorithm 2 (initial population construction): Input: T, N
Output: Sp Begin:
1. Sp :=empty; St:=empty; j = l ; 2. push / into St; index=2; 3. while |Sp|<N&j<|OC-S|
a. while column(St) cannot cover all the rows in T & index<|T| i. push index into St;
ii. index++;
b. if columns(St) cannot cover all the rows in T & index=|T| i. St:= empty;
ii- j++; iii. index =j+l; iv. push j into St;
c. if columns(St) can cover all the rows i. add column(St) into Sp; ii. if|St|>l&index<|T|
1. index =index+l; 2. pop last element in St; iii. ifindex=|T|
1. pop all elements in St except the first;
2. index= value of the first element of St plus one; iv. if|St|=l
1. break; 4. Return SP;
End
index number of OC starting from j (maximum n of them) and keep increasing from
this number to n, without decreasing. So it takes 0(n ) time for each j . Since j has m
values, the time complexity of Algorithm 2 is 0(h* n ).
4.5 Parent selection method
Parent selection is the task of assigning reproductive opportunities to each solution in
the population. There are a number of widely used methods for this. Typically, there
are proportionate selection and tournament selection.
• The proportionate selection method calculates the probabilities of individuals
being selected as proportional to their fitness. Based on such probabilities,
individuals are selected for mating.
• The tournament selection method works by forming two pools of individuals,
HI and H2, each consisting of approximately half of the total individuals
randomly drawn from the population. Two parents with the smallest fitness
values in HI and H2 respectively are repeatedly taken for mating until at least
one of the two pools is empty.
According to our crossover strategy to be explained later on (Section 4.6), if two
parent solutions with fitness values a and b (where a>b) are used for crossover, child
solutions will have fitness values no greater than a. Thus, if two parent solutions with
low fitness values are paired, the child solutions are guaranteed to have low fitness
value. With this property, in the present thesis work, a rank selection method is
proposed. It can be considered as a combination of the above two methods.
In the present method, all the solutions in the population are ranked in increasing
order based on their fitness values. Solutions with smaller fitness values are ranked
higher in the list. According to the algorithm, the top two solutions in the ranked list
are repeatedly taken to do the crossover, and then put the new solutions generated into
new generation pool.
The proportionate selection method also used the fitness value to rank all the
solutions. However, since it selects the solutions according to the probabilities of
individuals being selected as proportional to their fitness, it cannot guarantee to
always pair two solutions with low fitness values to do the crossover. Different from
this method, ours always pairs two solutions with low fitness values.
The tournament selection method also tries to select two solutions with low fitness
values to pair. However, the two parents are selected from two separate pools which
are grouped randomly. The lowest fitness value in one of the pools may be a large
number considering all the fitness values in the two pools. Thus, it cannot guarantee
to pair two parents with overall low fitness values.
Figure 11 shows how our method works in one generation. If the total number N of
there will be (N-l)/2 pairs of parents and the Nth solution will be moved directly into
the new generation. After the new generation is obtained, all the solutions are ranked
based on their fitness value. The new ranked generation will be considered as parent
generation in the next generation.
Figure 11 Parent selection method (N is an odd number)
Ranked solutions
Solution A Solution B Solution C Solution D
Solution N-2 Solution N-l Solution N
New generation
Solution Be ^Solution Cc • Solution Dc ' Solution Ac
Solution (N-2)c Solution (N-l)c Solution N
In Figure 11, there are N solutions to be selected to do the crossover. They are ranked
based on their fitness value. After the new generation is obtained, all the solutions are
ranked based on their fitness value.
4.6 Crossover operator
In traditional GA, simple crossover operators such as cut-and-splice[29],
one-point[24], two-point [24] crossover are often used. The current method is similar
to the cut-and-splice crossover.
With the cut-and-splice approach, each parent string is split into two segments by a
crossover point which is randomly generated. Two parent strings will have separate
choices of crossover point. The two child strings are obtained by swapping the second
segments of the two parent strings. Figure 12 shows how cut-and-splice crossover
works. Clearly, the application of the cut-and-splice very often results in a change in
the lengths of the children strings.
Figure 12 How cut-and-splice crossover works
Parent String A:
Parent String B:
Crossover point
II
Segment Al II
II i
^ S e g m e n ^ ^ ^ ^ ^
Segment A2
1 1 1 1
Crossover
1
>oint
Segment B2
1 1 1 1
Children String Ac:
Segment Al Segment B2
Children String Be: Segment A2
No matter which crossover technique is used, the results may not be feasible. A good
crossover point should decrease the probability of generating solution candidates after
crossover. Adopting a good crossover point will, thus, avoid handling solution
candidates, which increases the running efficiency of the algorithm.
For cut-and-splice crossover, the crossover point for each parent string is chosen
example, suppose that the crossover point for parent strings P=[Pi,P2,...,Pm] and
P'=[P'i,P'2,...,P'n] are 2 and n-1 respectively. The child strings C and C are
C:=[Pi,P2,P'n], C':=[P'i, ...,P'n-i,P3,---,Pm]. As it can be seen, C is very short, and
usually it cannot be a (feasible) solution. Similarly, C is very long usually with a
fitness worse than those of the parents. Hence, in these situations, the use of
cut-and-splice crossover operator leads to low probability of generating (feasible)
solutions.
The following way is proposed to define a good crossover point. The present method
is similar to the cut-and-splice crossover except that the crossover point for each of
the parents is not randomly chosen: It is chosen to make the two segments of the
chromosome having approximately the same sums of the document frequency of the
queries in each segment. Let Suml be the document frequency of segment [Pi.. .P J of
P and Sum2 the sum of the document frequency of the other segment [Pk+i-.-Pm] of P.
If k can make Suml and Sum2 almost equal, then k can be considered as a crossover
point. In other words, k is considered a crossover point if equation 9 holds for P,
k m
,=i j=k+\
where m is the length of the solution, and Cj is the cost of bit j in terms of document
frequency.
According to the crossover strategy, if two parent solutions with fitness values a and b
(where a>b) are used for crossover, since both two parents are divided into two
segments which have almost of the same sum of df, the fitness values of two children
are all about a/2+b/2. As b ^ a / 2 + b / 2 ^ a , the child solutions will have fitness values
no greater than a. This property is used in the parent selection strategy (c.f. Section
4.5).
As mentioned, when combining the two parent chromosomes (solutions), the goal to
achieve is that the resulting children have more chance to be feasible. The intuition
behind this crossover operator towards this goal can be understood in the following
way.
A solution is a list of columns which can cover all the rows. The overall fitness of a
solution is determined by the sum of df of each column of the solution. Our crossover
point splits each parent into two segments of columns with almost the same sum of
dfs, which means each segment can cover at least half of the rows. Therefore, after
swapping the segments between two parents, the two new children have good chance
to cover all the rows. In this way the probability of generating infeasible solutions is
reduced after crossover.
An experiment have been conducted to compare between the cut-and-splice method
and the present crossover, the ability of generating (feasible) solutions on four data
corpora which are Wild, Gov, Newsgroup and Reuters. Starting with the same pool of
number of (feasible) solutions over all resulting children is calculated and then all the
infeasible children are made feasible in each generation. The results from running the
four corpora for 50 generations are given in Figure 13.
Figure 13 Experiment results of comparison of cut-and-splice and our method
Gov 0.8 0.6 0.4 0.2 O cut-and-splice O our crossover
O O O O O 0 . . 0 0 % X ) . O0 0. j ? ' ' 0 3 CD O O O OCO O O CD O CSD CD O O O „ 0 O .O O
O O CD O O
10 20 30 40 50
newsgroup 1 0&QfmMBssxMmmmMraixa!Mjsm!Wix^ ,0.8 0.6 0:4 O cut-and-splice O, our crossover
O O
OnO
<Sexas&&P*»
0 10 20 30 40 50
0.6
P
10
O cut-and-splice O our crossover
20 30 40 50.
1 m&x®X!£mMmjMmmm:mmmmmm®
0.8
0,6
0.4
O cut-and-splice O our crossover
3 O O O OO OO CD O OOO O CD O OOO
O GO O O 6 O ODD CDO O
10 20 30 40 50
In Figure 13, the X-axis is the number of generation(s) the GA has run; Y-axis is the
ratio of (feasible) solutions over all resulting children in one generation. According to
Figure 13 the crossover operator introduced in this thesis can keep all the children
feasible within 50 generations, while the cut-and-splice operator can only have about
50% of children feasible on average for the four corpora. Therefore our method
outperforms the cut-and-splice crossover operator in terms of keeping children
feasible.
In the above experiment, the OR of each solution in the starting pool of the solutions
is very high (~ 4.5), which means the number of documents brought back by sending
all the queries in a solution to SampleDB is 4.5 times more than the size of SampleDB.
By using our crossover operator, each of the two parents are split into two segments,
each having its OR close to 2.25. Therefore the OR of a child will have much chance
to be greater than 1 after recombining two segments from different parents. In
addition, the crossover operator does not change a lot the OR of a solution in a
generation. This explains why the percentage of the feasible solutions over all the
child results for the proposed crossover is high.
Note that although the proposed method can reduce the probability of generating
infeasible solutions, there may still be some infeasible solutions generated. There are
two ways of dealing with infeasible solutions:
• remove them from the set of children;
• transform them into (feasible) solutions.
In order to obtain more solutions during the crossover operation, the latter approach is
chosen. The proposed feasibility operator is described in later sections. This feasibility
operator, as well as the mutation algorithm to be introduced later, makes use of the
dynamic calculation of df/qw. In the following, the dynamic calculation of df/qw is
introduced.
4.7 Dynamic calculation of df/qw
During the procedure of the GA calculation, very often sorting the columns is needed
according to their df/qw so that those with lower df/qw values can be selected first. In
given weight table T for each of its columns. Note that in the case that some columns
have already been selected, and the rest of the columns would like to be sorted in
order to be selected according to their df/qw values, the weight table used for the
calculation of df/qw should consist of only those columns to be selected — it should
not include those already selected into the solution. When some columns are selected
and removed from the set of columns to be considered, those documents covered by
these columns may also be taken away from being considered. Note that the document
weights for the rest of the documents do not change, but the query weight of each
remaining column may be changed due to the removal of some of the documents from
being considered. Finally, while document frequency (df) does not change, df/qw may
be changed. In general, during the GA execution, the set of columns to be selected
keeps changing, and thus, the calculation of df/qw becomes dynamic.
Example 4. Table 4 (a) shows an initial table T and the df/qw of each column. Based
on the df/qw, the columns are sorted in increasing order as [q4, q3, q5, q l , q2]. Now
suppose that q4 and q3 have been selected into a solution. As a consequence,
documents d l , d2, d3, d4, d6, d7, d9 are covered. The rest will be chosen among
columns q l , q2, q5 in order to cover documents d5, d8. The rest of columns {ql, q2,
q5} should be sorted in order to select the next column into the solution. Table 4 (b)
shows a new table after removing from the initial weight table T columns 3 and 4, and
documents d l , d2, d3, d4, d6, d7, d9. Note that in this example, the document weights
of d5, d8 do not change; document frequencies of ql, q2, q5 do not change. However,
due to the removal of documents d3, d6, the query weight of ql is changed from 1.49
to 0.83. As a consequence, while df of ql is still 4, the df/qw of ql changes from 2.66
to 4.82. Based on the new table, columns q l , q2, q5 are sorted as [ql, q5, q2].
Table 4 Dynamic calculation of df/qw.
Table 4 (a)
Document 1 Document 2 Document 3 Document 4 Document 5 Document 6 Document 7 Document 8 Document 9 df qw df/qw Query 1 0 0 0.33 0 0.5 0.33 0 0.33 0 4 1.49 2.66 Query 2 0 0 0 0 0 0.33 0 0.33 0 2 0.66 3.00 Query 3 1 0.5 0.33 0.5 0 0 0 0 0.33 5 2.66 1.87 Query 4 0 0.5 0 0 0 0.33 1 0 0.33 4 2.16 1.84 Query 5 0 0 0.33 0.5 0.5 0 0 0.33 0.33 5 1.99 2.50 Doc we 1 0.5 0.33 0.5 0.5 0.33 1 0.33 ', 0.33 '. Document 5 Document 8 df qw df/qw Query 0.5 0.33 4 0.83 4.82
Table 4 (b)
1 Query 2 Query 5
0 0.5 |
0.33 0.33 j
2 5
0.33 0.83
6.06 6.02
doc weight :
0.5 i
0.33
•
j
i
Given a table T and a set Q of columns that appear in T but are selected, the following
algorithm calculated the df/qw for all the columns not in Q and returns a sorted list
CQPofthem.