POLLI, ERIC W. Exploring the Conversion of Tertiary Denitrification to Mainstream
Deammonification: Pilot Scale Filter Results and Challenges. (Under the direction of Dr. Francis L. de los Reyes III and Dr. Tarek N. Aziz).
The conventional treatment process for nitrogen removal is the coupling of nitrification
and denitrification processes, completed by ammonia-oxidizing bacteria (AOB), nitrite-oxidizing
bacteria (NOB) and heterotrophic denitrifiers. Nitrification is a major consumer of energy in
wastewater treatment (70 – 80% of total consumption) and effective denitrification commonly
needs an external carbon source. Increasing need for a nutrient removal process that is
environmentally and economically sustainable and provides infrastructure security has arisen due
to the current operating practices. The deammonification process (nitritation-anammox) is a
two-step process where ammonium is partially oxidized to nitrite aerobically by AOB, and the
remaining ammonium is oxidized by anaerobic AOB to form dinitrogen gas using nitrite as an
electron acceptor. Researchers have shown that the use of mainstream deammonification could
result in a 60% reduction of oxygen demand, approximately 100% reduction in external carbon,
and 80% reduction of excess sludge compared to conventional biological nutrient removal.
Significant progress in mainstream deammonification and anammox research has been achieved;
however, an alternative reactor design that utilizes existing infrastructure, reducing costs of
implementation, is needing to be explored. In this study, two pilot-scale tertiary anammox filters
were operated under mainstream conditions to explore the application of tertiary anammox
filters. The goal of this pilot project was to operate and maintain (e.g. backwash) these filters to
explore their ability to achieve the total nitrogen (TN) removal needed to meet low nutrient
limits while operating at realistic hydraulic loading rates (HRT) and nitrogen loading rates
both Phase 2 and Phase 3, the anammox filter was shown to meet a low TIN effluent
concentration of 2.0 mg/L at realistic filter HRTs. The diurnal NLR results demonstrate the
ability of the anammox filter to respond to a fluctuating load and high peaking factors, while also
providing insight on the maximum concentrations the filter can be exposed to and still meet
effluent limits. Controlling nitrate in the influent and nitrate production within the filter will be
key in meeting effluent limits. An external carbon source like glycerin will likely be required to
control nitrite produced in the filter. Partial denitrification in the filter was observed with the
addition of a small amount of glycerin. Anammox activity was maintained with an increased
backwashing frequency showing the filter was able to retain desired biomass. Nitrite and sCOD
© Copyright 2019 by Eric W. Polli
by Eric W. Polli
A thesis submitted to the Graduate Faculty of North Carolina State University
in partial fulfillment of the requirements for the degree of
Master of Science
Environmental Engineering
Raleigh, North Carolina 2019
APPROVED BY:
_______________________________ _______________________________ Dr. Francis L. de los Reyes III Dr. Tarek N. Aziz
Committee Co-Chair Committee Co-Chair
ii BIOGRAPHY
Eric W. Polli was born in Cary, North Carolina on August 4, 1994 to Joseph and
Christine Polli. In 2012, Eric began his undergraduate studies at North Carolina State University.
Through the Benjamin Franklin Scholars, he completed two degrees during his time at North
Carolina State University: a Bachelor of Science in Environmental Engineering and a Bachelor
of Arts in Foreign Languages and Literature with a focus in Spanish. During his time as an
undergraduate student, Eric participated in the University Honors Program, the NC State Club
Swimming Team, and studied abroad at La Universidad San Francisco de Quito in Quito,
Ecuador. While completing undergraduate research for Dr. Tarek N. Aziz, the opportunity arose
to pursue a Master of Science degree in Environmental Engineering at NC State while being
funded by and working part-time for Hazen and Sawyer. Eric began his graduate degree in the
iii DEDICATION
iv ACKNOWLEDGMENTS
First and foremost, an enormous thanks to Hazen and Sawyer for selecting me as the
candidate to do this incredible research and for providing the funding for both the research and
schooling. Within Hazen, I would like to thank Katya Bilyk and Dr. Wendell Khunjar for
providing invaluable process expertise and guidance throughout the past two years.
I would like to extend a huge thank you to Erika Bailey for providing expertise and
on-site assistant with the pilot. Also, thank you to the staff and operators of the Neuse River
Resource Recovery Facility for allowing me to work in their space and providing assistance
when required.
Of course, an enormous thanks to Dr. Francis L. de los Reyes III and Dr. Tarek N. Aziz
for being mentors throughout the program and providing guidance, expertise, and the
sometimes-required pep talks to keep me motivated and on the correct path. This experience would not have
been the same without the support of both of you.
Finally, thank you to all my fellow grad students, with all their ridiculousness, passion,
and understanding, who made the experience so much more than just school and research. To my
v TABLE OF CONTENTS
LIST OF TABLES ... ix
LIST OF FIGURES ... x
Chapter 1: Introduction ... 1
Chapter 2: Materials and Methods ... 5
Experimental Setup ... 5
Start-up ... 6
Phase 1 ... 6
Phase 2 ... 7
Phase 3 ... 8
Molecular Sampling ... 12
Analytical Procedures ... 12
Pathway Mass Balance Analysis ... 13
Chapter 3: Results... 14
Seeding and Start-up ... 14
Phase 1 ... 15
Effect of Media Type ... 17
Effect of HRT ... 17
Phase 2 ... 19
Effect of HRT ... 21
Effect of Backwashing ... 24
Effect of NO2-:NH4+ Mass Ratio ... 25
Phase 3 ... 26
Effect of a Diurnal Nitrogen Loading Rate... 26
Effect of Glycerin Injection ... 28
Effect of TSS Addition and Increased Backwashing ... 33
Chapter 4: Discussion ... 37
Phase 1 ... 37
Effect of Media Type ... 37
Effect of HRT ... 37
Phase 2 ... 38
Effect of HRT ... 38
Effect of Backwashing ... 39
Effect of NO2-:NH4+ Mass Ratio ... 40
Phase 3 ... 41
Effect of a Diurnal Nitrogen Loading Rate... 41
Effect of Glycerin Injection ... 42
Effect of TSS Addition and Increased Backwashing ... 43
Chapter 5: Conclusions ... 45
References ... 46
Appendices ... 53
Appendix A: Process Flow Diagrams ... 54
vi LIST OF TABLES
Table 2-1. Operating Conditions during Start-up Phase ... 6
Table 2-2. Operating Conditions during Phase 1 ... 7
Table 2-3. Operating Conditions during Phase 2 ... 8
Table 2-4. Operating Conditions during the Diurnal Nitrogen Loading Experiment ... 9
Table 2-5. Operating Conditions during the Glycerin Injection Experiment ... 10
Table 2-6. Operating Conditions during the TSS Addition & Increased Backwashing Experiment ... 11
Table 3-1. Average removal or production of all species in the CMF and DMF for Entire Phase 1 ... 17
Table 3-2. Average removal or production of all species in the CMF and DMF at two HRTs ... 19
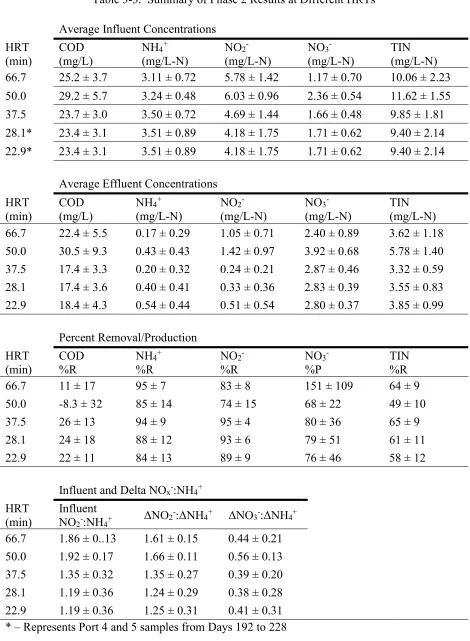
Table 3-3. Summary of Phase 2 Results at Different HRTs ... 24
Table 3-4. Summary of Phase 3 Glycerin Injection Experiment Results ... 34
Table 3-5. Summary of Phase 3 TSS Addition and Increased Backwashing Experiment Results ... 38
Table B-1. Phase 1 Clean Media Filter Influent Data ... 60
Table B-2. Phase 1 Clean Media Filter Effluent Data ... 61
Table B-3. Phase 1 Dirty Media Filter Influent Data ... 62
Table B-4. Phase 1 Dirty Media Filter Effluent Data ... 63
Table B-5. Phase 2 Clean Media Filter Data 66.7-min HRT ... 64
Table B-6. Phase 2 Clean Media Filter Data 50.0-min HRT ... 65
Table B-7. Phase 2 Clean Media Filter Data 37.5-min HRT ... 66
Table B-8. Phase 3 Diurnal Loading Rate Data ... 67
Table B-9. Phase 3 Glycerin Injection Experiment Data ... 68
vii LIST OF FIGURES
Figure 3-1. Effluent from batch test, Nitrogen species concentrations for the
clean media filter ... 14
Figure 3-2. Effluent from batch testing, Nitrogen species concentrations for the dirty media filter ... 15
Figure 3-3. Average Influent and Effluent Nitrogen Species for the Clean Media (left) and Dirty Media (right) Filters ... 16
Figure 3-4. Phase 2 Influent Nitrogen Species Concentrations with colored shading indicating the different HRTs ... 20
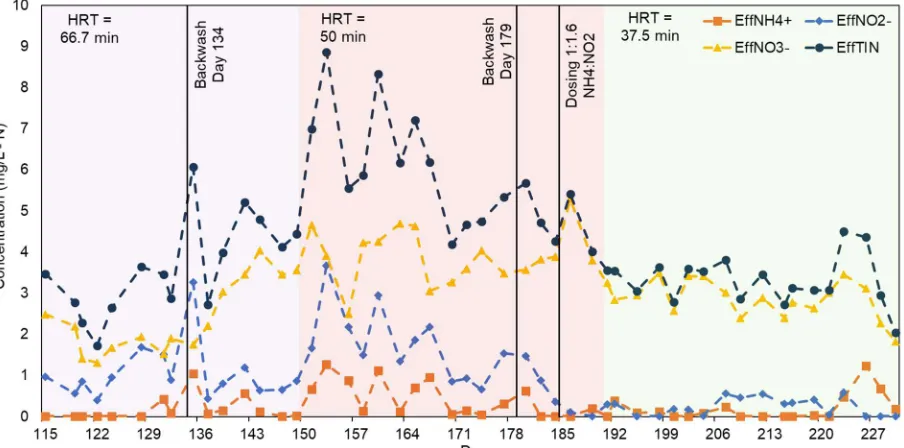
Figure 3-5. Phase 2 Effluent Nitrogen Species Concentrations with colored shading indicating the different HRTs ... 20
Figure 3-6. Phase 2 Influent and Effluent sCOD Concentrations with colored shading indicating the different HRTs ... 21
Figure 3-7. Phase 2 Influent and Delta ΔNOx-:ΔNH4+ Mass Ratios with colored shading indicating the different HRTs ... 21
Figure 3-8. Phase 2 37.5-min HRT Port 4 and 5 Effluent N Species Concentrations ... 25
Figure 3-9. Diurnal NLR Influent & Effluent N Species Concentrations, TIN Percent Removal ... 28
Figure 3-10. Glycerin Injection Experiment, Influent N Species Concentrations ... 32
Figure 3-11. Glycerin Injection Experiment, Effluent N Species Concentrations ... 32
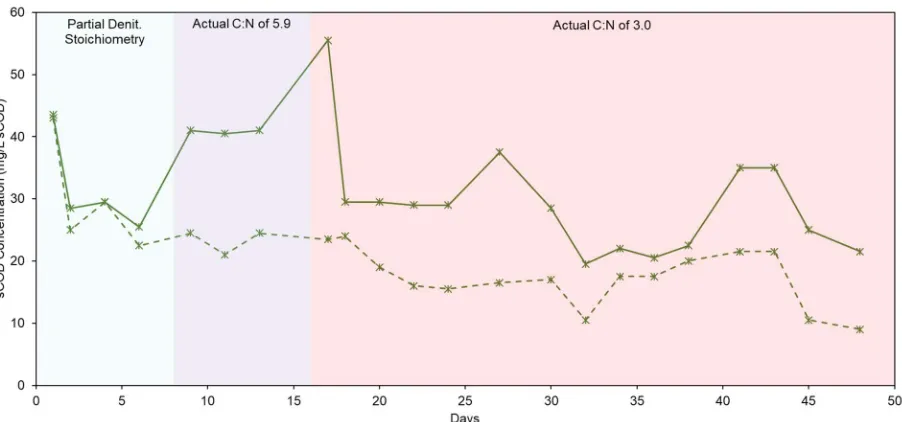
Figure 3-12. Glycerin Injection Experiment, Influent and Effluent sCOD Concentrations ... 33
Figure 3-13. Glycerin Injection Experiment Day 32, No Exogenous Nitrite Addition Profile Sample ... 33
Figure 3-14. TSS Addition/Backwashing Experiment, Influent N Species Concentrations ... 36
Figure 3-15. TSS Addition/Backwashing Experiment, Effluent N Species Concentrations ... 36
Figure 3-16. TSS/Backwashing Experiment, Port 4 and Port 5 Effluent N Species Concentrations ... 37
viii Figure A-2. Phase 1 Process Flow Diagram ... 58
1 CHAPTER1: INTRODUCTION
The goal of biological nutrient removal (BNR) in wastewater treatment is to prevent
discharge of excessive levels of nitrogenous and phosphorous compounds. The conventional
treatment process for nitrogen removal is the coupling of nitrification and denitrification
processes, completed by ammonia-oxidizing bacteria (AOB), nitrite-oxidizing bacteria (NOB)
and heterotrophic denitrifiers (Guo et al., 2013). Nitrification is a major consumer of energy in
wastewater treatment (70 – 80% of total consumption) and effective denitrification commonly
needs an external carbon source (Siegrist et al., 2008; Kartal et al., 2010; Laureni et al. 2016;
McCarty, 2018). Additional nitrogen removal can be completed through denitrification filters
placed after the secondary treatment process; however, an external carbon source will be
required. Another drawback of conventional treatment is the release of greenhouse gases (GHG),
such as N2O from incomplete nitrification (Thakur et al., 2019; Mannina et al., 2019). Increasing
need for a nutrient removal process that is environmentally and economically sustainable (i.e.
reduces GHG emissions and treatment costs) and provides infrastructure security (i.e. decreases
reliance on external resources) has arisen due to the current operating practices. Shortcut
nitrogen treatment such as mainstream anaerobic ammonium oxidation (anammox) is a possible
process.
The anammox process was first predicted to exist in the 1970s through thermodynamic
calculations (Broda, 1977). In the 1990s, a group of bacteria called anaerobic ammonium
oxidizing bacteria (AnAOB) was discovered to anaerobically convert ammonia to dinitrogen gas,
utilizing nitrite as the electron acceptor (van de Graaf et al., 1996; Strous et al. 1999). The
2 NH4+ + 1.32NO2̄ + 0.066HCO3̄ + 0.13H+ 1.02N2 + 0.26NO3̄ + 0.66CH2O0.5N0.15 + 2.03H2O
The deammonification process (nitritation-anammox) is a two-step process where
ammonium is partially oxidized to nitrite aerobically by AOB, and the remaining ammonium is
oxidized by AnAOB to form dinitrogen gas using nitrite as an electron acceptor (van Loosdrecht,
2008). Researchers have shown that the use of deammonification could result in a 60% reduction
of oxygen demand, approximately 100% reduction in external carbon, and 80% reduction of
excess sludge compared to conventional BNR (Jetten et al., 1997; Wett et al., 2007; Daigger,
2014; Cao et al., 2017). Mainstream deammonification allows separation of carbon and nitrogen
removal, and the use of the excess carbon for biogas production through anaerobic digestion
(Jetten et al., 1997; Cao et al., 2017; McCarty, 2018). Siegrist et al. (2008) suggest WWTP
energy consumption can be reduced by over 50% when utilizing a treatment process with
anammox. Currently, the most common applications of deammonification are in industrial
wastewater treatment and sidestream municipal wastewater treatment (Cao et al., 2017). By
2014, over 100 full-scale installations were estimated to be in operation worldwide for
sidestream treatment (Lackner et al., 2014). While there has been success in sidestream
deammonification (Lackner et al., 2014; Wett, 2007), mainstream treatment has not been fully
realized. The main challenges that mainstream deammonification applications face are high C:N
ratios in primary effluent, low free ammonium and free nitrous acid concentrations for NOB
suppression, low activity of AnAOB especially at low temperatures, seasonal variation of
mainstream wastewater, anammox retention, and meeting final effluent limits (Lackner et al.,
3 Significant progress in mainstream deammonification and anammox research has been
achieved (Wett, 2007; Ma et al., 2015; Lotti et al., 2016; Cao et al., 2017). Nitritation operations
have been studied and proven to work reliably (Ma et al., 2011; Gu et al., 2018). Research into
single-stage applications, where nitritation and anammox occur in one reactor, have shown
single-stage systems to not reach low effluent TN concentrations (O’Shaughnessy, 2015; Cao et
al., 2017). Two-stage applications (separate reactors for nitritation and anammox), while less
researched, have more promise in process stability and capability of meeting low effluent TN
(Ma et al., 2011; O’Shaughnessy, 2015; Cao et al., 2017; Gu et al., 2018; McCarty, 2018).
Different reactor configurations such as moving bed biofilm reactors (MBBR), integrated-fixed
film activated sludge (IFAS) systems, and upflow membrane-aerated biofilm reactors (UMABR)
have been studied for mainstream applications. However, all would require new infrastructure
when implemented at an existing plant (Ma et al., 2011; Lemaire et al., 2014; Li et al., 2015;
Regmi et al., 2016; Cao et al., 2017; Gu et al., 2018). An alternative reactor design that utilizes
existing infrastructure, thereby reducing costs of implementation, needs to be explored.
A possible option for a two-stage system where existing infrastructure is utilized is the
shifting of existing BNR tanks to operate in a nitritation mode, coupled with the conversion of
existing tertiary denitrification filters to tertiary anammox filters. To date, the utilization of
anammox in a tertiary rapid sand filtration design (i.e. converting denitrification filters) has not
been explored for mainstream treatment. Implementing anammox in a filter as a biofilm
overcomes the challenge of biomass retention. Converting denitrification filters to anammox
filters requires no new structures, unlike other proposed mainstream deammonification
processes, producing minimal costs for implementation. Minimal process control (e.g.,
4 denitrification filters. Tertiary anammox filters used for polishing can potentially overcome the
challenge of meeting final effluent limits as seen by current single-stage systems.
In this study, two pilot-scale tertiary anammox filters were operated under mainstream
conditions to explore the application of tertiary anammox filters. The goal of this pilot project
was to operate and maintain (e.g., backwash) these filters to explore their ability to achieve the
TN removal needed to meet low nutrient limits while operating at realistic HRTs and nitrogen
loading rates. This research presents a proof of concept for tertiary anammox filters and does not
explore the complete two-stage application. The demonstrated reliable performance from the
pilot-scale tertiary anammox filters will advance the application of anammox in full-scale,
5 CHAPTER 2: MATERIALS AND METHODS
Experimental Setup
Process flow diagrams of the filter system during each phase are shown in Appendix A.
Each filter had a working volume of 33.4 L (1.83 m bed depth, 0.15 m column diameter) and had
six ports along the depth for sampling. The first port was located 0.15 m below the top of the
filter height, with subsequent ports placed at 0.30 m spacing. Sand (effective grain size = 2.75
mm, uniformity coefficient = 1.23, sphericity = 0.90) was taken from the NRRRF denitrification
filters and used as the media for the filters. To compare start-up between clean and “dirty”
media, half of the volume of the sand was cleaned by washing in 10% (1 L bleach:9 L DI water)
bleach solution to remove attached biomass; the other half was kept with the attached biomass.
The added anammox granules were taken from the underdrain of Hampton Roads Sanitation
District’s full-scale sidestream DEMON process. Approximately 750 mL of underdrain granular
sludge was seeded into each filter by pouring the mixed liquor onto the top layer of the media.
Source water into the pilot anammox filters was post-denitrification filter effluent from
NRRRF stored in a 1900 L tank. When batch dosing in Start-up and Phase 1, two peristaltic
pumps were used to supply ammonium and nitrite concentrated solutions (ammonium chloride
(NH4Cl) and sodium nitrite (NaNO2)) to the source water tank as the tank was filled using a
submersible pump. Each filter had its own peristaltic pump which ensured the correct flow from
source water tank. In Phase 2 and Phase 3, the two peristaltic pumps used for batch dosing were
used to provide in-line dosing of a concentrated blend of ammonia and nitrate at the target doses.
The mainstream conditions of pH and temperature were tested by using plant process water as a
source, including the variation due to seasonal change. The pH and temperature throughout the
6 experiment, “pseudo-steady state” was defined as the condition when the 3-day average effluent
NO2- concentration reached below 1.0 mg/L-N and TIN percent removal was greater than 50%.
The HRT was reduced by 25% when effluent quality met the criteria above.
Start-up
The goal of the start-up phase was to promote growth and establish an anammox
population in the filters. Table 2-1. Operating Conditions during Start-up Phase displays the
operating conditions of the filters for the duration of Start-up. The filters were operated in a
batch process and fed fresh influent every day. The 1900 L tank was dosed every 3 days with the
target ammonium and nitrite concentrations. The target dose concentrations provided a NH4+:
NO2- mass ratio of 1:1.5. These values and the NH4+: NO2- mass ratio were chosen based on
previous literature and the anammox pathway stochiometric ratio of 1 mg NH4+-N to 1.32 mg
NO2--N.
Table 2-1. Operating Conditions during Start-up Phase
Feeding Operation Batch
Target NH4+ 3.0 mg/L-N
Target NO2- 4.5 mg/L-N
Temperature 17.9 – 24.7°C
pH 6.0 – 7.1
Phase 1
Phase 1 extended from Day 1 to Day 76 with continuous flow into the pilot filters. In this
7 investigated. Table 2-2. Operating Conditions during Phase 1 specifies the operating conditions
of the filters for the duration of this phase. Ammonium and nitrite were batch dosed into the
1900 L tank at a NH4+:NO2- mass ratio of 1:1.5 with the target concentrations outlined in Table
2-2. A backwash at a rate of 12 gpm for one to two minutes occurred on Day 69 due to the filter
reaching maximum head loss. On Day 76, the dirty media filter was taken offline due to an
irreparable leak.
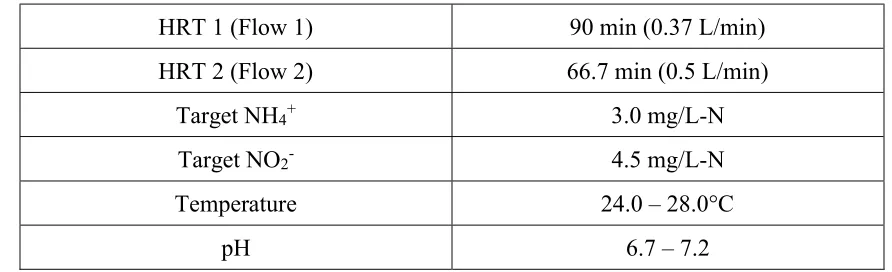
Table 2-2. Operating Conditions during Phase 1
HRT 1 (Flow 1) 90 min (0.37 L/min)
HRT 2 (Flow 2) 66.7 min (0.5 L/min)
Target NH4+ 3.0 mg/L-N
Target NO2- 4.5 mg/L-N
Temperature 24.0 – 28.0°C
pH 6.7 – 7.2
Phase 2
Phase 2 (only for the clean media filter) extended from Day 86 to Day 230. The goal of
this phase was to explore the filter performance as HRT decreased. Table 2-3 presents the
operating conditions of the filter during Phase 2. To estimate the reactor performance at
approximately 25-minutes HRT during the overall empty-bed HRT of 37.5 minutes, samples
from Ports 4 (22 min.) and 5 (28 min.) were collected and analyzed. At the start of the phase, the
NH4+: NO2- mass ratio was increased to 1:2 due to Phase 1 performance. After seeing almost
complete ammonium removal and excess nitrite, the NH4+: NO2- mass ratio was decreased to
8 Table 2-3. Operating Conditions during Phase 2
HRT 1 (Flow 1) 66.7 min (0.5 L/min)
HRT 2 (Flow 2) 50.0 min (0.67 L/min)
HRT 3 (Flow 3) 37.5 min (0.89 L/min)
Target NH4 3.0 mg/L-N
Target NO2- 1 (Ratio 1:2.0) 6.0 mg/L-N
Target NO2- 2 (Ratio 1:1.6) 4.8 mg/L-N
Temperature 16.0 – 27.1°C
pH 6.3 – 7.1
Phase 3
Phase 3 (Day 234 to Day 313 of continuous flow operation to the clean media filter)
included three “stress test” experiments: diurnal nitrogen loading, glycerol injection, and TSS
addition with increased backwash frequency. Again, to estimate close to a 25-minute HRT,
samples from Ports 4 (22 min.) and 5 (28 min.) were collected and analyzed for all
sub-experiments in Phase 3.
The diurnal nitrogen loading (see Table 2-4 for operating conditions) was a three-day
experiment where the influent loading varied over time in a similar fashion to that of NRRRF’s
influent. Using NRRRF plant data, high and low ammonia loading peaking factors were found to
be 1.3 and 0.6. For the experiment, the high peaking factor was increased to 1.5. The influent
ammonium and nitrite values were changed every six hours to resemble the diurnal loading. An
influent-effluent sample was taken an hour after each high peaking factor of 1.5 was initiated,
while profiles were taken at the end of the six hours. Only influent and effluent samples were
9 Table 2-4. Operating Conditions during the Diurnal Nitrogen Loading Experiment
HRT (Flow) 37.5 min (0.89 L/min)
Low Peaking Factor 0.6
High Peaking Factor 1.5
Baseline NH4+ Target 3.0 mg/L-N
Baseline NO2- Target 4.8 mg/L-N
Target NH4+:NO2- 1:1.6
Temperature 16.9 – 17.6°C
pH 6.8 – 6.9
A glycerin injection experiment was performed for 48 days from Day 245 to Day 293
(Table 2-5 shows operating conditions). The goal of this experiment was to provide adequate
carbon to promote partial denitrification and reduce exogenous nitrite addition. An additional
peristaltic pump was required to inject the diluted glycerin mixture into the filter feed line. All
glycerin addition values were calculated based on converting 2.0 mg/L NO3-N via partial
denitrification. The original amount of carbon added was based on the stoichiometry of partial
denitrification using glycerin and did not consider oxygen demand nor biomass yield. The carbon
dosing was then increased based on the theoretical glycerin C:N ratio for partial denitrification
(includes biomass yield), producing an actual C:N ratio of 5.9, which includes an assumption of
oxygen demand on 2.0 mg/L. After 8 days, the glycerin dose was decreased to target an actual
C:N ratio of 3.0. The ammonium and nitrite dose targeted for the first eight days of this
experiment were a NH4+: NO2- mass ratio of 1:1.6. The mass ratio was reduced by 25% to 1:1.2
on Day 8. On Day 31, exogenous nitrite addition was stopped to investigate if partial
denitrification was occurring with the glycerin addition. After 9 days of no exogenous nitrite,
10 on to the final stress test. A gas bump backwash occurred every one to two days. This gas bump
was a backwash at 12 gpm for typically 30 seconds, or until no more gas bubbles were seen
being discharged into the headspace.
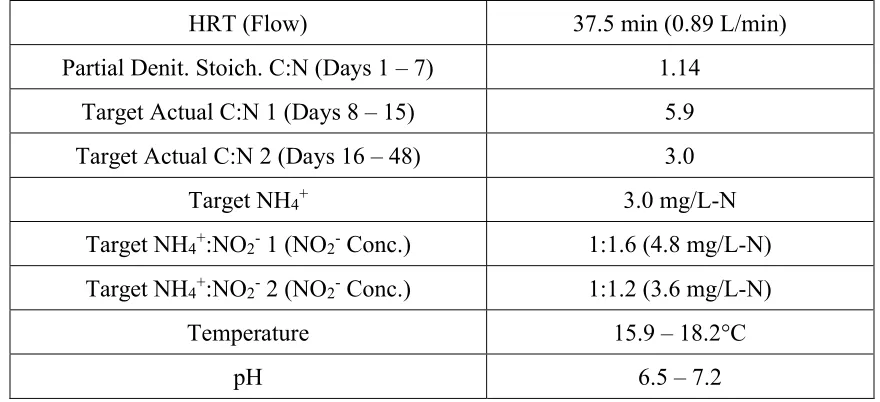
Table 2-5. Operating Conditions during the Glycerin Injection Experiment
HRT (Flow) 37.5 min (0.89 L/min)
Partial Denit. Stoich. C:N (Days 1 – 7) 1.14
Target Actual C:N 1 (Days 8 – 15) 5.9
Target Actual C:N 2 (Days 16 – 48) 3.0
Target NH4+ 3.0 mg/L-N
Target NH4+:NO2- 1 (NO2- Conc.) 1:1.6 (4.8 mg/L-N)
Target NH4+:NO2- 2 (NO2- Conc.) 1:1.2 (3.6 mg/L-N)
Temperature 15.9 – 18.2°C
pH 6.5 – 7.2
The final stress test was adding TSS into the influent to simulate secondary effluent and
increase the complete backwash frequency. Table 2-6 provides the operating conditions for this
sub-experiment in Phase 3. Mixed liquor suspended solids (MLSS) were taken from the end of
the aerated zone in BNR Basin No. 6 at NRRRF, with the MLSS concentration in the basin
averaging around 3,300 mg/L. The averaged MLSS value was diluted by a factor of 20 to
produce a target semi-continuous TSS influent concentration of 165 mg/L. The semi-continuous
pumping of 165 mg/L-TSS at one minute per hour produced an equivalent continuous TSS dose
of approximately 10 mg/L-TSS. A dose of 10 mg/L-TSS was selected as the NRRRF secondary
effluent averages approximately that value. The diluted solids were pumped into the filter for
11 addition was quantified following the Method 2540 D for Total Suspended Solids Dried at 103 –
105°C. A complete backwash was completed every one to two days at 12 gpm for 2 minutes,
which allowed for the water level in the filter to recede to the wet well elevation. Glycerin
continued to be injected at an actual C:N of 3.0.
Table 2-6. Operating Conditions during the TSS Addition & Increased Backwashing
Experiment
HRT (Flow) 37.5 min (0.89 L/min)
Target NH4+ 3.0 mg/L-N
Target NO2- 4.5 mg/L-N
Target Continuous TSS 10 mg/L-TSS
Semi-continuous Flow ~ 1.1 m/s
Target Semi-continuous TSS 160 mg/L-TSS
Temperature 16.9 – 20.1°C
pH 6.8 – 7.1
Molecular Sampling
Biomass samples were collected from the backwash effluent and represent a mixed
profile of the entire filter culture. Collected samples were centrifuged at 3750 rpm for 20
minutes, decanted, and frozen prior to DNA analysis. Samples of the clean media reactor were
taken at the end of all testing from the top biomass layer and at each sample port to determine a
distribution in the community throughout the filter bed. Approximately 200 mL of sand was
added to 200 mL of water taken from the filter and vortexed at max speed for 2-3 minutes to
detach and suspend the attached growth. The liquid was drained, and the sample centrifuged at
12 DNA extraction will be completed following the Aluminum Sulphate Method. Quality of
DNA will be confirmed using a NanoDrop 1000 before completing PCR and gels. 16S
metagenomic sequencing library preparation will be performed in accordance to the procedure
for Illumina MiSeq System.
Analytical Procedures
Liquid samples were collected three times a week: one profile sampling and two
influent-effluent only. Sample points in the experimental setup were source water, dosed influent, filter
effluent, and ports along the filter (for profile sampling). All liquid samples were filtered through
0.45 μm filters to removal all particulate matter. The concentrations of soluble COD (sCOD),
ammonium (NH4+-N), nitrite (NO2--N), and nitrate (NO3--N) of the liquid samples were
measured throughout the pilot runs. sCOD concentrations were measured using USEPA Reactor
Digestion Method (Method 8000). Ammonia, nitrate, and nitrite concentrations were determined
using Methods 10205, 10206, and 10207, respectively. While testing for sCOD and nitrate,
sulfamic acid was added to samples with nitrite concentrations above 1.0 mg/L-N due to the
possible nitrite interference in the utilized methods. Dissolved oxygen (DO) was measured using
a portable multiparameter Orion Star™ meter.
Pathway Mass Balance Analysis
The collected data was run through a Solver based Excel mass balance model constructed
from stoichiometric ratios for all possible nitrogen transformation pathways. The mass balance
13 experiment. The goal of this analysis was to determine a range of ammonia and nitrite
14 CHAPTER 3: RESULTS
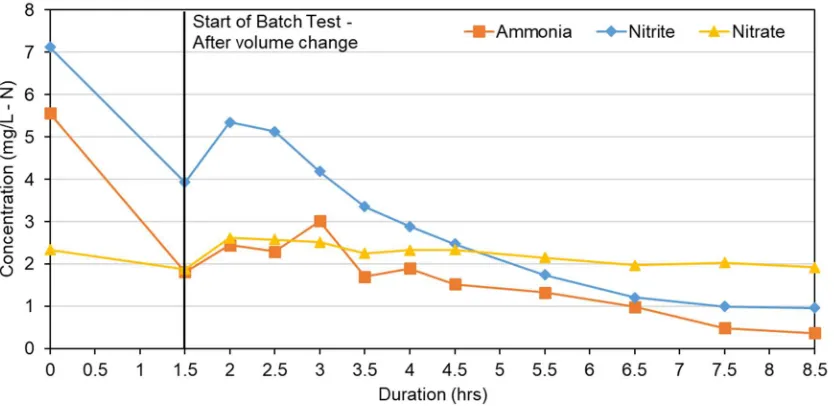
Seeding and Start-up
During the start-up phase, the filters were operated in batch mode with a change in
volume every 24 hours and an influent target NO2-:NH4+ mass ratio of 1.5. The nitrogen species’
concentrations in the dosed 500 gallon tank for the batch test are registered at time zero on
Figure 3-1. Effluent from batch test, Nitrogen species concentrations for the clean media filter
and Figure 3-2. The 1.5-hour mark on both figures below represents when the batch test
sampling began, which occurred after a full filter volume change. Over the 7-hour batch test, the
concurrent removal of ammonium and nitrite within the clean media filter suggested anammox
activity. In contrast, the ammonium and nitrite removal patterns in the dirty media filter did not
indicate anammox activity (Figure 3-2). Instead, the slowly increasing ammonium concentration
and non-detectable nitrate concentration indicated decaying biomass from the denitrifying filter
media and the dominance of heterotrophic nitrate reduction. After 49 days of batch operation,
experiments were stopped and continuous flow through the filters began.
15 Figure 3-2. Effluent from batch testing, Nitrogen species concentrations for the dirty media filter
Phase 1
Both the clean media filter (CMF) and the “dirty” media filter (DMF) were fed the same
influent during Phase 1 at a target NO2-:NH4+ of 1.5 by mass. Influent nitrogen concentrations
varied noticeably as seen in the high standard deviations, likely due to biological growth in the
source water tank. This growth was controlled in later experiments (discussed below). The
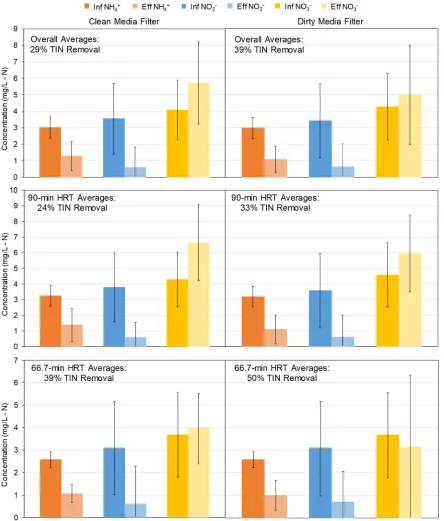
averages of the nitrogen species (Figure 3-3) in the influent and effluent for each filter, during
Phase 1, the 90-min HRT, and the 66.7-min HRT, show ammonium being removed to nearly 1.0
mg/L-N, nitrite to below 1.0 mg/L, and nitrate typically being produced. The overall average
16 Figure 3-3. Average Influent and Effluent Nitrogen Species for the Clean Media (left) and Dirty
17
Effect of Media Type
Table 3-1 presents the average percent removal or production for all species for the CMF
and DMF over the entire duration of Phase 1. In terms of overall performance in Phase 1, the
DMF had a higher average TIN volumetric removal rate (0.072 kg/m3-d) compared to that of the
CMF (0.056 kg/m3-d). Average TIN percent removal for the DMF (39%) was 10 percent higher
than that of the CMF (29%). The CMF had slightly lower ammonia removal efficiency of 59%
compared to that of the DMF (64%). Nitrite removal efficiencies in the filters were similar, with
the CMF averaging 88% and the DMF averaging 86%. The sCOD removal increased with a
decrease in HRT for the CMF (4.7% to 17%). However, there was COD release observed in the
DMF after the decrease in HRT (from a 9.1% COD removal to an 18% COD increase in the
effluent). The CMF had a higher nitrate production than the DMF (48% vs 22%). The CMF and
DMF had an overall average ΔNO2-:ΔNH4+ mass ratios of 1.80 and 1.65, respectively. The
overall average ΔNO3-:ΔNH4+ mass ratios for the CMF and DMF were 0.945 and 0.515,
respectively. The pathway mass balance analysis completed on the Phase 1 data yielded an
average anammox ammonia consumption for the CMF of 56% of the total ammonia removal
compared to 62% for the DMF. The average annamox nitrite consumption was approximately
46% and 60% of the total nitrite removal for the CMF and DMF, respectively.
Table 3-1. Average removal or production of all species in the CMF and DMF for Entire Phase 1
Treatment (number of samples = 26) COD
%Removal
NH4+ %Removal
NO2 -%Removal
NO3 -%Production
TIN %Removal
CMF 8.9 ± 21 59 ± 24 88 ± 21 48 ± 46 29 ± 18
18
Effect of HRT
Table 3-2 presents the average percent removal or production for all species for the CMF
and DMF at two HRTs. The average influent TIN volumetric loading rate was 0.201 kg/m3-d
during the 66.7 min-HRT compared to 0.181 kg/m3-d for the 90-min HRT. At both HRTs in this
phase, the DMF had better average TIN removal than the CMF. Average TIN percent removal
improved for both filters when the HRT was decreased. TIN volumetric removal rate average for
the DMF increased from 0.059 kg/m3-d to 0.097 kg/m3-d with the decrease in HRT. Similarly,
the CMF’s average TIN volumetric removal rate increased from 0.043 kg/m3-d to 0.080 kg/m3-d.
There was a decrease in the DMF’s average ammonium removal with the decrease in HRT (67%
to 58%), while the CMF’s remained at a similar level (59% to 57%). The average nitrite removal
was similar for both filters across HRTs. There was a decrease in nitrate production between the
90-min HRT and 66.7-min HRT for both filters. With the decrease in HRT, sCOD consumption
increased slightly for the CMF, while on average there was sCOD production in the DMF. The
CMF average ΔNO2-:ΔNH4+ mass ratio decreased from 1.86 to 1.68 with the decrease in HRT.
Average ΔNO3-:ΔNH4+ mass ratio of the CMF decreased from 1.32 to 0.244 when HRT was
reduced. The DMF average ΔNO2-:ΔNH4+ mass ratio increased slightly from 1.63 to 1.68 with
the HRT decrease. Average ΔNO3-:ΔNH4+ mass ratio of the DMF decreased from 0.658 to 0.244
19 Table 3-2. Average removal or production of all species in the CMF and DMF at two HRTs
90-minute HRT (N = 17) 66.7-minute HRT (N = 9) COD
%R
NH4+ %R
NO2 -%R
NO3 -%P
TIN %R
COD %R
NH4+ %R
NO2 -%R
NO3 -%P
TIN %R
CMF 4.7 ± 16 59 ± 27 89 ± 12 63 ± 41 24 ± 9 17 ± 27 57 ± 17 86 ± 34 20 ± 45 39 ± 27
DMF 9.1 ± 30 67 ± 27 87 ± 15 36 ± 36 33 ± 8 -18 ± 54 58 ± 29 83 ± 29 -5.1 ± 118 50 ± 42 Phase 2
The second phase of continuous operation was performed over 115 days with only the
clean media filter. During Phase 2, the HRT was decreased from 66.7 minutes to 50.0 minutes,
and then to 37.5 minutes. The change to in-line dosing provided a more stable ammonium (3.29
± 0.66 mg/L-N) and nitrite concentrations (5.47 ± 1.40 mg/L-N) to the CMF (Figure 3-4)
compared to the concentrations in Phase 1. The fluctuations in influent concentrations were due
to the high sensitivity of the speed of the dosing pump. During most of Phase 2, the CMF saw
influent nitrite concentrations higher than ammonium concentrations, producing influent NO2
-:NH4+ mass ratio greater than 1.0 (Figure 3-4, Figure 3-7). The variability in nitrate and sCOD
concentrations were due to the fluctuation in source water quality (Figure 3-4, Figure 3-6).
Average influent TIN loading increased from 0.217 kg/m3-d at 66.7-min HRT, to 0.328 kg/m3-d
at 50-min HRT, to 0.379 kg/m3-d at 37.5-min HRT. The CMF in Phase 2 was
ammonium-limited as there was typically excess effluent nitrite, and nitrate consistently was the majority of
20 Figure 3-4. Phase 2 Influent Nitrogen Species Concentrationswith colored shading indicating
the different HRTs
Figure 3-5. Phase 2 Effluent Nitrogen Species Concentrations with colored shading indicating
21 Figure 3-6. Phase 2 Influent and Effluent sCOD Concentrations with colored shading indicating
the different HRTs
Figure 3-7. Phase 2 Influent and Delta ΔNOx-:ΔNH4+ Mass Ratios with colored shading
22
Effect of HRT
As expected, when decreasing the HRT from 66.7 minutes to 50 minutes, performance
decreased across the board for ammonium, nitrite, and TIN removal (Table 3-3). Nitrate
production also decreased when reducing the HRT to 50 minutes (151% to 68%). Further
reduction in the HRT to 37.5 minutes showed increases in performance, but slightly more nitrate
production (12% increase). Overall TIN and ammonium removal were comparable at 66.7-min
HRT and 37.5-min HRT. The average volumetric TIN removal rate at 66.7 min, 50 min, and
37.5 min HRTs were 0.139 kg/m3-d, 0.169 kg/m3-d), and 0.251 kg/m3-d, respectively. The CMF
was able to reach steady-state more quickly after transitioning to the 37.5-min HRT than when
the HRT was reduced to 50 minutes (Figure 3-5). An average sCOD consumption of 26% was
observed at the 37.5-min HRT while sCOD removal at the 50 and 66.7 min HRTs was < 20%.
The ΔNO2-:ΔNH4+ mass ratio at the 66.7-min HRT and 50-min HRT followed a similar trend
(Figure 3-7). The ΔNO3-:ΔNH4+ mass ratio at the 50-min HRT stayed at similar values as during
the latter part of the 66.7-min HRT run. After 13 days of operation at a 37.5-min HRT, the
ΔNO2-:ΔNH4+ mass ratio began decreasing toward the theoretical stoichiometric ratio (1.32) of
nitrite consumed per ammonium oxidized. The ΔNO3-:ΔNH4+ mass ratio also trended toward the
theoretical stoichiometric ratio (0.26) of nitrate produced per ammonium oxidized. Results from
samples at Ports 4 (22.9-min HRT) and 5 (28.1-min HRT) show the filter removing the majority
of the TIN by the 22.9-min HRT (Table 3-3, Figure 3-8). Neither Port 4 nor Port 5 reached < 2.0
mg/L-N TIN effluent concentration; however, the effluent was primarily nitrate. The ΔNO2
-:ΔNH4+ mass ratio for the equivalent 22.9 and 28.1-min HRTs were similar to each other, but
slightly lower than that at the 37.5-min HRT. The difference is due to the extra removal seen in
23 mass ratio were about equal. The pathway mass balance analysis completed on the Phase 2 data
taken at a 66.7-min HRT yielded an average anammox ammonia consumption for the CMF of
77% of the total ammonia removal. The average annamox nitrite consumption was
approximately 63% of the total nitrite removal for the CMF during the 66.7-min HRT. The
average anammox ammonia and nitrite consumption during the 50.0-min HRT increased to
approximately 84% and 69%, respectively. With the decrease to a 37.5-min HRT, the average
anammox ammonia decreased to 79% while the average anammox nitrite consumption increased
24 Table 3-3. Summary of Phase 2 Results at Different HRTs
Average Influent Concentrations HRT
(min) COD (mg/L) NH 4+
(mg/L-N) NO
2-
(mg/L-N) NO
3
-(mg/L-N) TIN (mg/L-N) 66.7 25.2 ± 3.7 3.11 ± 0.72 5.78 ± 1.42 1.17 ± 0.70 10.06 ± 2.23 50.0 29.2 ± 5.7 3.24 ± 0.48 6.03 ± 0.96 2.36 ± 0.54 11.62 ± 1.55 37.5 23.7 ± 3.0 3.50 ± 0.72 4.69 ± 1.44 1.66 ± 0.48 9.85 ± 1.81 28.1* 23.4 ± 3.1 3.51 ± 0.89 4.18 ± 1.75 1.71 ± 0.62 9.40 ± 2.14 22.9* 23.4 ± 3.1 3.51 ± 0.89 4.18 ± 1.75 1.71 ± 0.62 9.40 ± 2.14
Average Effluent Concentrations HRT
(min)
COD (mg/L)
NH4+ (mg/L-N)
NO2- (mg/L-N)
NO3 -(mg/L-N)
TIN (mg/L-N) 66.7 22.4 ± 5.5 0.17 ± 0.29 1.05 ± 0.71 2.40 ± 0.89 3.62 ± 1.18 50.0 30.5 ± 9.3 0.43 ± 0.43 1.42 ± 0.97 3.92 ± 0.68 5.78 ± 1.40 37.5 17.4 ± 3.3 0.20 ± 0.32 0.24 ± 0.21 2.87 ± 0.46 3.32 ± 0.59 28.1 17.4 ± 3.6 0.40 ± 0.41 0.33 ± 0.36 2.83 ± 0.39 3.55 ± 0.83 22.9 18.4 ± 4.3 0.54 ± 0.44 0.51 ± 0.54 2.80 ± 0.37 3.85 ± 0.99
Percent Removal/Production HRT
(min)
COD %R
NH4+ %R
NO2 -%R
NO3 -%P
TIN %R
66.7 11 ± 17 95 ± 7 83 ± 8 151 ± 109 64 ± 9
50.0 -8.3 ± 32 85 ± 14 74 ± 15 68 ± 22 49 ± 10
37.5 26 ± 13 94 ± 9 95 ± 4 80 ± 36 65 ± 9
28.1 24 ± 18 88 ± 12 93 ± 6 79 ± 51 61 ± 11
22.9 22 ± 11 84 ± 13 89 ± 9 76 ± 46 58 ± 12
Influent and Delta NOx-:NH4+ HRT
(min)
Influent
NO2-:NH4+ ΔNO2 -:ΔNH
4+ ΔNO3-:ΔNH4+
25 Figure 3-8. Phase 2 37.5-min HRT Port 4 and 5 Effluent N Species Concentrations
Effect of Backwashing
Backwashing occurred twice during Phase 2 on Days 134 and 179 (Figure 3-5). Filter
performance decreased after the backwashing on Day 134. Ammonium in the effluent increased
26 values, while effluent nitrate remained consistent. In combination with the backwash, influent
TIN increased by almost 6 mg/L-N due to dosing pump sensitivity, which could have
exacerbated the decrease in performance. TIN percent removal decreased from greater than 60%
to 55%. However, within three days of the backwash, the filter recovered to pre-backwash
performance. The ΔNO3-:ΔNH4+ mass ratio at the 66.7-min HRT increased after the Day 134
backwash, and remained at that approximate level throughout the 50-min HRT and the beginning
of the 37.5-min HRT. Filter performance again decreased after the backwash on Day 179. The
influent TIN had decreased from the previous days from correcting the dosing pump flow, so the
loss in performance can be attributed to solely the backwash. Ammonium briefly increased to
above 0.5 mg/L, while nitrite actually stayed at the same level. Nitrate production again
remained consistent after backwashing. TIN percent removal decreased from 63% to 48%, but as
before, recovered within three days. sCOD consumption after the first backwash increased on
average, but the opposite occurred after the second backwash (Figure 3-6). The backwash on
Day 134 seemed to promote a rise in the ΔNO3-:ΔNH4+ mass ratio, whereas no substantial
change occurred to the ratio after the backwash on Day 179.
Effect of NO2-:NH4+ Mass Ratio
The influent NO2-:NH4+ mass ratio was increased at the beginning of Phase 2 from the
original target of 1.5 to 2.0 to increase ammonium removal as the filter was nitrite limited during
Phase 1. An increase in ammonium removal and overall TIN removal was observed with the
higher influent ratio (Figure 3-5). The increase in influent ratio from Phase 1 caused the filter to
transition from nitrite limited to ammonium limited, producing excess nitrite in the effluent.
-27 :ΔNH4+ and ΔNO3-:ΔNH4+ mass ratios decreased due to the higher influent ratio. On Day 185,
the NO2-:NH4+ mass ratio was decreased to 1.6 to reduce the observed excess nitrite. The TIN
volumetric removal rate increased from 0.152 kg/m3-d to 0.245 kg/m3-d with the decreased
influent NH4+:NO2- mass ratio. Ammonium removal was maintained and complete removal of
nitrite was seen with the decrease in influent ratio. Nitrate was on average 88% of the effluent
TIN composition after the influent ratio decreased, compared to the previous 67% of the effluent
TIN. The trends in the ΔNO2-:ΔNH4+ and ΔNO3-:ΔNH4+ mass ratios toward the theoretical
stoichiometric ratios occurred after the influent NO2-:NH4+ mass ratio was decreased (Figure
3-7). The decrease in the ΔNO2-:ΔNH4+ mass ratio at the end of the 37.5-min HRT period was due
to an unintentional decrease in the influent NO2-:NH4+ mass ratio caused by dosing pump
sensitivity.
Phase 3
Phase 3 spanned 85 days and included three stress text experiments: imposing a diurnal
nitrate loading rate (NLR), injecting glycerin, and adding solids (TSS addition) with increased
backwash frequency.
Effect of a Diurnal Nitrogen Loading Rate
The diurnal NLR stress test was performed over a period of three days. The average TIN
influent volumetric loading rates for high peaking factor (PF), baseline PF, and low PF were
0.401 kg/m3-d, 0.259 kg/m3-d, and 0.174 kg/m3-d, respectively. There was an increase in the
average TIN removal from the start (approximately 40%) to the end (approximately 70%) of the
28 TIN removal, although the baseline PF performance was very similar. By the end of the
experiment the percent removal of the high peaking factor was similar to that of the lower
peaking factors. The TIN volumetric removal rates for the high PF, baseline PF, and low PF
were 0.190 kg/m3-d, 0.165 kg/m3-d, and 0.114 kg/m3-d, respectively. Over the course of the
NLR experiment nitrate became the primary nitrogen species in the effluent, even at the high
peaking factor. Due to an average lower influent nitrate during these periods, the baseline PF
showed the highest average nitrate production of all three peaking factors. The sample from
Hour 42 had sampling errors and is not displayed below. The calculated average anammox
ammonia and nitrite consumption during the Diurnal NLR experiment was 87% and 81%,
respectively.
29
Effect of Glycerin Injection
The glycerin injection experiment ran for 49 days of continuous filter operation. A
number of revisions to the experiment were made to optimize the glycerin dose and to test the
possibility of achieving partial denitrification. The average influent TIN and sCOD volumetric
loading rate for the first six days of glycerin injection were 0.392 kg-N/m3-d and 1.22
kg-COD/m3-d, respectively. The average sCOD/TIN was 3.33 for this period. There was no change
in performance observed over the eight days the glycerin was added at the stoichiometric ratio
for partial denitrification compared to previous results (Figure 3-11. Glycerin Injection
Experiment, Effluent N Species Concentrations, Figure 3-12). Average volumetric removal rates
for TIN and sCOD were 0.288 kg-N/m3-d and 0.067 kg-COD/m3-d, respectively. Over the first
six days, the calculated average anammox ammonia and nitrite consumption were 73% and 66%,
respectively. Approximate full and partial denitrification percentages of COD consumption were
calculated to be 29% and 13%, respectively, for these days.
For the next eight days, average influent TIN and sCOD volumetric loading rate were
0.362 kg-N/m3-d and 1.57 kg-COD/m3-d, respectively. The influent sCOD/TIN averaged 4.40.
When adding glycerin at an actual C:N of 5.9, nitrate was completely removed (below detection
limits). Decreasing the influent NO2-:NH4+ mass ratio to 1.2 in combination with the increased
glycerin dosage caused the filter to become nitrite limited, with excess ammonium in the effluent
(Figure 3-10, Figure 3-11). Average volumetric removal rates for TIN and sCOD were 0.333
kg-N/m3-d and 0.673 kg-COD/m3-d, respectively. The profile sample taken during these eight days
shows the majority of nitrate removal occurred within the upper portion of the column at an
equivalent 10-minute HRT. The calculated average anammox ammonia and nitrite consumption
30 denitrification percentage increased to 53% while the calculated partial denitrification percentage
decreased to 0%, with the increase in C:N.
Beginning on Day 16 the C:N dose was decreased and remained at 3.0 for the glycerin
addition experiment. Influent TIN and sCOD volumetric loading rate averaged 0.349 kg-N/m3-d
and 1.31 kg-COD/m3-d, respectively, over Days 16 to 30. The average influent sCOD/TIN for
this phase was 3.97. With the decrease in glycerin dose to an actual C:N of 3.0, the filter returned
to being ammonium limited. Even with complete ammonium removal, nitrate conversion was
observed regularly. Although the influent NO2-:NH4+ mass ratio between Days 16 and 31
averaged 1.13, the filter was ammonium limited, an opposite finding from low influent ratio
observations in Phase 2. Volumetric removal rates for TIN and sCOD averaged 0.288 kg-N/m3-d
and 0.587 kg-COD/m3-d, respectively. With a C:N of 3.0, the calculated average anammox
ammonia and nitrite consumption both decreased again to 33%. Approximate full and partial
denitrification percentages of COD consumption were calculated to be 58% and 4%,
respectively.
For Days 31 to 39, average influent TIN and sCOD volumetric loading rate were 0.124
kg-N/m3-d and 0.812 kg-COD/m3-d, respectively. The influent sCOD/TIN increased due to the
stoppage of nitrite addition, averaging 6.91. Complete removal of nitrate was observed after
stopping exogenous nitrite in the influent (Days 31-38), however this also coincided with a
reduction of influent nitrate levels by approximately 60% due to variability in the source water
(Figure 3-10, Figure 3-11). After stopping exogenous nitrite, the majority of the effluent TIN
was comprised of ammonium, with minimal removal observed (Figure 3-11). Average
volumetric removal rates for TIN and sCOD were 0.030 kg-N/m3-d and 0.183 kg-COD/m3-d,
3-31 13. Glycerin Injection Experiment Day 32, No Exogenous Nitrite Addition Profile Sample) did
show partial denitrification. The amount of nitrate removed (0.75 mg/L – N) in the profile is
comparable to the amount required to convert the amount of ammonium removed (0.59 mg/L –
N) via partial-denitrification plus anammox pathways. The ΔNO3-:ΔNH4+ mass ratio for this day
was 1.27, which is close to the stoichiometric ratio of 1.32 parts nitrite needed for converting one
part ammonium. The calculated average anammox ammonia increased to 86% while the nitrite
consumption decreased to 0% due to no nitrite being added. Approximate calculated full
denitrification increased to 96%, while the calculated partial denitrification stayed at 4%.
On Day 41 exogenous NO2- was added back into the influent. Average influent TIN and
sCOD volumetric loading rate were 0.348 kg-N/m3-d and 1.12 kg-COD/m3-d, respectively.
Within 24 hours, the effluent TIN reached below 2 mg/L-N and averaged 91% TIN removal.
Volumetric removal rates for TIN and sCOD averaged 0.314 kg-N/m3-d and 0.519 kg-COD/m3
-d, respectively. The calculated average anammox ammonia decreased to 68% while the nitrite
consumption increased to 64% after nitrite was added back into the influent. Approximate full
and partial denitrification percentages of COD consumption both decreased to be 66% and 0%,
respectively. The overall TIN percent removal during this sub-experiment was the highest seen
throughout the entire project. Compared to Phase 1 and Phase 2, the overall better TIN removal
was due to nitrate being removed instead of produced. The ammonium and nitrite removals were
only slightly higher during this test than those in Phase 2. The amount of glycerin being added
for a C:N of 3.0 corresponds to a cost of approximately $10.00 per million gallons treated.
Glycerin dosing in this experiment is almost three times less costly per million gallons treated
32 Figure 3-10. Glycerin Injection Experiment, Influent N Species Concentrations
33 Figure 3-12. Glycerin Injection Experiment, Influent and Effluent sCOD Concentrations
Figure 3-13. Glycerin Injection Experiment Day 32, No Exogenous Nitrite Addition Profile
34 Table 3-4. Summary of Phase 3 Glycerin Injection Experiment Results
Average Influent Concentrations
Days (mg/L) COD (mg/L-N) NH4+ (mg/L-N) NO2- (mg/L-N) NO3- (mg/L-N) TIN
1 – 61 31.8 ± 8.0 3.30 ± 1.02 5.34 ± 1.69 1.56 ± 0.17 10.2 ± 2.77 7 – 132 40.8 ± 0.3 3.76 ± 0.77 4.46 ± 0.69 1.19 ± 0.20 9.41 ± 1.35 14 – 303 34.1 ± 10.0 3.34 ± 1.88 3.92 ± 2.93 1.83 ± 0.44 9.09 ± 4.52 31 – 384 21.1 ± 1.4 2.47 ± 0.63 0.04 ± 0.02 0.73 ± 0.30 3.24 ± 0.86 39 – 485 29.1 ± 6.9 3.39 ± 0.89 4.52 ± 0.95 1.13 ± 0.47 9.04 ± 1.37
Average Effluent Concentrations
Days (mg/L) COD (mg/L-N) NH4+ (mg/L-N) NO2- (mg/L-N) NO3- (mg/L-N) TIN
1 – 6 30.0 ± 9.1 0.09 ± 0.12 0.71 ± 0.32 1.89 ± 0.48 2.69 ± 0.67 7 – 13 23.3 ± 2.0 0.34 ± 0.46 0.21 ± 0.23 0.20 ± 0.00* 0.75 ± 0.35 14 – 30 18.8 ± 3.6 0.14 ± 0.16 0.44 ± 0.28 1.03 ± 0.61 1.60 ± 0.89 31 – 38 16.4 ± 4.1 2.20 ± 0.59 0.02 ± 0.00* 0.24 ± 0.09 2.46 ± 0.58 39 – 48 15.6 ± 6.8 0.41 ± 0.65 0.14 ± 0.12 0.32 ± 0.14 0.87 ± 0.49
Percent Removal/Production
Days COD %R NH%R 4+ NO%R 2- NO%P 3- TIN %R
1 – 6 6 ± 7 97 ± 4 87 ± 4 -21 ± 26 72 ± 10
7 – 13 43 ± 5 92 ± 10 95 ± 5 83 ± 3 92 ± 3
14 – 30 43 ± 13 95 ± 8 85 ± 9 46 ± 31 79 ± 13
31 – 38 23 ± 16 11 ± 9 53 ± 27 65 ± 9 23 ± 9
39 – 48 48 ± 11 89 ± 15 96 ± 4 67 ± 25 91 ± 4
Influent and Delta NOx-:NH4+
Days Influent
NO2-:NH4+ ΔNO2 -:ΔNH
4+ ΔNO3-:ΔNH4+
1 – 6 1.62 ± 0.08 1.45 ± 0.14 0.14 ± 0.17 7 – 13 1.19 ± 0.06 1.24 ± 0.13 -0.29 ± 0.07 14 – 30 1.13 ± 0.34 1.03 ± 0.36 -0.31 ± 0.15 31 – 38 0.02 ± 0.01 0.11 ± 0.06 -4.99 ± 6.72 39 – 48 1.35 ± 0.22 1.51 ± 0.41 -0.31 ± 0.20
1 – Partial Denit. Stoichiometry, Influent NO2-:NH4+ of 1.6 3 – Actual C:N of 3.0, Influent NO2-:NH4+ of 1.2 5 – Actual C:N of 3.0, Influent NO
2-:NH4+ of 1.2
35
Effect of TSS Addition and Increased Backwashing
Between days 255 and 293, the influent filter TSS ranged from 6 mg/L to 17 mg/L. The
influent NO2-:NH4+ varied and routinely fell below 1.0 due to operational challenges with the
dosing pump (Figure 3-14). The average influent TIN and sCOD volumetric loading rates were
0.332 kg-N/m3-d and 1.22 kg-COD/m3-d, respectively. During this experiment, the filter reverted
back to being nitrite limited with an average effluent ammonium of 1.0 mg/L-N (Figure 3-15).
Until the increase in influent nitrate due to variation in the source water, the filter was averaging
below 2.0 mg/L-N in the effluent (78% avg. TIN removal). The average TIN volumetric removal
rate was 0.231 kg-N/m3-d. Overall, nitrate was being converted (17% removal), although at a
lower rate than seen in the glycerin injection experiment (61% removal). sCOD was always
consumed, averaging 49% removal and at rates similar to those in the glycerin injection
experiment (0.603 kg-COD/m3-d). Average TIN volumetric removal rate measured at 0.231
kg/m3-d. The average ΔNO
2-:ΔNH4+ (1.42) suggested anammox, while the ΔNO3-:ΔNH4+ (-0.12)
suggested denitrification. The calculated average anammox ammonia and nitrite consumption
during the TSS and backwashing experiment was relatively low, measuring 16% and 19%,
respectively. The calculated full denitrification percentage was 37%, while the partial
denitrification percentage was calculated to be 0%. Nitrite consistently reached below detection
limits and TIN approached the 2.0 mg/L-N by Port 4 (21.9-min HRT) (Figure 3-16). The Day 12
36 Figure 3-14. TSS Addition/Backwashing Experiment, Influent N Species Concentrations
37 Figure 3-16. TSS/Backwashing Experiment, Port 4 and Port 5 Effluent N Species
38 Table 3-5. Summary of Phase 3 TSS Addition and Increased Backwashing Experiment Results
Average Influent Concentrations Sample
Location (mg/L) COD NH4 +
(mg/L-N) NO2
-
(mg/L-N) NO3
-(mg/L-N) (mg/L-N) TIN Inf 31.7 ± 5.5 3.48 ± 0.67 3.41 ± 0.63 1.77 ± 1.33 8.65 ± 0.93
Average Effluent Concentrations Sample
Location (mg/L) COD NH 4+
(mg/L-N) NO
2-
(mg/L-N) NO
3
-(mg/L-N) (mg/L-N) TIN Eff 16.0 ± 5.2 1.04 ± 0.34 0.03 ± 0.04 1.58 ± 1.41 2.64 ± 1.19 P4 15.5 ± 3.7 1.31 ± 0.53 0.04 ± 0.05 1.73 ± 1.37 3.08 ± 1.24 P5 16.6 ± 3.5 1.32 ± 0.51 0.03 ± 0.04 1.57 ± 1.34 2.92 ± 1.27
Percent Removal Sample
Location COD %R NH4+ %R NO2- %R NO3- %R TIN %R
Eff 49 ± 14 70 ± 7 99 ± 1 17 ± 25 70 ± 12
P4 49 ± 9 63 ± 9 99 ± 2 8 ± 21 65 ± 12
P5 47 ± 10 62 ± 10 99 ± 1 15 ± 31 67 ± 13
Influent and Delta NOx-:NH4+ Sample
Location
Influent
NO2-:NH4+ ΔNO2 -:ΔNH
4+ ΔNO3-:ΔNH4+
Eff 0.99 ± 0.15 1.42 ± 0.27 -0.12 ± 0.17
P4 -- 1.61 ± 0.21 -0.07 ± 0.16
39 CHAPTER 4: DISCUSSION
Phase 1
Effect of Media Type
The influent volumetric loading rate was consistent with other mainstream
deammonification and anammox studies (Al-Omari et al., 2015; Han et al., 2016; Regmi et al.,
2016; Cao et al., 2017). Overall, the DMF produced higher quality effluent (i.e., lower effluent
TIN) than the CMF in Phase 1. Higher TIN removal in the DMF compared to that in the CMF
was likely due to a lower measured nitrate production in the DMF, likely due to the presence of
denitrifying biomass on the filter media used in the DMF. The lower ΔNO2-:ΔNH4+ and ΔNO3
-:ΔNH4+ mass ratios of the DMF are closer to the theoretical nitrite use and nitrate production
ratios, again indicating the benefits of using existing denitrifying filter media when retrofitting
for a deammonification filter. The ΔNO2-:ΔNH4+ and ΔNO3-:ΔNH4+ mass ratio for both filters
were typically higher compared to other mainstream anammox experiments. The removal ratios
observed here were higher than the stoichiometric ratio whereas the other reported removal ratios
were not (Ma et al., 2013; Regmi et al., 2016; Gu et al., 2018). The mass balance analysis
suggests that in CMF, the anammox pathway was the primary pathway for both ammonia and
nitrite removal. For the DMF, the pathway analysis suggests anammox was the primary removal
pathway for nitrite but not ammonia. The mass balance analysis shows the CMF has higher
anammox activity than the DMF during the initial phase, although the DMF was performing to a
higher degree in terms of overall TIN removal. The results from the pathway analysis in terms of
anammox consumption were expected as the CMF was only inoculated with the anammox
granules whereas the DMF already had other bacteria present. These results suggest that filter
40 can help control nitrate in the system. The presence of denitrifying bacteria on the media did not
appear to impact anammox bacteria performance.
Effect of HRT
The HRTs explored in this phase were similar to the HRTs in other mainstream
experiments (Cao et al., 2017). Decreasing the HRT resulted in both filters removing more TIN
as seen by the increases in volumetric removal rates. The TIN removal rates for both filters were
in a similar range to the start-up phase of the polishing MBBR run by Regmi et al. (2016). After
the drop in HRT, the calculated ΔNO2-:ΔNH4+and ΔNO3-:ΔNH4+ mass ratios of the filters were
equivalent, signifying the filters were performing to the same degree. The large drop in both
filters’ nitrate production that occurred after the decrease in HRT can most likely be attributed to
an increased efficiency in the anammox and possibly some growth of denitrifiers. The small
increase in sCOD percent removal in the CMF could be correlated to the additional nitrite
removal not completed by anammox. The sCOD production observed in the DMF after
decreasing to a 66.7-min HRT is likely due to the decay of biomass already present on the media
in the DMF.
Phase 2
Effect of HRT
The influent volumetric loading rates for the 50-min and 37.5 min-HRTs were in the
range of other reported values (Al-Omari et al., 2015; Han et al., 2016; Regmi et al., 2016; Cao
et al., 2017). The HRTs (50-min and 37.5-min) at which the CMF operated during Phase 2 were
41 shorter HRTs reported were small-scale experiments (Ma et al., 2013; Guillén et al., 2015; Cao
et al., 2017). The filter performance decreased on average when the HRT was changed from 66.7
minutes to 50 minutes, whereas filter performance increased when the HRT was decreased again
to 37.5 minutes. The average volumetric TIN removal rates observed during this phase were also
in the range of other reported values (Hendrickx et al., 2012; Wett et al., 2013; Lotti et al., 2014;
Cao et al., 2017). There was much less time required to reach an equilibrium after decreasing to
37.5 minutes than when decreasing to 50 minutes. This may suggest the microbial community
within the filter had grown more robust and capable of managing higher loading. A more robust
microbial community also possibly helps explain no loss in performance when decreasing HRT
to 37.5 minutes. The ΔNO2-:ΔNH4+ mass ratio trended at similar values for the 66.7-min and
50-min HRTs. There was a small decrease in the delta ratios on average from a 50-50-min HRT to a
37.5-min HRT possibly suggesting anammox was performing more efficiently at the lower HRT.
The ΔNO3-:ΔNH4+ mass ratio did not change considerably after transitioning to 50 minutes from
when the ratio increased after backwashing. Even with the observed decrease in the ΔNO2
-:ΔNH4+ and ΔNO3-:ΔNH4+ mass ratios, the values reported here were still slightly higher than
both the stoichiometric ratios and the ratios reported in literature (Ma et al., 2013; Regmi et al.,
2016; Gu et al., 2018). When ignoring influent nitrate, and only considering the nitrate produced
there, were multiple days where both Ports 4 and 5 reached below an effluent TIN of 2.0
mg/L-N. The pathway analysis model calculated average anammox ammonia consumptions for the
three HRTs in a similar range (77% - 84%), suggesting the anammox bacteria were not impacted
by the decreases in HRT and was able to maintain consistent ammonia removal. The mass
balance analysis showed nitrite consumption by anammox increasing with the decrease in HRT,
42 to Phase 1, the mass balance analysis a meaningful increase in both the ammonia and nitrite
consumption via anammox for the CMF signifying a strengthening community.
Effect of Backwashing
The preliminary assessment of backwashing showed the filter was able to recover quickly
in terms of ammonium and nitrite removals, with ammonium and nitrite percent removals
recovering within three days of the backwash event. Nitrate production on the day after
backwashing reached some of the highest percentages seen over the two HRT periods in which a
backwash occurred. Consumption of sCOD was also the lowest after backwashing at both HRTs
the day after backwashing. The combination of high nitrate production and low sCOD
consumption could suggest anammox was not washed out during the backwashing, but
denitrifying bacteria were. If true, it is a preliminary but positive sign that anammox can
withstand a full backwash.
Effect of NO2-:NH4+ Mass Ratio
Increasing the influent NO2-:NH4+ mass ratio from the original target of 1.5 to 2.0 was
successful in promoting increased (~ 30%) ammonium removal. However, an increase in the
influent ratio caused nitrite removal to decrease. Nitrate production increased with this change as
well, most likely due to increased ammonium removal via anammox. Decreasing the influent
NO2-:NH4+ mass ratio to 1.6 from 2.0 was successful in stimulating removal of the excess nitrite.
The decrease in the influent NO2-:NH4+ mass ratio increased nitrite removal from 78% to 95%,
while ammonium removal remained typically greater than 90%. The shift to an influent ratio of
43 increased nitrite removal suggest anammox to be the main pathway converting ammonium and
nitrite. This conclusion is further substantiated by the ΔNO2-:ΔNH4+ mass ratio trending toward
the theoretical molar ratio of 1.32. Overall, it was evident ammonium removal was heavily
dependent on having an influent feed NO2-:NH4+ mass ratio greater than one. When the ratio was
below one due to dosing pump issues, the ammonium removal dropped to between 17% and
28%. For optimum filter performance, the influent NO2-:NH4+ range needed to be between 1.1
and 1.7, similar to other observed ratio values (Ma et al., 2013; Gu et al., 2018). Within this
range, ammonium and nitrite percent removals averaged 96% and 95%, respectively If the ratio
is too low, the ammonium will not be removed; however, too high of a ratio will result in excess
nitrite in the effluent.
Phase 3
Effect of a Diurnal Nitrogen Loading Rate
Diurnal nitrogen loading rate testing took place over a three-day period. The poor
removal rates were expected during the first exposure to the high peaking factor. However, after
three periods of seeing the high peaking factor, the filter reached approximately the same overall
TIN percent removal as the lower peaking factors. This shows the filter is able to adjust to the
influent and perform under varying loading rates. Although the filter reached a similar TIN
percent removal as the lower peaking factors, the filter was not able to meet a 2.0 mg/L-N TIN
goal at the high peaking factor. Nitrate production was the limiting factor for total N removal
performance. Effluent nitrate typically made up a majority of the effluent TIN throughout the
experiment. There was typically more nitrate produced than what could be explained by
44 aerobically converted. The unaccounted-for nitrate production suggests not all ammonium is
being consumed by anammox.
Removing the background nitrate, the overall average effluent TIN was 2.8 mg/L-N. An
interesting finding was the sCOD consumption decreased at the higher peaking factor. This
reduction could signify the anammox process was outcompeting other processes at the high
peaking factor due to the increased ammonia and nitrite. The pathway analysis suggested an
increased ammonia and nitrite consumption via anammox compared to the calculated Phase 2
results. The mass balance values show the anammox can be maintained as the primary ammonia
and nitrite removal with diurnal loading. Overall, these results suggest that an anammox filter
can perform well under fluctuating nitrogen loading.
Effect of Glycerin Injection
The addition of glycerin as an external carbon source was successful in controlling nitrate
in the system and reducing TIN to below the 2.0 mg/L-N target. The influent sCOD/TIN
observed throughout this experiment were similar to other reported values (Wett et al., 2013;
Regmi et al., 2014; Al-Omari et al., 2015; Han et al., 2016; Cao et al., 2017). In the first eight
days of glycerin addition, minimal nitrate removal was observed. This is attributed to
insufficient glycerin added, based initially only on partial denitrification stoichiometry without
consideration of heterotrophic yield or DO. Increasing the glycerin dose to the actual C:N of 5.9
showed complete denitrification occurring throughout the filter. The profile sample during this
period did not suggest partial denitrification was occurring as there was no measurable nitrite
being produced. Moreover, the nitrite removal followed a similar trend as ammonium removal