Texture Analysis of Segmented MRI Images
using GLCM
Iqra Rizvi1, Narayanan Kallingal2
M.E. Student, Department of Electronics Engineering, Fr. Conceicao Rodrigues College of Engineering, Mumbai,
Maharashtra, India
Associate Professor, Dept. of Electronics Engineering, Fr. Conceicao Rodrigues College of Engineering, Mumbai,
Maharashtra, India
ABSTRACT: This paper presents texture analysis MRI images after segmentation using GLCM algorithm. The segmentation of images is done by a hybrid technique. The hybrid technique used is amalgamation of a traditional segmentation technique, Canny segmentation and Fuzzy logic technique alone with Graph cut segmentation to help in
classifying the type of lesion of hemorrhage present. GLCM consists of 2nd-order statistical information of
neighbouring pixels of an image.
KEYWORDS: Brain Image Segmentation, Fuzzy Logic, Canny Edge Segmentation, Graph Cut Segmentation, GLCM.
I. INTRODUCTION
A regular reoccurring element or sequence on a surface of an image is known as texture. Pixels values are repeated after short intervals in a texture. Primarily, texture indicates surface attributes and appearance of an object or an image given by the size, shape, density, arrangement, proportion of its rudimentary parts. Initially features are collected using texture analysis procedure is called as texture feature extraction. Due to near perfection of texture information, texture feature extraction is utmost essential function in many image processing applications. Gray-Level Co-occurrence Matrix (GLCM) is one of the fundamental methods used for texture feature extraction was suggested by Haralick et al. in 1973 which has been used in many texture analysis based projects. GLCM examine image properties related to 2nd-order statistics which deal with the relationship among pixels or groups of pixels (usually two). Texture features being a spatial property, a simple 1-D histogram may not be convenient to characterize it. Hence, this 2-D GLCM matrix is broadly used in texture analysis and will be discussed in short here.
In this paper, MRI images are segmented using hybrid techniques and GLCM algorithm is run at each step determining the texture features of traditionally segmented image as well as hybrid segmented images.
II. METHODOLOGY
A. Gray Level Co-occurance Matrix
GLCM is an acknowledged statistical algorithm for acquiring second order texture information from images. A matrix having number of rows and columns having distinct gray pixel values of an image is considered as GLCM. GLCM matrix describes number of one type of gray levels present in a given spatial is in linear relationship with another gray level in the area being considered. GLCM is presented in the form of a table having values of different combinations of gray levels occurring in that particular image or section[1].
GLCM matrix, the neighboring pixels in different directions are used for example, in this paper , the four spatial
directions used are 0˚ ; 45˚ ; 90˚ and 135˚ . Matrix has information about the location of the pixels having related gray
level values. Each element is GLCM is denoted as (i,j) and show how many times a pixel with value i have appeared horizontally adjacent to a pixel with value j. From the figure 1 shown , the element (1,1) has the value 1 as only one time in the image , pixel with values 1 and 1 appear horizontally adjacent. From the figure shown , the element (1,2) has the value 2 as two times in the image , pixel with values 1 and 2 appear horizontally adjacent. After GLCM is computed, texture features of the image are calculated successively [2].
Fig 1 Creation of GLCM from image matrix
B. Image Segmentation Techniques
Image segmentation is the process of segregating a digital image into multiple segments. The objective of segmentation is to decipher and/or change the image into something that is more suitable and easy to interpret. Image segmentation is used to detect objects and edges in images. Image Features are the basis for most of the real time image processing applications. Edge is one of the prime features of image. It helps us to analyze, infer and take decision in various image processing applications [3].
In this paper, segmentation is performed using hybrid fuzzy logic combined with canny edge detector and graph cut segmentation which helps to segment the lesion or haemorrhage by detecting the edges more efficiently than the traditional edge segmentation techniques such as Sobel Operator, Roberts Operator, Prewit Operator and Laplacian Operator etc [4][5].
i. Fuzzy Logic
When an image is transformed to other forms using processes such as digitizing the image, scanning it, transmitting to other machines, storing in other machines, etc., some type of degradation occurs at the other side or the output. Therefore, the output image is enhanced using some image enhancement techniques. Fuzzy Logic is the process which deals with a set of methods that interpret, and process those images, then segments it and use those segmented features as fuzzy sets. Fuzzy Logic processing steps are selected based on the output which is desired. The concept behind selecting fuzzy sets is very simple. For example, a set of gray pixels are defined which are having the property dark. In traditional set theory, a threshold of gray level 100 is decided. Gray levels ranging from 0 to 100 belong to this set; other gray levels are do not belong to this set. But the darkness is a matter of degree. Fuzzy set gives a better result in forming these properties. Human communication is the logic behind fuzzy logic algorithm. This view explains many of the other descriptions about fuzzy logic. Because the format of fuzzy logic is based on the linguistic description of events used in day to day life, it is most appropriate to use to acquire the desired results. A filtering system needs to be efficient of reasoning with incomprehensible and unclear information; this put forwards the use of fuzzy logic [6]
There are 3 main stages of Fuzzy Logic based Image processing namely : image fuzzification, modification of membership values, and , image defuzzification.
Fig 2 Fuzzy Logic System
Fuzzification and defuzzification of the image pixels is done using Matlab application. Fuzzification amounts to coding on image data and defuzzification is decoding of image data. The fuzzy sets are modified in the middle step also know as modification of membership values where particular rules are applied to the images to get the desired result after defuzzification. This whole process is known as Fuzzy inference system (FIS), see fig 3. There are different types of fuzzy logic process such as, fuzzy rule based approach, fuzzy integration, fuzzy clustering, fuzzy c means, etc.,
Fuzzy Rule-Based Approach
Fig 3 Fuzzification & Defuzzification
If we elucidate the image features as linguistic variables, then we can use fuzzy if – then rules to segment the image into different regions. A simple fuzzy segmentation rule may seem as follows:
IF the pixel is white
AND It’s neighbourhood is also white AND homogeneous
ii. Canny Edge Segmentation
Canny Operator: Canny edge segmentation is removes speckle noise by determining thresholds to create a single pixel thick edge thereby reducing noise and weight of the image.
The algorithm for canny edge operator is given as follows:
i) We can obtain the smooth image k^(s, t), by convolving the image k (s, t) with a Gaussian function.
( , )= ( , )∗ ( , , ) (2)
ii) To obtain edge strength apply first difference gradient operator, then edge magnitude and direction are
obtained.
iii) Apply gradient magnitude with the non-maximal and suppression.
iv) Then on the output suppression image apply the threshold of the non-maximal [5].
iii. Graph Cut Segmentation
Graph cut segmentation has been extensively used because of its dexterity to segment any given image globally with promising results. Graph cut segmentation is divided in two parts: Data term and Smoothness term.[7].
When biologists are keen in analyzing a specific section of a cell image, a selective segmentation is necessary. Selective segmentation is convenient to examine a group of cells in isolation when other parts of the image are clocked up by noise or debris. The areas of an images having important information at a given time are determined using selective segmentation which interests biologists.
For example, biologists can observe the cells which are infected by tuberculosis and also the relation of tuberculosis with other cells present in the vicinity and then can segment those cells to monitor the degree of infection. Data such as shape, texture, size, depth, etc., can be gathered automatically for better diagnosis.. In addition, this approach can also be convenient to figure out whether a cell under examination has improved or ricketed over time under the effect of an array of potential drugs, to cure, for example, cancer [8].
The concept is as follows: the user identify some pixels as being part of the object of interest, and some as existing outside the object i.e. in the background. The number of such points is up to the user, but normally can be quite small (less than ten). Given these limitations, the algorithm tries to find the best segmentation such that these hard limitations are satisfied. In particular, segmentation is accomplished according to the following principle: 1. If a pair of adjoining pixels is considered, where one is inside the object and other pixel is outside the object, then the value is assigned if the both the pixels have similar intensities; low values correlate to contrasting intensities (i.e. to an edge).[8]
R = −log P(I |′ bck′)
−log P(I |′ fg′) (5)
Above equation is based on sample foreground pixels ‘fg’ and sample background pixels ‘bck’. The required output data can be obtained by marking portions of the foreground and background in the image , which have to be segmented.
B , = exp −
|I −I |
2σ .
1
e(a. b) (6)
E =λ R
∈ + , ∈ B , (7)
I and I are intensity values of neighboring pixels, and σ gives the degree of concern for pixel similarity. These two
terms (the data term and the smoothness term) are fitted into the graph cut energy function in Equation (7) Manages the relativity of the data term to smoothness term and this relativity term is defined by the Euclidean distance between pixels a and b. Minimizing Equation (7) results in an image seperation into foreground and background. Where P is the
total number of pixels in a given image and the set of neighboring pixels is N [7].
III.PROPOSED ALGORITHM
A. Image Acquisition
These images are acquired from MRI image database available online
Epidural Hemotoma
Subdural hematoma
Subarachnoid hematoma
Img 1
Img 2
Fig 4 Input Images
B. Pre-Processing
Preprocessing involves image resizing, conversion to gray level, filtering etc. The input image is converted to a gray level image because it is difficult to detect lesion using color images. Gaussian Filter is used for preprocessing an image
Epidural Hemotoma
Subdural hematoma
Subarachnoid hematoma
Img 1
Img 2
Fig 5 Gaussian Filtering
C. Image Segmentation
the traditional edge detection techniques such as Sobel Operator (Sobel, 1970), Roberts Operator (L. G. Roberts, 1965), Prewit Operator (Prewit, 1970) and Laplacian Operator etc.
1) Sobel Edge Segmentation
is the differential of two rows or two columns, so the elements of the edge on both sides has been enhanced, so that the edge seems thick and bright.
Epidural Hemotoma
Subdural hematoma
Subarachnoid hematoma
Img 1
Img 2
Fig 6 Sobel Edge Segmentation
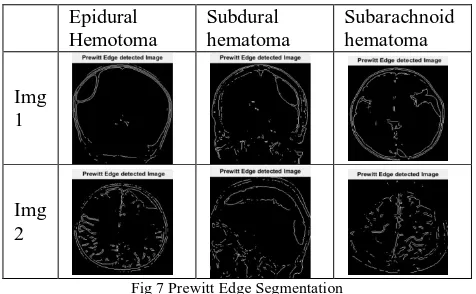
2) Prewitt Edge Segmentation
In this technique, the edges are detected by convolving horizontal and vertical masks Gx and Gy respectively, through the image. The masks are orthogonal to each other and use to measure the difference among the adjacent pixels gray level in horizontal and vertical direction
Epidural Hemotoma
Subdural hematoma
Subarachnoid hematoma
Img 1
Img 2
Fig 7 Prewitt Edge Segmentation
3) Canny Edge Segmentation
Epidural Hemotoma
Subdural hematoma
Subarachnoid hematoma
Img 1
Img 2
Fig 8 Canny Edge Segmentation
4) Fuzzy Logic Edge Segmentation
Fuzzy image processing is the collection of all approaches that understand, represent and process the images, their segments and features as fuzzy sets.
Epidural Hemotoma
Subdural hematoma
Subarachnoid hematoma
Img 1
Img 2
Fig 9 Fuzzy Edge Segmentation
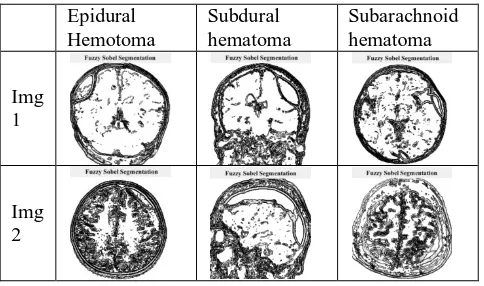
5) Fuzzy Sobel Edge Segmentation
Hybrid of Fuzzy Logic and Sobel edge segmentation gives the following output.
Epidural Hemotoma
Subdural hematoma
Subarachnoid hematoma
Img 1
Img 2
6) Fuzzy Canny Edge Segmentation
Hybrid of Fuzzy Logic and Canny edge segmentation gives the following output.
Epidural Hemotoma
Subdural hematoma
Subarachnoid hematoma
Img 1
Img 2
Fig 11 Fuzzy Canny Segmentation
7) Graph Cut Segmentation
The advantage of the global segmentation strategy of graph cut can also be a setback, as regions which are of no interest, having similar pixels to objects of interest, are captured during segmentation.
Epidural Hemotoma
Subdural hematoma
Subarachnoid hematoma
Img 1
Img 2
D. Performance Analysis of the Processed MR Images 1) GLCM Texture Features
a) Epidural Hematoma
GLCM Texture Features
Input Fuzzy Fuzzy Sobel Fuzzy Canny
Img 1 Img 2 Img 1 Img 2 Img 1 Img 2 Img 1 Img 2
Energy 0.21632 0.27716 0.79415 0.60786 0.50633 0.26997 0.82345 0.67239
Contrast 0.18419 0.26373 0.19358 0.33113 1.4863 2.0587 0.069301 0.12956
Entropy 6.5704 5.6857 2.0557 3.4239 2.0261 3.1563 0.32483 0.53485
Correlation 0.96553 0.93408 0.73801 0.69621 0.66014 0.65515 0.38151 0.3969
Homogeneity 0.92943 0.90104 0.95551 0.9151 0.87206 0.79643 0.96535 0.93522
Table 1 EDH GLCM Features Values
b) Subdural Hematoma
GLCM Texture Features
Input Fuzzy Fuzzy Sobel Fuzzy Canny
Img 1 Img 2 Img 1 Img 2 Img 1 Img 2 Img 1 Img 2
Energy 0.16603 0.1836 0.74636 0.77563 0.3577 0.29056 0.73228 0.72862
Contrast 0.24482 0.16916 0.22998 0.10519 2.0431 2.0687 0.11039 0.10815
Entropy 6.621 6.7102 2.5618 2.7924 2.612 3.2867 0.44686 0.45769
Correlation 0.93123 0.97268 0.68575 0.72647 0.63896 0.61799 0.34885 0.38176
Homogeneity 0.90111 0.91936 0.94153 0.96075 0.82036 0.79011 0.94481 0.94593
Table 2 SDH GLCM Feature Values
c) Subarachnoid Hematoma
GLCM Texture Features
Input Fuzzy Fuzzy Sobel Fuzzy Canny
Img 1 Img 2 Img 1 Img 2 Img 1 Img 2 Img 1 Img 2
Energy 0.28596 0.16605 0.77862 0.87354 0.47017 0.27421 0.78261 0.78659
Contrast 0.1474 0.14919 0.14733 0.061581 1.4742 2.2548 0.085233 0.083701
Entropy 6.3303 6.8474 2.1139 2.6464 2.0673 3.5809 0.38469 0.37891
Correlation 0.958 0.96531 0.69369 0.59037 0.70197 0.56453 0.38869 0.38777
Homogeneity 0.93616 0.92704 0.95346 0.97705 0.86925 0.77468 0.95738 0.95815
E. GLCM Graphs 1) Energy
It measures the textural uniformity that is pixel pair repetitions. Fuzzy canny segmentation is giving uniform energy throughout the output image.
2) Contrast
The local contrast of an image is denoted by this feature. The Contrast is low if the gray levels of the pixels are similar.
3) Entropy
Entropy functions as a degree of 'disorder'. As the disorder rises, the entropy rises and events become less
4) Correlation
Correlation that brings out how correlated a reference pixel to its neighbour over an image
5) Homogeneity
IV.CONCLUSION
Based on GLCM graph we can conclude that the proposed model of hybris fuzzy canny segmentation along with graph cut segmentation gives better result in terms of texture features on comparing with output images of fuzzy segmentation and fuzzy sobel segmentation.
REFERENCES
[1] Haralick, Robert M., and Karthikeyan Shanmugam. "Textural features for image classification." IEEE Transactions on systems, man, and cybernetics 6 (1973): 610-621.
[2] G. Preethi and V. Sornagopal, "MRI image classification using GLCM texture features," 2014 International Conference on Green Computing Communication and Electrical Engineering (ICGCCEE), Coimbatore, 2014, pp.
[3] S. E.Mary shyla, Medical Image Segmentation using Enhanced Neuro Fuzzy Classification Algorithm based on Multi-Modal Function of PSO, 12th ed. Coimbatore: IJARCET, 2014, pp. 4402-4407
[4] Mahmudi, A., & Poor, I. (2015). A Hybrid Method for Edge Detection Using Fuzzy Rules and Coordinate Logic Operators. International Journal of Computer Science and Mobile Computing, 4(9), 310-317. Retrieved from www.ijcsmc.com.
[5] A., Kong, Y., & Hossain, M. S. (2015). Performance Analysis of Integrated Canny and Fuzzy Logic Based (3-by-3 Cell Block) Edge Detection Algorithms. 2015 IEEE International Conference on Data Science and Data Intensive Systems. doi:10.1109/dsdis.2015.14
[6] Cox, E.,(2005): “ Fuzzy Modeling and Genetic Algorithms for Data mining and Exploration,” Elsevier, 2005.