Hollylynne Stohl Lee.)
The purpose of this study was to investigate the nature of preservice mathematics teachers’ understanding of inequalities. The design of the study was a multi-case study of
secondary mathematics education preservice teachers with a focus on their understanding and the lessons that they plan and implement. Data from individual interviews, observations, and documents were collected and analyzed. Five preservice mathematics teachers from a major university in the Southeast United States participated in this study. These preservice teachers were examined during their student teaching field experience semester.
Preservice teachers displayed a robust procedural understanding, which involved an ability to apply the procedures necessary for solving inequalities, during pre-student teaching interviews (Rittle-Johnson & Alibali, 1999). At times, their understanding extended beyond an operational view of inequalities and allowed them to consider the relational nature of inequalities (Knuth et al., 2006). This was especially true while discussing the meaning of a solution of an inequality. Preservice teachers displayed some of the same conceptions noted within prior literature (e.g., treating inequalities as equations, believing that solutions of inequalities must be inequalities). There did not appear to be a relationship between a preservice teacher displaying one conception and any other conception.
Preservice teachers’ understanding of inequalities played a role in their planning and
and concepts with linear and quadratic equations. Solution strategies were presented in an operational manner which tended to treat boundary lines or curves as an isolated component. This isolation often carried over to descriptions of solutions of inequalities. Preservice teachers described solutions of inequalities as regions and did not mention the inclusion or exclusion of boundary lines or curves. Overall, preservice teachers seemed to view and treat inequalities as something to do rather than something to be interpreted.
Implications of this study indicate a need to consider changes in methods courses. Deficiencies in preservice teachers’ understanding of inequalities need to be addressed within
methods courses. Preservice teachers should have opportunities to examine pedagogical decisions that foster a relational view of inequalities (and equations). Additionally, methods courses should help develop preservice teachers’ awareness of how technology can be
by
Harry Tyrone Washington Jr.
A dissertation submitted to the Graduate Faculty of North Carolina State University
in partial fulfillment of the requirements for the degree of
Doctor of Philosophy
Mathematics Education
Raleigh, North Carolina 2012
APPROVED BY:
_______________________________ ______________________________ Hollylynne Lee, Ph.D. Karen Hollebrands, Ph.D.
Committee Chair
BIOGRAPHY
TABLE OF CONTENTS
LIST OF TABLES ... xiii
LIST OF FIGURES ...xv
CHAPTER 1: INTRODUCTION ...1
Background of the Study ...1
Definition of Terms...4
Significance and Focus of the Study ...5
Overview of Approach ...6
Chapter Summary ...7
Organization of the Study ...7
CHAPTER 2: LITERATURE REVIEW ...9
Introduction ...9
Knowledge in Algebra ...9
Conceptions surrounding the use of variable ...10
Difficulties with the equal sign and defining an equation ...13
Knowledge of Inequalities ...14
Strategies for Solving Inequalities ...15
Algebraic manipulation for solving inequalities ...15
Drawing a graph ...17
Using a case approach for solving inequalities. ...19
Difficulties Encountered With Inequalities ...21
Difficulties relating inequalities to equations. ...22
Solving equations instead of inequalities. ...22
Multiplying or dividing by factors that are not necessarily positive. ...23
Difficulties with solutions. ...24
Single number answer tendency ...26
Forming meaningless connections with quadratic roots. ...27
Excluded values ...27
Difficulties with logical connectives. ...27
Difficulties with the sign of the factors of products and/or quotients. ...29
Difficulties related to the denominators of rational inequalities. ...29
Difficulties in interpreting the meaning of the inequality symbol. ...30
Preservice Teachers Understanding of Inequalities ...31
Content Knowledge for Teaching Mathematics ...33
Lee Shulman and His Colleagues ...34
Deborah Ball and Her Colleagues...39
Joan Ferrini-Mundy and Her Colleagues ...44
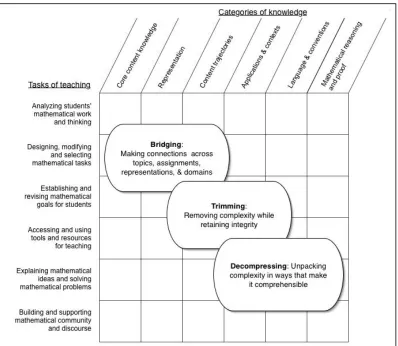
Categories of knowledge. ...47
Overarching categories. ...49
Bridging. ...49
Decompressing. ...50
Trimming. ...51
Conclusion ...54
CHAPTER 3: CONCEPTUAL FRAMEWORK AND METHODOLOGY ...55
Introduction ...55
Overall Research Design...55
Conceptual Framework ...56
Pilot Studies ...65
Lesson Plan ...65
Task-based Pre-Student Teaching Interview ...68
Defining the Case for the Current Study...70
Participant Selection ...71
Christina ...74
Crystal ...74
Heather ...75
Vanessa ...76
Data Collection ...77
Pre-Student Teaching Interviews ...81
Lesson Plans...86
Classroom Observations ...87
Post-Student Teaching Interview ...89
Data Analysis ...94
Phase One...95
Phase Two ...97
Research Validity and Reliability ...105
Subjectivity Statement ...105
Ethical Issues ...107
Chapter Summary ...108
CHAPTER 4: UNDERSTANDING REGARDING INEQUALITIES ...109
Aspects of Knowledge Associated with Inequalities ...109
Angela ...112
Considering inequalities as equations ...113
Attending to negative values ...113
Inequalities must have inequalities as solutions ...115
Quadratic Inequalities ...118
Absolute value inequalities ...124
Systems of inequalities ...126
Explaining why the sense of an inequality changes ...129
Christina ...131
Considering inequalities as equations ...132
Attending to negative values ...133
Inequalities must have inequalities as solutions ...135
Quadratic Inequalities ...138
Absolute value inequalities ...144
Systems of inequalities ...146
Explaining why the sense of an inequality changes ...149
Characterizing Christina’s understanding ...150
Crystal ...151
Considering inequalities as equations ...151
Attending to negative values ...153
Inequalities must have inequalities as solutions ...155
Quadratic Inequalities ...157
Absolute value inequalities ...162
Systems of inequalities ...164
Explaining why the sense of an inequality changes ...166
Characterizing Crystal’s understanding ...167
Heather ...168
Considering inequalities as equations ...168
Attending to negative values ...169
Inequalities must have inequalities as solutions ...172
Quadratic Inequalities ...176
Absolute value inequalities ...180
Systems of inequalities ...182
Explaining why the sense of an inequality changes ...185
Characterizing Heather’s understanding ...186
Vanessa ...187
Considering inequalities as equations ...187
Attending to negative values ...188
Quadratic Inequalities ...194
Absolute value inequalities ...199
Systems of inequalities ...201
Explaining why the sense of an inequality changes ...203
Characterizing Vanessa’s understanding ...204
Cross Case Analysis ...204
Strategies for solving inequalities ...204
Systems of linear inequalities. ...205
Quadratic inequalities ...205
Relating inequalities to equations ...206
Systems of linear inequalities ...206
Quadratic inequalities ...207
Shading as a process ...207
Systems of linear inequalities ...207
Quadratic inequalities ...207
Solutions of inequalities ...208
Systems of linear inequalities ...208
Quadratic inequalities ...208
Possible connections among aspects ...209
Chapter Summary ...211
CHAPTER 5: TEACHING SYSTEMS OF LINEAR INEQUALITIES ...213
Descriptions of Classrooms ...214
Lessons Taught Prior to and After Systems of Linear Inequalities ...216
Areas of Consideration Prior to the Analysis ...217
Analysis of Teaching Aspects of Knowledge Associated with Inequalities...218
Introduction of the aspects ...218
Strategies to solve inequalities ...219
Explaining a mathematical idea ...220
Solving a mathematical problem ...226
View of inequalities ...229
Using technology ...229
View of inequalities ...234
Treating inequalities as equations ...234
Explaining a mathematical idea ...235
View of inequalities ...236
Solving a mathematical problem ...237
View of inequalities ...239
Using technology ...240
View of inequalities ...241
The process of shading linear inequalities ...242
Explaining a mathematical idea ...242
View of inequalities ...248
Solving a mathematical problem ...249
View of inequalities ...254
Using technology ...256
Preservice teachers implemented similar procedures when graphing and shading linear inequalities using graphing calculators. ...258
View of inequalities ...258
Solutions to systems of linear inequalities ...258
Explaining a mathematical idea ...259
View of inequalities ...261
Solving a mathematical problem ...261
View of inequalities ...266
Using technology ...266
Characterizing How Preservice Teachers Approach Systems of Linear Inequalities ...268
Chapter Summary ...270
CHAPTER 6: QUADRATIC INEQUALITIES ...271
Descriptions of the Classrooms ...272
Areas of Consideration Prior to Analysis ...273
Analysis of Teaching Aspects of Knowledge Associated with Inequalities...275
Introduction of the aspects ...275
Strategies to solve inequalities ...276
Explaining a mathematical idea ...278
View of inequalities ...289
Solving a mathematical problem ...290
View of inequalities ...297
Using technology ...298
View of inequalities ...303
Treating inequalities as equations ...304
Explaining a mathematical idea ...304
View of inequalities ...305
Solving a mathematical problem ...305
View of inequalities ...311
Using technology ...311
View of inequalities ...313
The process of shading quadratic inequalities ...313
Explaining a mathematical idea ...313
View of inequalities ...316
Solving a mathematical problem ...317
View of inequalities ...319
Using technology ...319
View of inequalities ...320
Solutions to quadratic inequalities ...321
View of inequalities ...323
Solving a mathematical problem ...323
View of inequalities ...325
Using technology ...326
View of inequalities ...326
Characterizing How Preservice Teachers Approach Quadratic Inequalities ...326
Chapter Summary ...329
CHAPTER 7: DISCUSSION ...330
Introduction ...330
Summary of Research Questions and Findings ...332
Research Question 1 ...332
Summary. ...335
Research Question 2 ...336
Influence of cooperating teacher. ...337
Explaining mathematical ideas. ...337
Solving mathematical problems. ...341
Using technology. ...344
Summary. ...346
Limitations ...347
Implications...349
Suggestions for Future Research ...352
Final Thoughts ...355
REFERENCES ...357
APPENDICES ...381
Appendix A. Informed Consent Form. ...382
Appendix B. Permission to participate in video recording. ...385
Appendix C. Pre-student Teaching Interview Protocol. ...387
LIST OF TABLES
Table 1. Relationship between conceptions of algebra and use of variables ... 11
Table 2. Conceptual framework for this study... 60
Table 3. Conceptual framework, from a pilot study, that was used to analyze a lesson plan. 66 Table 4. Angela's classroom observation dates and topics covered... 78
Table 5. Christina's classroom observation dates and topics covered. ... 78
Table 6. Crystal's classroom observation dates and topics covered... 79
Table 7. Heather's classroom observation dates and topics covered. ... 79
Table 8. Vanessa's classroom observation dates and topics covered. ... 80
Table 9. Timeline outlining data collection specifically relevant to inequalities. ... 80
Table 10. Data sources used to address each research question. ... 81
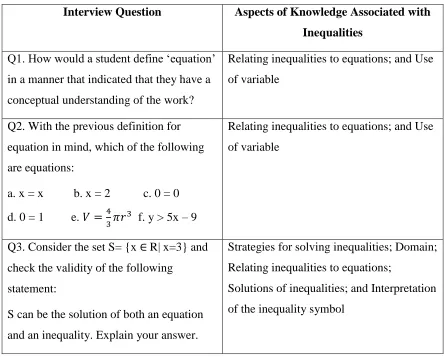
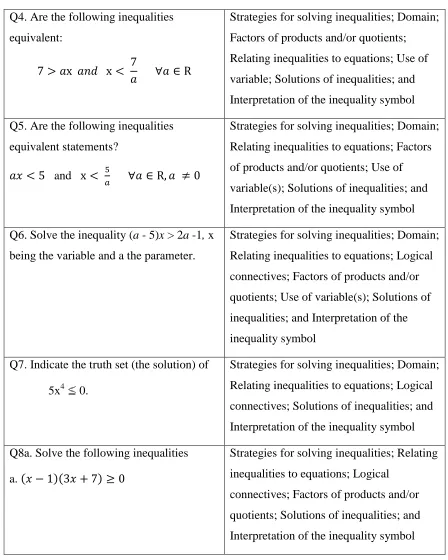
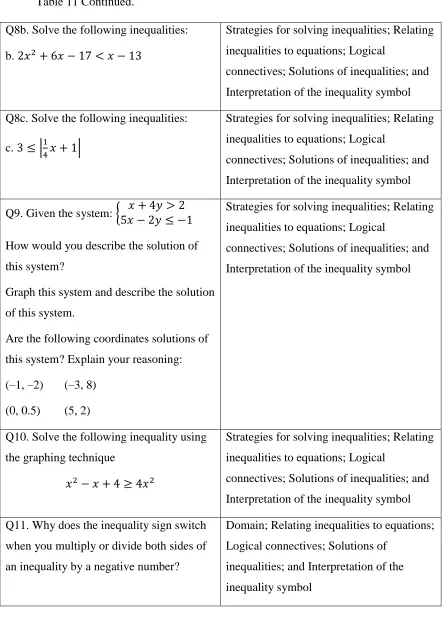
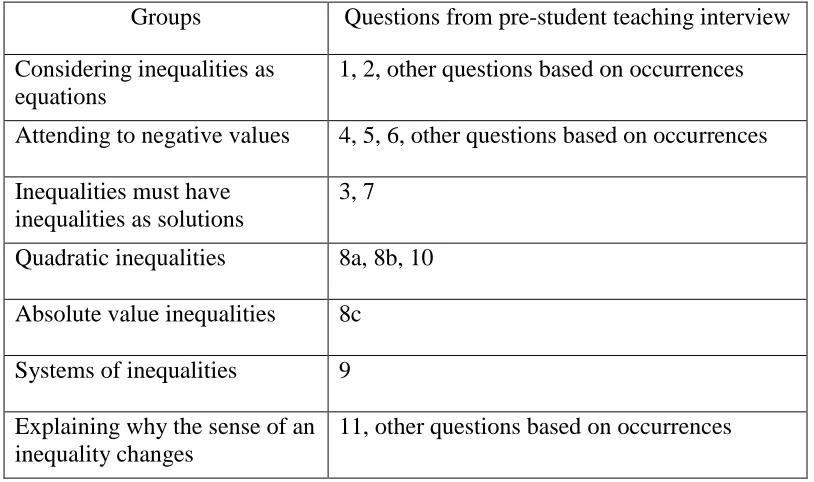
Table 11. Link between aspects of knowledge associated with inequalities and questions from pre-student teaching interview. ... 83
Table 12. Duration and content areas of the episodes from Angela's post-student teaching interview. ... 93
Table 13. Duration and content areas of the episodes from Christina's post-student teaching interview. ... 93
Table 14. Duration and content areas of the episodes from Crystal's post-student teaching interview. ... 93
LIST OF FIGURES
Figure 1. Structure of mathematical knowledge for teaching. ... 41
Figure 2. Framework characterizing knowledge for teaching school algebra. ... 46
Figure 3. Questions #9 and #10 from the pilot study of the task-based interview. ... 69
Figure 4. Questions on the post-student teaching interview addressed to the preservice teachers who taught systems of linear inequalities. ... 90
Figure 5. Questions on the post-student teaching interview addressed to the preservice teachers who taught quadratic inequalities. ... 91
Figure 6. Coding of Vanessa's classroom observation (February 28, 2011). ... 102
Figure 7. Coding of Heather's classroom observation (March 7, 2011). ... 103
Figure 8. Problem #1 from the pre-student teaching interview protocol. ... 110
Figure 9. Problem #2 from the pre-student teaching interview protocol. ... 110
Figure 10. Problem #3 from the pre-student teaching interview protocol. ... 111
Figure 11. Problem #4 from the pre-student teaching interview protocol. ... 111
Figure 12. Problem #5 from the pre-student teaching interview protocol. ... 111
Figure 13. Problem #6 from the pre-student teaching interview protocol. ... 111
Figure 14. Problem #7 from the pre-student teaching interview protocol. ... 111
Figure 15. Problems #8a and #8b from the pre-student teaching interview protocol. ... 111
Figure 16. Problem #8c from the pre-student teaching interview protocol. ... 112
Figure 17. Problem #9 from the pre-student teaching interview protocol. ... 112
Figure 18. Problem #10 from the pre-student teaching interview protocol. ... 112
Figure 20. Angela's first attempt to solve #8a. ... 120
Figure 21. Calculator screen shots as Angela reworks #8a. ... 121
Figure 22. Angela's second attempt to solve #8a. ... 121
Figure 23. Calculator screen shots from Angela's work on #8b. ... 124
Figure 24. Angela's solution to #8c. ... 125
Figure 25. Angela's attempt to use the elimination method to solve #9. ... 126
Figure 26. Angela's algebraic manipulations of #9. ... 126
Figure 27. Calculator screen shots of Angela's work on #9. ... 127
Figure 28. Angela's handwritten graph for #9. ... 127
Figure 29. Angela's graphs examining the coordinate (0, 0.5). ... 129
Figure 30. The number line Angela used as she explained #11. ... 130
Figure 31. Christina's algebraic manipulation of #4. ... 133
Figure 32. Christina's algebraic manipulation of #5. ... 133
Figure 33. Christina's algebraic manipulation of #6. ... 134
Figure 34. Screen shots of Christina's graph and table of . ... 136
Figure 35. Christina's work for #7. ... 137
Figure 36. Screen shots from Christina's work on #8a. ... 138
Figure 37. Christina's solution to #8a. ... 139
Figure 38. Christina's work and solution for #8b. ... 140
Figure 39. Screen shots from Christina's work on #8b. ... 140
Figure 40. Screen shots from Christina's initial attempt to solve #10. ... 141
Figure 42. Screen shots from Christina's revised attempt to solve #10. ... 142
Figure 43. Screen shots of the intersection points Christina used to solve #10. ... 144
Figure 44. Christina's work for #8c. ... 145
Figure 45. Christina's attempt to use the elimination method to solve #9. ... 147
Figure 46. Christina's work for #9. ... 147
Figure 47. Screen shots from Christina's work for #9. ... 147
Figure 48. Christina's work for #11. ... 150
Figure 49. Crystal's graph of #2f. ... 152
Figure 50. Crystal's work for #6. ... 153
Figure 51. Crystal's table and graph for #6. ... 154
Figure 52. Crystal's first attempt to solve #7. ... 155
Figure 53. Crystal's second attempt to solve #7 and her solution. ... 156
Figure 54. Screen shots from Crystal's work on #7. ... 157
Figure 55. Crystal's first attempt to solve #8a using a case strategy. ... 158
Figure 56. Crystal's second attempt to solve #8a. ... 159
Figure 57. Crystal's work for #8b. ... 160
Figure 58. Screen shots from Crystal's work in #10. ... 161
Figure 59. Crystal's work for #8c. ... 163
Figure 60. Crystal's work for #9. ... 165
Figure 61. Screen shots from Crystal's work for #9. ... 165
Figure 62. Crystal's work for #11. ... 167
Figure 64. Heather's work for #5. ... 171
Figure 65. Heather's work for #6. ... 171
Figure 66. Heather's work for #3. ... 173
Figure 67. Screen shots from Heather's work on #7. ... 173
Figure 68. Screen shots from Heather's second attempt for #3. ... 175
Figure 69. Heather's work for #8a. ... 177
Figure 70. Screen shots from Heather's work on #8a. ... 177
Figure 71. Screen shots from Heather's initial attempt to solve #8b. ... 178
Figure 72. Heather's initial solution for #8b. ... 178
Figure 73. Heather’s work for #8b. ... 179
Figure 74. Screen shots from Heather's second attempt to solve #8b. ... 180
Figure 75. Heather's work for #8c. ... 181
Figure 76. Heather's work for #9. ... 183
Figure 77. Screen shots from Heather's work on #9. ... 184
Figure 78. Heather's graph for #9. ... 184
Figure 79. Heather's work for #11. ... 186
Figure 80. Vanessa's work for #4. ... 189
Figure 81. Vanessa's work for #6. ... 190
Figure 82. Vanessa's work for #3 (Pre-student teaching interview; February 17, 2011). .... 191
Figure 83. Vanessa's work for #7. ... 192
Figure 84. Screen shots from Vanessa's work on #7. ... 193
Figure 86. Vanessa's work for #8a. ... 195
Figure 87. Vanessa's work for #8b. ... 197
Figure 88. Vanessa's work for #10. ... 198
Figure 89. Screen shots from Vanessa's work on #10. ... 198
Figure 90. Vanessa's work for #8c. ... 199
Figure 91. The graph that Vanessa created for #8c. ... 199
Figure 92. Screen shots from Vanessa's work on #8c. ... 199
Figure 93. Vanessa's representation of her solution for #8c. ... 200
Figure 94. Vanessa's work to isolate the variable y for #9. ... 201
Figure 95. Screen shots from Vanessa's work on #9. ... 201
Figure 96. Vanessa's graph of her solution for #9. ... 201
Figure 97. Vanessa's work for #11. ... 203
Figure 98. Vanessa's notes/worksheet outlining the process for solving a system of linear inequalities (Lesson plan; February 28, 2011). ... 221
Figure 99. Angela's notes outlining the process to graph a system of linear inequalities
(Lesson plan; May 2, 2011). ... 222
Figure 100. Example #3 from Angela's lesson plan (Lesson plan; May 2, 2011). ... 227
Figure 101. Examples #1 and #6 from Vanessa's lesson plan (Lesson plan; February 28, 2011). ... 227
Figure 103. Linear Programming problem Crystal worked out in her class (Lesson plan; March 11, 2011). ... 238
Figure 104. Crystal's work with the first constraint of a problem (Classroom observation; March 11, 2011). ... 239
Figure 105. Crystal switching between an equation and an inequality with the second
constraint of a linear programming problem (Classroom observation; March 11, 2011). ... 239
Figure 106. Calculator screenshots from Vanessa class (Classroom observation; February 28, 2011). ... 240
Figure 107. Calculator screenshots from Vanessa class (Classroom observation; February 28, 2011). ... 240
Figure 108. Calculator screenshots from Vanessa class (Classroom observation; February 28, 2011). ... 241
Figure 109. Graph of a system of linear inequalities displayed in Vanessa's class (Classroom observation; February 28, 2011). ... 241
Figure 110. Angela's process for graphing a linear inequality that was projected and
discussed (Lesson plan; May 2, 2011). ... 243
Figure 111. Crystal's first and second example (Lesson plan; March 10, 2011)... 244
Figure 112. Crystal using her hands to illustrate a balance scale (Classroom Observation; March 10, 2011). ... 245
Figure 114. Crystal demonstrating the "see-saw" thought process to her students (Classroom observation; March 10, 2011). ... 246
Figure 115. Crystal’s shading of the "see-saw" thought process (Classroom observation;
March 10, 2011). ... 246
Figure 116. Crystal’s steps to graph a system of linear inequalities (Lesson plan and
classroom observation; March 10, 2011). ... 251
Figure 117. Crystal's student used the test point method (Classroom observation; March 10, 2011). ... 253
Figure 118. Re-creation of the student's mistake in Figure 117. ... 253
Figure 119. Example #1 and the graph from Vanessa's class (Classroom observation;
February 28, 2011). ... 257
Figure 120. Calculator screenshots from Vanessa class (Classroom observation; February 28, 2011). ... 257
Figure 121. Calculator screenshots from Vanessa class (Classroom observation; February 28, 2011). ... 258
Figure 122. Vanessa's student handout regarding the solution of a system of linear
inequalities (Classroom observation; February 28, 2011). ... 260
Figure 123. Vanessa's first example (Lesson plan; February 28, 2011). ... 263
Figure 124. Vanessa's solution to her first example (Classroom observation; February 28, 2011). ... 263
Figure 126. Example #2 from Vanessa's lesson (Lesson plan; February 28, 2011). ... 265
Figure 127. Students' work for example #2 in Vanessa’s class (Classroom observation;
February 28, 2011). ... 265
Figure 128. Students' work for example #2 in Vanessa’s class (Classroom observation;
February 28, 2011). ... 265
Figure 129. Students' work for example #2 in Vanessa’s class (Classroom observation;
February 28, 2011). ... 265
Figure 130. Calculator screenshots from Vanessa class (Classroom observation; February 28, 2011). ... 267
Figure 131. Calculator screenshots from Vanessa class (Classroom observation; February 28, 2011). ... 268
Figure 132. Heather's directions for graphing a quadratic equation with two variables
(Lesson plan and Classroom observation; March 1, 2011). ... 279
Figure 133. The "basic rules" from Heather’s lesson on quadratic inequalities with two
variables (Classroom observation; March 8, 2011). ... 280
Figure 134. Slide from Vanessa's lesson with steps for graphing a quadratic inequality
(Lesson plan and Classroom observation; April 11, 2011). ... 280
Figure 135. Heather's graph with the vertex and axis of symmetry displayed (Classroom observation; March 7, 2011). ... 282
Figure 136. Heather's graph of the parabola (Classroom observation; March 7, 2011). ... 282
Figure 138. Heather's two versions of the solution set (Classroom observation; March 7, 2011). ... 282
Figure 139. Vanessa identifying the "inside" of the parabola (Classroom observation; April 11, 2011). ... 284
Figure 140. Vanessa identifying the "outside" of the parabola (Classroom observation; April 11, 2011). ... 284
Figure 141. Vanessa identifying test point (2, 4) (Classroom observation; April 11, 2011). ... 285
Figure 142. Vanessa's work for test point method for example #1 (Classroom observation; April 11, 2011). ... 285
Figure 143. Vanessa shaded the "outside" of the parabola for example #1 (Classroom
observation; April 11, 2011). ... 285
Figure 144. Heather's factored version of her first example of a quadratic inequality with one variable (Classroom observation; March 7, 2011). ... 287
Figure 145. Heather's "related equation" and solution for first example of a quadratic
inequality with one variable (Classroom observation; March 7, 2011). ... 287
Figure 146. The sign chart from Heather’s work on her first example of a quadratic
inequality with one variable (Classroom observation; March 7, 2011). ... 288
Figure 147. The shaded number line for Heather's first example of a quadratic inequality with one variable (Classroom observation; March 7, 2011). ... 288
Figure 149. Powerpoint slide Vanessa displayed during her lesson with examples of a
quadratic equation with one variable and a quadratic inequality with one variable (Classroom observation; April 11, 2011). ... 292
Figure 150. Other planned examples of quadratic inequalities with one variable from
Vanessa's lesson (Classroom observation; April 11, 20111). ... 292
Figure 151. Problems on a review sheet of quadratic inequalities with one variable requested by Vanessa’s students (Classroom observation; April 11, 2011). ... 292
Figure 152. Heather's first example of a quadratic inequality with one variable (Classroom observation; March 7, 2011). ... 293
Figure 153. Heather's second example of a quadratic inequality with one variable (Classroom observation; March 7, 2011). ... 293
Figure 154. Two examples of quadratic inequalities with one variable from Crystal's lesson (Classroom observation; April 5, 2011). ... 293
Figure 155. Crystal's third example of a quadratic inequality with one variable produced by changing the inequality sign in example #1 (Classroom observation; April 5, 2011). ... 293
Figure 156. Examples of graphing quadratic equations with two variables from Vanessa’s
class (Classroom observation; April 4, 2011). ... 294
Figure 157. Examples of graphing quadratic equations with two variables from Heather’s
class (Classroom observation; March 1, 2011). ... 294
Figure 159. Heather's second example of a quadratic inequality with two variables
(Classroom observation; March 8, 2011). ... 295
Figure 160. Powerpoint slide from Vanessa's lesson with the first example of quadratic inequality with two variables (Lesson plan; April 11, 2011)... 296
Figure 161. Vanessa's second example of a quadratic inequality with two variables (Lesson plan; April 11, 2011). ... 296
Figure 162. Vanessa' third example of a quadratic inequality with two variables (Lesson plan; April 11, 2011). ... 296
Figure 163. Vanessa's fourth example of a quadratic inequality with two variables (Lesson plan; April 11, 2011). ... 297
Figure 164. Vanessa entering the quadratic inequality on her TI-84 (Classroom observation; April 11, 2011). ... 299
Figure 165. Vanessa selecting the shading for an example on her TI-84 (Classroom
observation; April 11, 2011). ... 299
Figure 166. Vanessa's graph with shading for an example (Classroom observation; April 11, 2011). ... 299
Figure 167. Vanessa entering a quadratic expression (Classroom observation; April 11, 2011). ... 301
Figure 168. Vanessa selecting an inequality (Classroom observation; April 11, 2011). .... 301
Figure 169. Vanessa's inequality (Classroom observation; April 11, 2011). ... 301
Figure 170. A graph from Vanessa's work (Classroom observation; April 11, 2011). ... 301
Figure 172. Vanessa's solution to her first example of a quadratic inequality with one
variable (Classroom observation; April 11, 2011). ... 302
Figure 173. Vanessa's solution and work for an example of a quadratic inequality with one variable (Classroom observation; April 11, 2011). ... 307
Figure 174. Vanessa's factored version of an example of a quadratic inequality with one variable (Classroom observation; April 11, 2011). ... 308
Figure 175. For an example of a quadratic inequality with one variable, Vanessa initially set the first factor equal to zero (Classroom observation; April 11, 2011). ... 308
Figure 176. For her first example of a quadratic inequality with one variable, Vanessa set the first factor to be less than zero after a student comment (Classroom observation; April 11, 2011). ... 309
Figure 177. Vanessa initially wrote x = 7 while solving her first example of a quadratic inequality with one variable (Classroom observation; April 11, 2011). ... 309
Figure 178. Vanessa's displayed work for her first example of a quadratic inequality with one variable (Classroom observation; April 11, 2011). ... 309
Figure 179. Vanessa's test point method and shading for an example (Classroom observation; April 11, 2011). ... 312
Figure 180. Vanessa entering an example in to her graphing calculator (Classrroom
observation; April 11, 2011). ... 312
Figure 181. Graph of from Heather's lesson plan (Lesson plan; March 7, 2011). ... 315
Figure 183. Heather's work to evaluate the test point (Classroom observation; March 8, 2011). ... 318
Figure 184. Heather's shaded graph (Classroom observation; March 8, 2011). ... 318
Figure 185. The points plotted on the solution of Vanessa's first example of a quadratic inequality with two variables (Classroom observation; April 11, 2011). ... 323
CHAPTER 1: INTRODUCTION Background of the Study
There is evidence of a vicious cycle in which too many prospective teachers enter college with an insufficient understanding of school mathematics, experience little college instruction focused on the mathematics they will teach, and then enter their classrooms inadequately prepared to teach mathematics to the following generations of students.
(Conference Board of the Mathematical Sciences (CBMS), 2001, p. 163) In 2001, the CBMS report made a series of recommendations that emphasized the importance of mathematical understanding, particularly with regard to preservice teachers. There are many areas underneath the umbrella of mathematics (e.g., algebra, geometry, calculus, statistics, probability, discrete mathematics, etc.) but many argue that a focus on improving teachers’ understanding of algebra is particularly appropriate “because algebra
forms the core of the high school mathematics curriculum, improving the teaching and learning of algebra is critical” (Rakes, Valentine, McGatha, & Ronau, 2010, p. 372). In fact, in 2003, the RAND Mathematics Study Panel (2003) purported that “the initial topical choice
for focused and coordinated research and development [in Mathematics Education] should be algebra” (p. 43).
numerous studies examining the various aspects of algebra (e.g., functions, variables, equations, representations). Along with these recommendations has come much debate surrounding Algebra (e.g., Loveless, 2008; Prevost, 1986; Usiskin, 1987).
If algebra is to be the central focus, then why is there a need for further study? There are a number of studies that have examined preservice, as well as inservice, teachers’
understanding of functions (Even, 1993; Stein, Baxter, & Leinhardt, 1990; Vinner &
Dreyfus, 1989; Wilson, 1994). In addition, students’ understanding of functions has been the centerpiece of many studies (e.g., Breidenbach, Dubinsky, Hawks, & Nichols, 1991; Hollar & Norwood, 1999; O’Callaghan, 1998; Slavit, 1997; Williams, 1998; Yerushalmy, 1991).
Several researchers have turned their attention to how students understand equations (Godfrey & Thomas, 2008; Kieran, 1981; Knuth, Stephens, McNeil, & Alibali, 2006; Koedinger & Nathan, 1998; Nathan & Koedinger, 2000b). Many of these studies focused on middle and high school students’ knowledge and misconceptions of equations and equality.
However, the body of research concerning how students and teachers understand
relationships that are unequal is much smaller (Bazzini & Tsamir, 2001; Blanco & Garrote, 2007; Lim, 2008; Tsamir & Bazzini, 2002; Vaiyavutjamai & Clements, 2006). The majority of this work has been focused on secondary students (ages 16-17) primarily from Israel and Italy.
Wagner, 1999). Those studying conception of inequalities (e.g., Blanco & Garrote, 2007; Tsamir & Bazzini, 2002) have noted that there appears to be an over emphasis or an
unfounded reliance on the similarities in structure between equations and inequalities that has led to a lack of distinction between the two:
Many students understood the greater than and less than signs to be a nexus between two algebraic expressions. They then carried this nexus through the various steps in solving an inequality without attaching any meaning to it, even to the point of simply substituting an equals sign. (Blanco & Garrote, 2007, p. 224)
This over emphasis or unfounded reliance is characterized by students’ attempts to apply transformational techniques or algebraic manipulations used with equations to solve inequalities (Kieran, 2004).
With consideration to the volumes of studies that examine algebra, there is a deficit in the area of teachers’ knowledge, or for that matter preservice teachers’ knowledge, of
inequalities. Many of the authors of the studies that examined students’ understanding of
inequalities included statements similar to those made by Tsamir and Bazzini (2002):
…teachers should be familiarized with these intuitive beliefs and with their impact on students’ reasoning when solving inequalities. They should, subsequently, be
encouraged to look for ways to promote students’ awareness of various intuitive obstacles and of the need to be ‘on guard’ when solving mathematical problems in
in the same manner as equations) as the students who were examined. Additionally, none of the studies examined how teachers develop and implement lessons on inequalities. Before researchers can make recommendations for how teachers should address students’
misconceptions about inequalities, the field needs to know what teachers understand about inequalities. Without an understanding of what teachers know about inequalities, initiatives designed to strengthen preservice teachers’ content knowledge and pedagogical content
knowledge within methods courses may rely on false assumptions. This dissertation aims to provide some insight into this issue.
Definition of Terms
It is worthwhile to define several of the terms used in this study so that they are used and interpreted consistently.
Inservice teacher – teacher that is employed by a school and licensed in the courses that they teach
Preservice teacher – student in a teacher education program at an institute of higher education pursuing licensure as a teacher
Cooperating teacher – an inservice teacher who has is supervising a preservice teacher during student teaching field experience
Student – the pupils enrolled in a secondary-level class
Lesson – a series of activities designed to explore, practice, and/or explain a specific objective
Inequality – a mathematical statement that two expressions are related to one another in the one of the following manners: less than (<); greater than (>); less than or equal to (≤); greater than or equal to (≥); or not equal to (≠).
Significance and Focus of the Study
Research on teachers’ understanding of inequalities is lacking and has not been a
primary focus of the field (Kieran, 1992, 2007; Li 2007). Most studies that have been
conducted involved inservice teachers and have scrutinized their understanding of equations. Rarely do studies involve preservice teachers as participants. This study seeks to do its part to fill a void in the knowledge base for mathematics education. By capitalizing on the available information about students’ understanding of solving equations (e.g., Kieran, 1981;
Koedinger & Nathan, 1998; MacGregor & Stacey, 1993; Rittle-Johnson & Star, 2009) and solving inequalities (e.g., Tsamir & Bazzini, 2002), this study seeks to add to the limited information that is available about preservice teachers’ understanding of inequalities. In
addition, the knowledge gained as a result of this study may potentially help teacher educators as they structure programs, courses, and experiences in an effort to strengthen preservice teachers’ content knowledge.
The purpose of this study was to examine the nature of preservice teachers’
understanding of inequalities and how they use that knowledge in the classroom. The participants of this study were five preservice teachers at a major university in the Southeast United States, who were fulfilling their student teaching field experience requirement.
What is the nature of preservice teachers’ understanding of inequalities prior to
the student teaching field experience?
How do preservice teachers use their understanding of inequalities while planning
and implementing lessons during the student teaching field experience? Overview of Approach
This study uses a qualitative case study approach as outlined by Yin (1993). The researcher examines the nature of preservice teachers’ understanding of inequalities and how
that understanding is applied in the practice of planning and implementing lessons. Five cases, each one of the student teachers, and rich with information, provide the backdrop to answer the first research question of this study. By examining multiple cases, analyses within and among the cases becomes available. For the second research question, there were two cases: systems of linear inequalities and quadratic inequalities. These two cases emerged during data collection when it became clear that there are two different topics in inequalities that are being taught during the student teaching field experience that may draw upon different content knowledge by the preservice teachers.
A series of interviews with the participants were conducted prior to, during, and after the student teaching field experience. The pre-student teaching interview was a task-based interview conducted prior to the preservice teachers’ student teaching field experience. Pre-
teachers’ understanding of inequalities and identify the manner in which that understanding
was used during the planning and implementation of lessons pertaining to inequalities. The preservice teachers submitted the lesson plans that they created. The lesson plans were examined and used as exploration points during some of the post-student teaching interviews. Additionally, classroom observations of the implementation of the lessons were conducted by the researcher. The classroom observations were video recorded. Relevant aspects of the video recordings were used during the post-student teaching interview to gain insight into the preservice teachers’ decisions and actions.
Chapter Summary
The studies that scrutinized inservice teachers seemed to suggest that “teachers lack conceptual knowledge of many topics in the mathematics curriculum” (Attorps, 2005, p. 2). While Bazzini, Tsamir, and their colleagues have conducted studies that have brought to light the strategies, misconceptions, and understanding that students have about inequalities, there is very little in the literature specifically addressing teachers, inservice or preservice. With the realization that there exists a gap in the literature, this study seeks provide valuable information about preservice teachers’ understanding of inequalities and how such
understanding is used when planning for and implementing classroom instruction. Informed by interviews, examinations of lesson plans, and classroom observations, a case study analysis is conducted.
Organization of the Study
discussed in Chapter 3. Chapter 4 contains the results of the data analysis in relation to the preservice teachers’ understanding of inequalities prior to the student teaching field
CHAPTER 2: LITERATURE REVIEW Introduction
This chapter lays the foundation on which this study is situated, by synthesizing the available literature. This chapter is separated into three main sections to review the research related to: 1) knowledge in algebra; 2) knowledge of inequalities; and 3) teachers’ content knowledge for teaching mathematics. Within the first two sections, the majority of the reported research focuses on investigating student knowledge. Wherever possible, research pertaining to teacher knowledge is included and synthesized with the work conducted with students.
This literature review draws upon works that include dissertations, research
syntheses, journal articles, and conference proceedings. The search is limited in the fact that non-English language journals, dissertations, and proceedings were not considered.
Knowledge in Algebra
equal sign; and defining an equation. Literature surrounding these areas of difficulties is discussed in upcoming sections.
Conceptions surrounding the use of variable
Knuth, Alibali, McNeil, Weinberg, & Stephens (2005) asked if algebra was nothing more than “the study of the 24th
letter of the alphabet” (p. 69)? Booth (1984) provided the following comment from an interview with a student.
Julie, aged 14 years, was asked about the expression 3x + 8y + 2x I: ‘Do the x and y mean anything there, do they stand for anything?’ J: ‘No, they’re just letters, you have them in algebra.’ (p. 13)
The question posed by Knuth et al. (2006) and Julie’s comment from Booth’s (1984) interview speak to an issue related to use of variables in algebra, even with inequalities. Comments like these should not be surprising since there have been multiple meanings that have been assigned to variable in algebra: unknown, placeholder, symbol, parameter, or argument1 (Usiskin, 1988). Usiskin (1999) provided an oversimplified summary of the relationships between the different conceptions of algebra and the different uses of variables (see Table 1).
1
Table 1. Relationship between conceptions of algebra and use of variables
Conception of Algebra Use of Variables
Generalized arithmetic Pattern generalizers (translate, generalize) Means to solve certain problems Unknowns, constants (solve, simplify) Study of relationships Arguments, parameters (relate, graph)
Structure Arbitrary marks on paper (manipulate, justify) Source: Usiskin, 1999, p. 13
At times, teachers do not fully appreciate difficulties that students have with variables. Teachers often assume that students understand that “the same literal symbols stand for the same values throughout [an algebraic] expression” (Olive & Caglayan, 2008, p.
285). In addition, students may haphazardly assign variables without fully defining the variable. Unfortunately, teachers tend to propagate this sloppy notation by writing ‘t = teachers.’ The teacher more than likely said or meant to write ‘t = the number of teachers,’
however there is no guarantee that students have made this connection (Booth, 1988; Stacey & MacGregor, 1997).
Olive & Caglayan (2008) discuss another issue that students have when working with variables. The problems are related to two different kinds of quantity: intensive and
extensive. “An extensive quantity can be counted or measured directly, whereas an intensive quantity is derived from the multiplicative combination of two like or unlike quantities”
The issue about use of intensive and extensive quantities is often found in examples that involve coins. All too often, students and/or teachers use ‘p = pennies’ without any
consideration of whether they are talking about the number of pennies, the value of a penny, or the total value of all the pennies (Olive & Caglayan, 2008). If the assignment of the variable p is in reference to the number of pennies, then the variable p would be an extensive quantity. However, if the variable p is intended to represent the value of the pennies, then the variable p would be an intensive quantity.
Another issue related to use of variables is the position of the variable in single-variable linear equations or inequalities. A result-unknown problem has a single-variable that is determined by a series of mathematical operations specified within the problem (e.g.,
). A start-unknown problem has a variable that is needed in order to
determine the relationship among the givens (e.g., ). Stated another way, the unknown in a start-unknown problem is “the start of the process or events described in the problem” (Koedinger & Anderson, 1998, p. 164). Nathan & Koedinger (2000b) noted that
start-unknown problems, involving equations, tended to “require algebraic methods or more sophisticated modeling” (p. 170), whereas result-unknown problems, involving equations, could typically be “solved through direct application of arithmetic operations” (p. 170).
disappear with time. Koedinger & Tabachneck (1995) found college-level students working problems with multiple steps and rational numbers still had difficulty solving start-unknown problems (as cited in Nathan & Koedinger, 2000b). There is nothing in the literature to suggest that this would be any different for inequalities.
Difficulties with the equal sign and defining an equation
Arcavi (1994), who built on Fey’s (1990) work with number sense, outlines what
symbol sense would include. One of the behaviors listed is “an understanding of and an aesthetic feel for the power of symbols” (Arcavi, 1994, p. 31). A symbol of particular interest in algebra is the equal sign. Knuth et al. (2006) examined 177 middle school students’
understanding of the equal sign and their ability to solve equations. The authors found “a strong relation between equal sign understanding and success in solving equations” (Knuth et al., 2006, p. 308). Additionally, Knuth et al. (2006) categorize students’ understanding of the equal sign as operational or relational2. Operational responses typically implied a notion of ‘find an answer’ or ‘perform some operations.’ Conversely, relational responses express the
equivalency of two sides. The findings of Knuth et al. (2006) are similar to those of other studies (Attorps, 2003; Izsak, Caglayan, & Olive, 2009; van Dooren, Verschaffel, & Onghena, 2002; Wagner & Parker, 1993).
Attorps (2003) pointed out gaps in teachers’ knowledge about the meaning of an
equation. The author identified six categories in which the teachers’ concept image of equations did not match the concept definition of equations. Teachers did not consider the following as equations:
2
Identities (e.g., )
Non-algebraic equations (e.g., )
Equations with more than one unknown factor (e.g., ) Trivial equations (e.g., x = –9)
Functions (e.g., f(x) = 11x + 2) (Attorps, 2003, p. 5 – 6)
In the previous sections, knowledge in algebra was discussed. Specifically, the difficulties surrounding use of variables, the equal sign and defining an equation were reviewed. The next section will focus on available literature pertaining to knowledge of inequalities held by teachers or students.
Knowledge of Inequalities
The study of equations and inequalities is a centerpiece of every algebra curriculum. Within the Principles and Standards for School Mathematics, the NCTM (2000) outlined an expectation that students should be able to fluidly move between equivalent forms of
equations and inequalities and “judge the meaning, utility, and reasonableness of the results of symbol manipulations, including those carried out by technology” (p. 297). However,
research on teaching and learning inequalities is limited at best. The majority of studies have been conducted outside of the United States and with secondary students. That does not mean that these studies do not provide relevant and useful information. Due to the similarities between equations and inequalities, some of the findings from studies centered on equations may be used to supplement what is known about inequalities.
be discussed in the following sections. Within each strategy, potential issues and benefits are examined. In addition, research that identified areas of difficulties for students are explored. Whenever possible, research that utilized teachers as the participants is incorporated and identified.
Strategies for Solving Inequalities
Based on their analysis of Israeli high school students, Tsamir and Almog (2001) concluded that students, for the most part, use three strategies to solve inequalities: (1) algebraic manipulation, (2) drawing a graph, and (3) using a case approach. Students were not exclusively implementing a single strategy for all inequalities. The strategy employed by students often depended on the type of inequality (linear, quadratic, multi-variable, etc.) students encountered. The decisions made by students, as to which strategy to utilize, seemed to be affected by those strategies presented in the classroom for that particular type of
inequality (Tsamir & Almog, 2001).
Tsamir, Almog, and Tirosh (1998) noted that when it comes to inequalities, “attention is mainly paid to ‘How to solve’ and not to ‘Why to solve it this way?’” (p. 129). This
inability to see ‘why’ one solves an inequality with a particular strategy impedes students’ development of “a feeling for when to abandon symbols in favor of other approaches in order
to make progress with a problem, or in order to find an easier or more elegant solution or representation” (Arcavi, 1994, p. 31).
solving inequalities (Tsamir & Almog, 2001; Tsamir et al., 1998). Algebraic manipulations include the following:
addition or subtraction of the same term to both sides of the inequality;
multiplication and division of both sides of the inequality by identical factors, with
appropriate attention to the orientation of the inequality symbol;
simplification of an expression through combining like terms or factoring; multiplying both sides of the inequality by the square of the denominator;
“examining quadratic inequalities (i.e., ) by first relating to the
quadratic roots , or by investigating the sign of ‘a’ and the sign of the determinant”
(Tsamir et al., 1998, p. 131); and
“relating to an inequality of the type ab > 0 as a compound system of {a > 0 and b >
0} or {a < 0 and b < 0}” (Tsamir & Almog, 2001, p. 515).
Even if students are able to apply a formal algebraic method correctly, one may wonder what level of understanding they possess. Steinberg, Sleeman, and Ktorza (1990) found that “many students master procedural details of solving equations without
understanding why they are justified” (p. 112). For these students, a formal algebraic method is an instrument that is blindly applied without any thought as to why or how it works. These students lack a relational view of that instrument (Knuth et al., 2006). It can be hypothesized that this lack of a relational view when applying algebraic manipulations is not exclusive to solving equations and may apply to inequalities.
the fact that “many students are not sure that an equation that has been derived by a valid
transformation has the same solution or are unable to recognize when an equation has been transformed in a way that does not alter the answer” (Steinberg et al., 1990, p. 119). The
students possess procedural knowledge of transformations. However, they do not have conceptual knowledge. It is reasonable to assume that this same issue may apply to students’ understanding of transformations applied to inequality statements. For those students without conceptual knowledge of algebraic transformations, an inequality prior to a transformation would be viewed as completely disjoint from the inequality obtained after a transformation.
Drawing a graph3 for solving inequalities.In Tsamir and Almog’s (2001) research, if a student drew a graph of the given function(s) and used it to attain the solution, then they applied the drawing a graph (graphing) strategy. In the Tsamir and Almog study, the students were categorized as applying a graphing strategy if their graphs were on a two dimensional Cartesian coordinate plane. Graphs on a number line or sign chart were not included in this strategy. Sign charts and number lines were tools used by students while invoking an algebraic strategy.
A point of interest is when the students applied a graphing strategy. Tsamir and Almog (2001) noted that students applied a graphing strategy only with rational and
quadratic inequalities, not with linear inequalities. Additionally, those students were usually successful, especially when using graphical representations of parabolas for quadratic and rational inequalities.
3
One cannot assume that students will learn the same mathematics when solving an inequality graphically as compared to solving using algebraic manipulations (Sackur, 2004). Kieran (2004) noted that graphical representations may help students to form a conceptual understanding of the symbolic form of inequalities. Additionally, use of graphical
representations may help students overcome the pitfall of incorrectly applying transformational techniques used with equations while solving inequalities.
Reilly (2010) outlined a discovery activity designed to promote middle school students’ understanding of the solution of systems of linear inequalities by using
transparencies. Part of her reasoning for presenting her discovery activity was to provide an alternative to the following “long series of procedural steps that lack meaning” and are
typically found in textbooks (Reilly, 2010, p. 56).
1. Graph the equation of the first inequality as if it had an equal sign by finding the x- and y-intercepts or by putting the equation into the y = mx + b form.
2. Look at the inequality. Determine if the line should be dashed or solid. Erase parts of the line that you already drew if it should have been dashed. (Remind yourself to check the line before you draw it next time.)
3. Do a test case, and see which side of the line should be shaded. 4. Shade it lightly, since more shading will be required.
5. Repeat steps 1 through 4 for the second inequality. 6. Repeat for additional inequalities in your system.
It should be noted that algebraic manipulations may be necessary in order to convert the given inequality into slope-intercept form or to calculate the x and y intercepts (see step 1). Even with the application of these algebraic manipulations, the long series of steps outlined above include the creation of a two-dimensional graph in order to solve the given system of linear inequalities. As a result, Tsamir and Almog (2001) would classify the long series of steps as a graphing strategy.
A graphing strategy assumes an understanding of graphing functions. It provides students with an opportunity for insight into connections between inequalities, equations, variables, and functions. As such, a graphing strategy has “procedural as well as conceptual advantages” (Dreyfus & Eisenberg, 1985, p. 654). One major advantage of a graphing
strategy lies in the fact that difficulties are within the steps for solving an inequality by graphing and are not the steps themselves. Reilly’s (2010) first step directs the student to graph a linear equation (eg., y = mx + b). This action may be cumbersome or difficult
depending on the values of the slope and y-intercept. With the use of technology, some of the difficulties within this step can be minimized.
Using a case approach for solving inequalities. One method to solve inequalities is known as a case approach or the ‘casing to death’ approach (Dreyfus & Eisenberg, 1985).
Consider the following inequality: . There are two possibilities to make this product of two factors negative: the first factor must be positive and the second factor must be negative; or vice versa.
These two conditions cannot be satisfied simultaneously, so the solution set for this case is empty.
Case 2: –, + and x + 9 > 0, which is equivalent to and x > –9.
These two conditions are simultaneously satisfied by .
Therefore, the solution to the inequality is the union of the two partial solutions sets
from the cases: . Dreyfus & Eisenberg (1985) noted that “the strengths of the
case approach for the mathematically inclined student is exactly its drawbacks for the weaker student; namely the need for careful and systematic treatment of the logical and set-theoretic connectives” (p. 653). The logical and set-theoretic connectives refer to usage of “and” or “or” in problems.
Students in Tsamir and Almog’s (2001) study used a case approach with compound
inequalities and with rational inequalities. Some even used both a case approach and a graphing strategy on compound inequalities. This combination of strategies is interesting because of the complementary nature of the two strategies. “[E]ach [strategy] exhibits a view of inequalities which is lacking in the other one” (Dreyfus & Eisenberg, 1985, p. 658).
implementing a case approach. An ability to understand logical connectives and set operations is vital when applying a case approach. Whereas, when students implement a graphing strategy an ability to graph a library of functions is necessary.
Students will use a strategy based on their comfort level, which is affected by what has been shown to them in a classroom. Often they will not consider long-term implications of a dedication to any strategy (Nathan & Koedinger, 2000b). One may say that it does not matter as long as they arrive at the correct solution. Vaiyavutjamai and Clements (2006) noted that low and middle performing participants, who employed a variety of strategies, were unable to describe how the inequality symbols, number lines, and operations all linked together.
Difficulties Encountered With Inequalities
In examining available research on inequalities, several researchers point to areas in which students typically experience difficulties as they formulate an understanding of inequalities. These areas of concern included:
relating inequalities to equations; interpretation of solutions;
understanding logical connectives;
the sign of the factors of products and/or quotients; denominators of rational inequalities; and
The majority of these studies involve high school level students. However, Üreyen, Mahir & Çetin (2006) discussed how these same difficulties are encountered by students in a college-level Calculus course. The six areas of concern are discussed more fully below.
Difficulties relating inequalities to equations.Students encounter difficulties as they try to overlay their prior knowledge and experiences with equations onto inequalities. These difficulties include solving equations instead of inequalities, multiplying or dividing by factors that are not necessarily positive, and forming meaningless connections with quadratic roots.
Vinner, Tall, and others (Tall & Vinner, 1981; Vinner, 1983, 1991; Vinner & Dreyus, 1989) discussed distinctions between a concept definition and one’s concept image. A
concept image is “the total cognitive structure that is associated with the concept, which
includes all the mental pictures and associated properties and processes” (Tall & Vinner, 1981, p. 152). The concept definition is the mathematical definition of the concept. The difficulties noted above point to concept images held by students on equations and inequalities that do not match the concept definitions. Students are blurring the lines that separate equations from inequalities, and are thinking of the two in an interchangeable manner.
Solving equations instead of inequalities. Students seem to have issues developing appropriate concept images for equations and inequalities. Part of the problem can be traced to teachers’ concept image of equations and inequalities. Attorps (2003) noted that some
teachers included inequalities and expressions (e.g., ) in their concept
teacher educators. If teachers have difficulties distinguishing between equations and inequalities, then how can we expect students to have a concept image of equations and of inequalities that adheres well to the concept definitions and separates the two (Tall & Vinner, 1981).
Familiarity with equations is part of the cause of the difficulties students, and teachers, encounter with inequalities. Students in a study by Tsamir and Bazzini (2004) “expressed confidence in the correctness of their (incorrect) solution, because all the
procedures had been successfully applied ‘a million times’ when solving equations” (p. 809).
The structural similarities of equations and inequalities blind students to the subtle, yet important, differences.
Multiplying or dividing by factors that are not necessarily positive. In solving
rational inequalities, some students violate the stipulation that one is only allowed to multiply both sides of an inequality by a factor which is clearly positive. Tsamir et al. (1998) noted that students will simply multiply both sides of a rational inequality by the denominator without any consideration for non-positive scenarios. While solving an inequality, a student, in a study by Tsamir and Bazzini (2002), commented that “when doing the same operation (i.e., multiplying by a) on both sides, the equivalency is preserved” (p. 292). A far more
Difficulties with solutions.A solution to an inequality differs from that of an equation. Generally, solutions to inequalities are sets of numbers which are not discrete. On the other hand, solutions to equations are generally a discrete set of numbers. The difficulties that students have with solutions of inequalities involve an overall understanding of what the solution of an inequality means and an understanding about possible solution(s) to an
inequality. Some of these issues point to a lack of symbol sense relative to “the realization of
the constant need to check symbol meanings while solving a problem, and to compare and contrast those meanings with one’s own intuitions or with the expected outcome of that
problem” (Arcavi, 1994, p. 31). Some students, taught using traditional methods, were able to solve standard inequality problems but were not able to adequately express the meaning of symbols or solutions (Bazzini, Boero, & Garuti, 2001; Bazzini & Tsamir, 2001).
Van Dooren et al. (2002) noted that teachers tend to view algebraic methods as “the
only real mathematical problem-solving method” (emphasis in the original, p. 323) and informal methods were not “mathematical method[s] at all” (p. 343). However,
Vaiyavutjamai and Clements (2006) pointed out that ninth grade students at low and middle overall academic performance levels had great difficulty describing the answers to
inequalities, especially after performing algebraic manipulations. This implies that using a ‘real mathematical problem-solving method’ does not guarantee understanding, let alone a
skills” (p. 145) and not an instrumental or a relational understanding of inequalities (Skemp,
1976; as cited by Vaiyavutjamai & Clements, 2006).
Inequalities will have inequalities as solutions. Tsamir & Bazzini (2004) analyzed 148 students’ responses to an inequality questionnaire. One of the tasks on the questionnaire
asked students to determine the truth value of a statement (i.e., x = 34 is the only solution to an inequality) and to explain their reasoning. About half of the students provided a correct claim. However, only one in twenty could provide a valid explanation. Of those with the correct claim, two invalid explanations emerged repeatedly. The first invalid explanation indicated that the solution (i.e., x = 3) belonged to a system of inequalities. Generally, students used single-variable inequalities whose intersection was the solution. The second invalid explanation pointed to the fact that x = 3 belonged to the set of solutions. Even if a student believes or accepts the notion that an equation can be a solution to an inequality, students’ concept images surrounding that notion may be flawed or incomplete.
A second task asked students to find the solution to a given inequality (i.e., ). Once again, only half of the students were able to provide the correct answer (i.e., x = 0). Many of the students indicated that the solution was an empty set. “Typical explanations were ‘ is an expression with an even power and thus it can never be negative’, where students ignored the ‘zero-option’” (Tsamir & Bazzini, 2004, p. 797).
The analysis of the answers to both of these tasks provided some interesting findings. The authors focused on consistencies and inconsistencies in the students’ responses to the
two tasks. 20% of all of the students provided inconsistent responses: a correct answer for
4
task two and an incorrect claim in task one. Even with evidence to the contrary, they still held to the belief that “an inequality can only be the solution of an inequality” (Tsamir &
Bazzini, 2004, p. 798).
Single number answer tendency. Many students display, what Vaiyavutjamai and Clements (2006) termed, ‘single number answer tendencies’ when solving inequalities. These
students are on the opposite side of the spectrum from students in Tsamir & Bazzini (2004). Students with this single number answer tendency believed that the answer to an inequality should be structurally similar to the answer for an equation. In some cases, students were able to perform the correct mathematical operations to solve a given inequality. Their solutions (i.e., x < –5) would give an outward appearance that the student had reached the desired end. However, when questioned to explain the meaning of their answer, students responded in a manner similar to the following:
Student: The answer is negative 5.
Interviewer: Your answer is negative 5. Show me your answer on a number line. Student: [Drew the following, with the x above the –5.] The number x is negative 5. x
Interviewer: Is there only one answer? Student: Yes.
(Vaiyavutjamai & Clements, 2006, p. 134)
Forming meaningless connections with quadratic roots.As students learn to solve quadratic equations such as by applying the square-root property, they tend to write
solutions as . This shorthand version of the answer is not mathematically incorrect, however students need to understand what this version of the solution really means (i.e., x = – 2 and x = 2). Tsamir and Almog (2001) noted that students attempted to apply the
square-root property to inequalities. For example, students applying the square-square-root property to
would provide the following solution , instead of x < – 9 or x > 9. These
same students, when interviewed, could not explain what their answer meant as a solution.
Excluded values. With inequalities, two possible areas of excluded values must be considered; non-zero denominators of rational expressions and non-negative values under even-indexed roots. The issues and difficulties that involve excluded values may not be evident in problems in which the excluded value does not affect the final solution. From time to time, students will incorrectly impose restrictions prescribed by an even-indexed radical when restrictions prescribed by a denominator are appropriate, and vice versa (Tsamir & Almog, 2001). In these cases, it is clear that students understand that a restriction is being imposed, however, their lack of symbol sense prevents them from reasoning about the appropriateness of that restriction (Arcavi, 1994).
Difficulties with logical connectives.A case approach to solving inequalities hinges on one’s ability to correctly apply logical connectives. One must determine and solve the