Application of Classification Techniques on
Various Attributes of Breast Cancer
Jothi Prabha A, A.Govardhan
Associate Professor, Dept. of CSE. Jyothishmathi Institute of Technology &Science, Karimnagar, TS, India
Professor, Dept. of CSE, EC Member and Principal, JNTU Hyderabad, TS, India
ABSTRACT: Data mining is extracting useful information from enormous data by analysing it to make decisions that are used to improve the growth of an organization. This is known as the knowledge discovery in databases (KDD). Data mining plays a crucial role in several domains such as the business sector, government sectors, scholastic institutions, healthcare, scientific research and engineering. Many people die due to various chronic diseases such as Cancer, Coronary Heart Disease, and Diabetes etc. In this paper we review the attributes of breast cancer disease by observing intensity levels of each attribute. By observing the intensity levels, we can predict the disease quickly. Doctors can take suitable decisions to cure the disease of patients. In this paper, we observe the seriousness of the disease by looking into their intensity levels by applying data mining techniques
KEYWORDS: Data mining, Classifications, j48 Algorithm, Naïve Bayes.
I. INTRODUCTION
Chronic diseases affect a large amount among elderly and cause a major public problem. In the present-day situation, Data Mining is turning out to be prevalent in healthcare because there is a necessity for effective well-structured methodology for discovering unknown and crucial information in healthcare data. Chronic diseases are gaining more attention of health care providers, insurance, and patients. Almost half of the US populace has one or more chronic diseases, but many of these diseases are under-treated. The consequence of under treated disease is increased morbidity and mortality. The data of healthcare organizations are very large and complicated, thereby making it tough to explore and analyse the data. In this paper, we explore different datasets relating to Breast cancer by applying data mining techniques. When effective data mining techniques are applied and important data is extricated from enormous amount of data, it shall be useful for doctors to come up with a cognizant decision and shall also help totake better healthcare decisions. In this paper work, breast cancer dataset has been explored. The database has 699 instances used for breast cancer analysis. Ten dissimilar attributes are used to predict 2 fields: M= malignant or B= benign .In this paper, pre-processing of data, conversion and disunion of data is done on training test data set. To accomplish our agenda, training data is used to develop the model and use test data to ratify the emerged model. Here benign and malignant are values of class attribute.
Benign condition refers to a tumour or cyst that is non-cancerous. Benign cells do not spread to adjacent tissue or other parts of our body. Benign conditions sometimes suggest that it is not critical or dangerous. Benign and its antonym Malign are medical terminologies used to pronounce a tumour or a cyst as either non-cancerous or cancerous respectively. A malignant tumour is characterized to grow rapidly and spread to other parts of the body and is also dangerous and uncontrollable. The dataset we use has a total of 699 instances, We have considered 10 class attributes which are Sample code number, Uniformity of cell size , Clump Thickness, marginal Adhesion , Uniformity found in cell shape, Bare Nuclei, Singular Epithelial cell size, Bland Chromatin,Mitoses, Normal nucleoli and class values are Malignant(241) and Benign(458).
Vol. 4, Issue 6, June 2016
II. RELATED WORK
Data mining has a great potential for the healthcare sector which deals with systematic analysis of data, aids in discovering the best practices, improvise care and cost reduction. Managing a large repository such as healthcare data is still a great challenge. Data Mining also plays a crucial and vital role in analysis and prediction of various diseases.
A. Classification:
Classification is a process of segregating data samples into associated classes. Classification predicts the associated class for each data point, for instance, a patient can be classified as having high risk or low risk based on the relevance of their disease pattern. It is a pragmatic learning method having known class types. Two widely used classification methods are Binary and Multilevel classification. In binary classification technique, there could be only two possible classes derived such as high risk or low risk patient. Whereas the multiclass approach can have more than two final classes or targets. Dataset is portioned as training and test dataset. Using training dataset the classifier can be trained. The accuracy level of the classifier could be evaluated by using the test dataset.
B. Naïve Bayes Classification:
Naïve Bayes is a classifier which is simple and is based on Bayes theorem strong independence acceptance. Description of Bayes rule:
Bayes rule
( | ) =
( | ) × ( )
( )
The simple idea of Bayes rule is to predict the probabilities of class membership .It is the result of an event or a theory (H) which can be predicted based on some proof (E) that can be observed. From Bayes rule, we have
1. A prior chance of P (H) or H: The probability for an event to occur before the proof is noticed.
2. A posterior chance of P (H|E) of H: The probability for an event to occur before the proof is noticed.
Description of Naïve Bayes:
The Bayes theory is highly suitable for instances where input dimensionality is high. Naïve Bayes model usesparameter approximation, which is based on maximum likelihood principle. The main advantage of using this classification technique is that it requires a minimal amount of training data to estimate the required parameters.
C. J48 Algorithm-Decision Tree Induction:
Classification is a set of techniques used for developing a prototype of classes from a set of data or records which have associated class label. Decision tree induction Algorithm is used to sense the way in which the attributes behave for a number of circumstances. Based on few training instances, classes for newly created instances can be identified. Using this algorithm rules for prediction of variables can be generated.
For decision tree induction, breast cancer test dataset has been used. A decision tree is constructed using j48 algorithm by which we can easily understand how many people are suffering from breast cancer. The tree represents a leaf node if many instances relate to the same class, and the leaf node is generated by labelling the same class. A test is conducted on that attribute to identify the hidden information. The growth of information is figured, which shall depend on the test result of the corresponding attribute. Further, the best attribute is determined based on the present selection test and the attribute is identified for branching.
III.EXPERIMENTSANDRESULTS
Naïve Bayes classification for Breast Cancer data sets:
Table 1. Stratified cross-Validation in Naïve Bayes
STATISTICS OF CLASSIFIED INSTANCES
The Number of Correctly classified instances 671 96.99%
The Number of Incorrectly classified instances 28 4.00%
Total no of Instances 699
Confusion matrix: a b
436 22 a=benign
b=malignant
6 235
Detailed Accuracy in terms of Class
Benign
TP Rate FP Rate
436/(436+22)=0.956 6/(6+235)=0.025
Malignant 235/(6+235)=0.975 22/(22+235)=0.048
We have a total of 699 tuples in this trained test data for applying the data mining classification techniques.
Figure: 01 Cost/Benefit analysis for class benign
From Table 01 and Figure 01 shows Naïve Bayes result we find For above confusion matrix, true positives for class a=’benign’ is 436 while false positives is 22 whereas, for class b=’malignant’, i.e. diagonal elements of matrix 436+235 =671 represents the benign instances classified and other elements 22+6 = 28 represents the malignant. Cost benefit analysis for class benign shows the how much prediction of class benign.
Vol. 4, Issue 6, June 2016
B. J48 Algorithm-Decision Tree Induction:
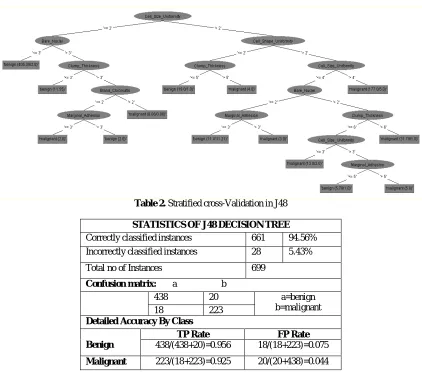
Figure 2. Decision Tree Model
Table 2. Stratified cross-Validation in J48
STATISTICS OF J48 DECISION TREE Correctly classified instances 661 94.56%
Incorrectly classified instances 28 5.43%
Total no of Instances 699
Confusion matrix: a b
438 20 a=benign
b=malignant
18 223
Detailed Accuracy By Class
Benign
TP Rate FP Rate
438/(438+20)=0.956 18/(18+223)=0.075
Malignant 223/(18+223)=0.925 20/(20+438)=0.044
J48 decision tree in above figure 02 shows the total number of leaf nodes as 14and the decision tree size is 27.We shall generate the succeeding rules:
Uniformity_Cell _Size <= 2 | Bare_Nuclei<= 3: benign (405.39/2.0) | Bare_Nuclei> 3
| | Clump_Thickness<= 3: benign (11.55) | | Clump_Thickness> 3
| | | Bland_Chromatin<= 2
| | | | Marginal_Adhesion<= 3: malignant (2.0) | | | | Marginal_Adhesion> 3: benign (2.0) | | | Bland_Chromatin> 2: malignant (8.06/0.06) Cell_Size_Uniformity> 2
| Uniformity_Cell _Shape <= 2
| | Clump_Thickness<= 5: benign (19.0/1.0) | | Clump_Thickness> 5: malignant (4.0) | Uniformity_Cell _Shape > 2
| | Uniformity_Cell_Size<= 4 | | | Bare_Nuclei<= 2
| | | | Marginal_Adhesion> 3: malignant (3.0) | | | Bare_Nuclei> 2
| | | | Clump_Thickness<= 6
| | | | | Uniformity_Cell _Shape <= 3: malignant (13.0/2.0) | | | | | Uniformity_Cell _Size > 3
| | | | | | Marginal_Adhesion<= 5: benign (5.79/1.0) | | | | | | Marginal_Adhesion> 5: malignant (5.0) | | | | Clump_Thickness> 6: malignant (31.79/1.0)
| | Uniformity_Cell _Size > 4: malignant (177.0/5.0)
The succeeding rules are generated for the various attributes of breast cancer as shown in the above figure.It shows the values and intensity of attributes that cause one or more morbidities.
Figure 2. Comparison of Naïve Bayes and J48 classification
The above chart says correctly classified instances in Naïve Bayes and j48 decision tree of the benign class whereas malignant has low instances. As well as in the first rule Class = benign when Uniformity of Cell Size <= 2 and Bare Nuclei <= 3. At level 2, 99.51% of records are classified as benign and 0.49% are classified as malignant .The total number of correctly classified instances is 96.99 % in Naïve Bayes and 94.56% in J48 algorithm.
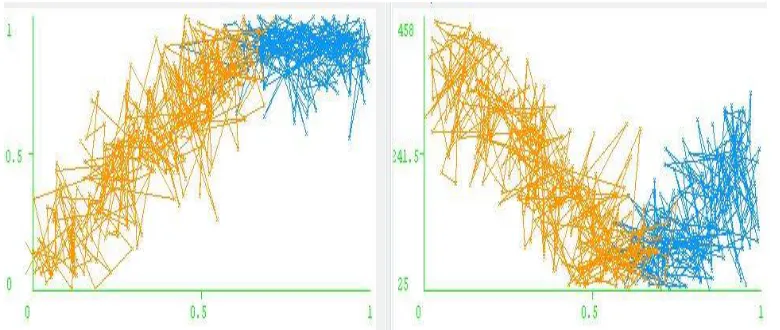
Figure 4. Intensity levels of attributes of Breast Cancer dataset
The above diagram shows that intensity levels of each attribute helps in the prediction of classes benign and malignant. Here the red refers the malignant and blue refers to the benign class, hence we can easily predict that the malignant is less than the benign i.e., each attribute intensity levels are low in malignant. Dataset attributes are main
93 93.5 94 94.5 95 95.5 96 96.5 97 97.5
Naïve Bayes J 48
Vol. 4, Issue 6, June 2016
features to predict the Breast Cancer. The above chart tells that major people fall under the class benign compared to that of malignant. As per work done, the benign class is mainly dependent on few attributes and their intensity levels are taken into consideration to diagnose breast cancer in labs which can give reliable results.
IV.CONCLUSION AND FUTURE WORK
. This paper has outlined a standard approach to identify the attributes and their intensity levels and also extract information related to prediction of breast cancer. This study shows that the results are promising and also shows that data mining techniques can provide great promise in helping us to predict diseases using less number of tests. In this paper, we have used Naïve Bayes and j48 decision trees to achieve good results. This can be further used as a reference by doctors for decision making. In the future, the work shall be extended to improve the basic data mining classification algorithms for finding the intensity level of the attributes of various diseases.
REFERENCES
[1] P.Kasemthaweesaband, W.Kurutach, “Association Analysis of Diabetes Mellitus (DM) With Complication States Based on Association Rules”, 7th IEEE Conference on Industrial Electronics and Applications (ICIEA) 2012.
[2] SarojiniBalakrishnan, RamarajNarayanaswamy, Nickolas Savarimuthu and Rita Samikannu. (2008).SVM Ranking with Backward Search for Feature Selection in Type II Diabetes Databases. IEEE.0 (0), p2628-2633.
[3] R. Karthikeyani, J.Jayaprakash, “Association technique on Prediction of Chronic Diseases using Apriori Algorithm”, International Journal of Innovative Research in Science, Engineering and Technology, Vol. 4, Special Issue 6,May 2015.
[4] Dr. B. Rama, “Experimental Survey on Data Mining Techniques for Association rule mining” titled published in International Journal in Advanced journal in Computer Science and Engineering, Vol 2, issue 4, Feb 2014
[5] Mohammed Abdul Khaleel, Sateesh Kumar Pradhan, G.N. Dash, “Finding Locally Frequent Diseases Using Modified Apriori Algorithm” International Journal of Advanced Research in Computer and Communication Engineering, Vol. 2, Issue 10, October 2013.
[6] Gaganjot Kaur, Amit Chhabra, “Improved J48 Classification Algorithm for the Prediction of Diabetes” Intenational Journal of Computer Applications (0975-8887), Volume 98-No.22,July 2014.
[7] Dr.S.Vijayarani, Mr.S.Dhayanand, “Data Mining Classification Algorithms For Kidney Disease Prediction” International Journal On Cybernetics & Informatics (IJCI) Vol.4, August 2015.
[8] O.L. Mangasarian, W.N. Street and W.H. Wolberg. Breast cancer diagnosis and prognosis via linear programming. Operations Research, 43(4), pages 570-577, July-August 1995.
[9 J. C. Prather, D. F. Lobach, L. K. Goodwin, J. W. Hales , M. L. Hage¸ W. Edward Hammond, “Medical Data Mining: Knowledge Discovery in a Clinical Data Warehouse”, 1997.
[10] Jothi PrabhaA , A. Govardhan, "Identification of Attributes Common for Various Diseases Using Association Analysis ", In International Journal of Computer Systems, Volume 2, Issue 7, July, 2015, pages: 349-354.
BIOGRAPHY