University of Windsor University of Windsor
Scholarship at UWindsor
Scholarship at UWindsor
Electronic Theses and Dissertations Theses, Dissertations, and Major Papers
2011
Developing and applying elemental composition of shark
Developing and applying elemental composition of shark
vertebrae as a tool for quantifying life history characteristics over
vertebrae as a tool for quantifying life history characteristics over
ontogeny
ontogeny
Heather Christiansen University of Windsor
Follow this and additional works at: https://scholar.uwindsor.ca/etd
Recommended Citation Recommended Citation
Christiansen, Heather, "Developing and applying elemental composition of shark vertebrae as a tool for quantifying life history characteristics over ontogeny" (2011). Electronic Theses and Dissertations. 5585.
https://scholar.uwindsor.ca/etd/5585
DEVELOPING AND APPLYING ELEMENTAL COMPOSITION OF SHARK VERTEBRAE AS A TOOL FOR QUANTIFYING LIFE HISTORY
CHARACTERISTICS OVER ONTOGENY
by
Heather M. Christiansen
A Thesis
Submitted to the Faculty of Graduate Studies through Environmental Science
in Partial Fulfillment of the Requirements for the Degree of Master of Science at the
University of Windsor
Windsor, Ontario, Canada
2011
DEVELOPING AND APPLYING ELEMENTAL COMPOSITION OF SHARK VERTEBRAE AS A TOOL FOR QUANTIFYING LIFE HISTORY
CHARACTERISTICS OVER ONTOGENY
by
Heather M. Christiansen
APPROVED BY:
______________________________________________ Dr. Trevor Pitcher, External Program Reader
Department of Biological Sciences
______________________________________________ Dr. Nigel Hussey, Special Member
Great Lakes Institute for Environmental Research
______________________________________________ Dr. Joel Gagnon, Internal Program Reader
Great Lakes Institute for Environmental Research
______________________________________________ Dr. Brian Fryer, Advisor
Great Lakes Institute for Environmental Research
______________________________________________ Dr. Chris Weisener, Chair of Defense
Great Lakes Institute for Environmental Research
iii DECLARATION OF CO-AUTHORSHIP/PREVIOUS PUBLICATION
I. Co-Authorship Declaration
I hereby declare that this thesis incorporates material that is result of joint research, undertaken under the supervision of Dr. Brian Fryer as follows: Chapter 2 contains material from a manuscript entitled “Validating elemental profiles in white shark, Carcharodon carcharias, vertebrae as a marker of size-based habitat-use and migration patterns using Fs-LA-ICP-MS” that has been rejected by PLoS ONE and will be resubmitted to Marine Biology. This manuscript is co-authored by H.M. Christiansen, N.E. Hussey, A.T. Fisk, S.P. Wintner, G. Cliff, S.F.J. Dudley, S.A. Rush, and B.J. Fryer. Chapter 3 contains material from a manuscript entitled “Verifying the age of white sharks, Carcharodon carcharias, using calcium profiles in vertebral centra as determined by Fs-LA-ICP-MS” that will be submitted in the near future. This manuscript is co-authored by H.M. Christiansen, N.E. Hussey, S.P. Wintner, G. Cliff, S.F.J. Dudley, A.T. Fisk, M.A. MacNeil, and B.J. Fryer. In all cases, the key ideas, primary contributions, experimental designs, data analysis and interpretation, were performed by the author, and the contribution of co-authors was primarily through the assistance with data analysis and statistical procedures as well as helping with revising early drafts.
I am aware of the University of Windsor Senate Policy on Authorship and I certify that I have properly acknowledged the contribution of other researchers to my thesis, and have obtained written permission from each of the co-author(s) to include the above material(s) in my thesis. I certify that, with the above qualification, this thesis, and the research to which it refers, is the product of my own work.
II. Declaration of Previous Publication
This thesis includes 2 original papers that have been previously or will submitted for publication in peer-reviewed journals, as follows:
Thesis Chapter
Publication title/full citation Publication status
Chapter 2 Validating elemental profiles in white shark, Carcharodon carcharias, vertebrae as a marker of size-based habitat-use and migration patterns using Fs-LA-ICP-MS
Revised/ to be submitted to Marine Biology
Chapter 3 Verifying the age of white sharks,
Carcharodon carcharias, using calcium
profiles in vertebral centra as determined by Fs-LA-ICP-MS
I certify that I have obtained written permission from the copyright owner(s) to include the above published material(s) in my thesis. I certify that the above material describes work completed during my registration as graduate student at the University of Windsor.
I declare that, to the best of my knowledge, my thesis does not infringe upon anyone’s copyright nor violate any proprietary rights and that any ideas, techniques, quotations, or any other material from the work of other people included in my thesis, published or otherwise, are fully acknowledged in accordance with the standard referencing practices. Furthermore, to the extent that I have included copyrighted material that surpasses the bounds of fair dealing within the meaning of the Canada Copyright Act, I certify that I have obtained a written permission from the copyright owner(s) to include such material(s) in my thesis.
v ABSTRACT
In response to the need for life history data for sharks, the use of femtosecond
laser ablation inductively coupled plasma mass spectrometry (Fs-LA-ICP-MS) was
investigated as a novel method to investigate elemental profiles within white shark
(Carcharodon carcharias) vertebrae. It was determined that (i) a suite of elements are
present within the vertebrae above detection limits and (ii) elements were not reworked
within the vertebral matrix. These elemental profiles are likely reflective of the
individual’s environment and basic information about habitat use, movement, and
migration patterns throughout ontogeny can be determined. Calcium profiles within the
vertebrae were analyzed as an alternative method to age sharks. The ages for Ca-profiles
were ~3 to 4 times higher than previous methods using X-radiography, the growth rate
was greatly decreased and age of maturity was increased 3 to 4 times. Fs-LA-ICP-MS is
DEDICATION
I dedicate this thesis to my parents, Timothy and Theresa McCann; I would not be
where I am today without all your love and support and to my husband, Daniel
vii ACKNOWLEDGEMENTS
I would like to thank my supervisor, Dr. Brian Fryer for his guidance and support
throughout this process. I would also like to thank Dr. Nigel Hussey for his continuous
advice, insights, and feedback. I thank my committee members Dr. Joel Gagnon and Dr.
Trevor Pitcher for their helpful comments and advice. Thank you to Dr. Aaron Fisk for
his guidance throughout this project. I would like to thank Zhaoping Yang and Mohamed
Shaheen for their assistance with the Fs-LA-ICP-MS and Sharon Lackie for her support
and knowledge on the SEM. Thank you also to Alice Grgicak-Mannion for the GIS map
of South Africa. My thanks go to Dr. Lisa Natanson from NOAA for helping with age
estimation. I express my gratitude to the KwaZulu-Natal Shark Board laboratory staff for
undertaking the required sampling. Thank you to M. Naicker and D. McMohan at
KwaZulu-Natal hospital and to L. Lang-Lawrence at CML Healthcare for their assistance
in X-raying the shark vertebrae. Finally, I would like to my officemates for their endless
TABLE OF CONTENTS
DECLARATION OF CO-AUTHORSHIP/PREVIOUS PUBLICATION ... iii
ABSTRACT ...v
DEDICATION ... vi
ACKNOWLEDGEMENTS ... vii
LIST OF TABLES ...x
LIST OF FIGURES ... xii
CHAPTER I. INTRODUCTION 1.1 Introduction ...1
1.2 References ...12
II. VALIDATING ELEMENTAL PROFILES IN WHITE SHARK, CARCHARODON CARCHARIAS, VERTEBRAE AS A MARKER OF SIZE-BASED HABITAT-USE AND MIGRATION PATTERNS USING FS-LA-ICP-MS 2.1 Introduction ...21
2.2 Methods ...24
2.3 Results...31
2.4 Discussion ...33
2.5 References ...41
III. VERIFYING THE AGE OF WHITE SHARKS, CARCHARODON CARCHARIAS, USING CALCIUM PROFILES IN VERTEBRAL CENTRA AS DETERMINED BY FS-LA-ICP-MS 3.1 Introduction ...63
3.2 Methods ...67
3.3 Results...73
3.4 Discussion ...75
3.5 References ...82
IV. CONCLUSIONS AND RECOMMENDATIONS 4.1 Summary ...101
LIST OF TABLES
Chapter 2
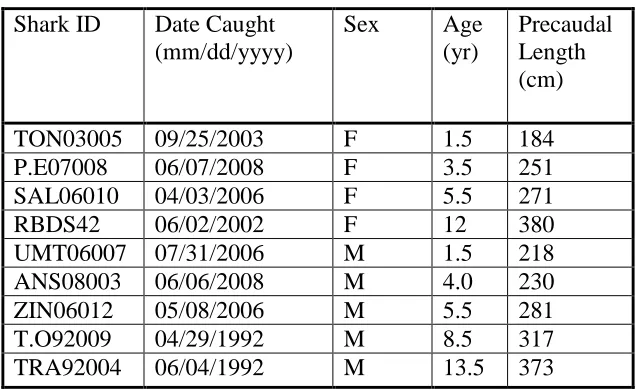
Table 2.1 Date of collection, sex, age and size of the nine white sharks 51
sampled from South Africa and used in the analysis of elemental
profiles across vertebral centra by Fs-LA-ICP-MS.
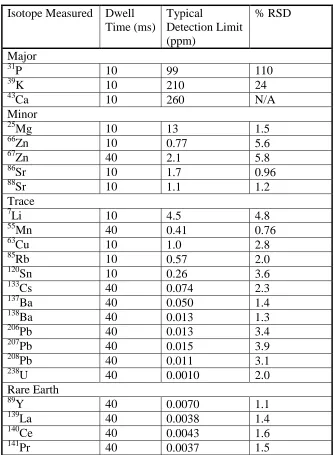
Table 2.2 Isotopes measured in nine white shark vertebral centra with 52
dwell time (time spent analyzing each isotope used in
Fs-LA-ICP-MS analysis) and the mean elemental detection
limit and percent relative standard deviation (RSD) based on the
NIST 610 standard.
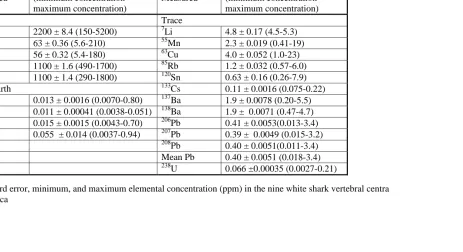
Table 2.3 Mean ± standard error, minimum and maximum elemental 53
concentration (ppm) in the nine white shark vertebral centra
sampled from South Africa
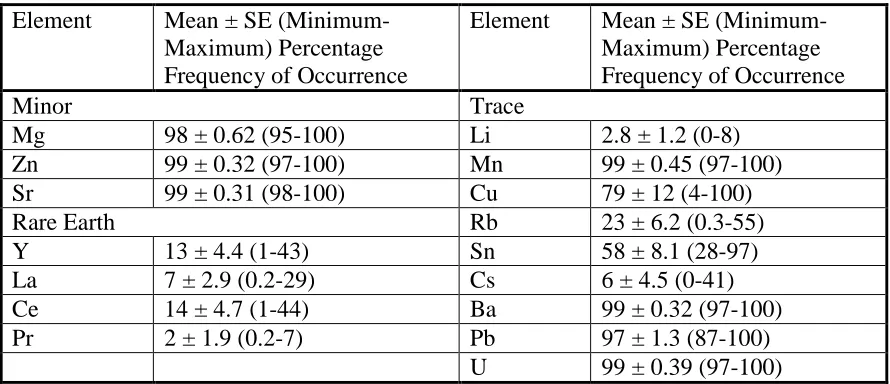
Table 2.4 Mean ± standard error, minimum and maximum element percent 54
frequency of occurrence for nine white shark vertebral centra
sampled from South Africa.
Chapter 3
Table 3.1 Largest immature individual and mature individuals for each 93
sex showing overlap in size and maturity. Ages are shown
determined by the three methods including X-radiography
(X-ray), peaks in calcium profile as determined by readers (Ca-R),
xi Table 3.2 Minimum and maximum age and fork length (FL) as 94
determined by the three methods including X-radiography
(X-ray), peaks in calcium profile as determined by readers
(Ca-R), and peaks in calcium profile as determined by model
(Ca-M). The size for the lowest age female varied with method
and FL for each individual is represented within parenthesis.
Table 3.3 Comparison of Akaike’s Information Criterion (AIC), Bayesian 95
Information Criterion (BIC), mean square error (MSE) and r2 for
each growth function and for the three methods including
X-radiography (X-ray), peaks in calcium profile as determined
by readers (Ca-R), and peaks in calcium profile as determined by
model (Ca-M).
Table 3.4 Growth parameters for all growth models with standard error 96
for each parameter (all measurements are in cm and represent FL)
for each method including X-radiography (X-ray), peaks in
calcium profile as determined by readers (Ca-R), and peaks in
calcium profile as determined by model (Ca-M). L∞represents
maximum theoretical length, k is the rate at which L∞ is reached,
L0 is the size at birth, and n is the sample size.
Table 3.5 Known growth rates of white sharks from previous tag/recapture 97
LIST OF FIGURES
Chapter 2
Figure 2.1 Sample region, black line indicates approximate location of 55
beach protection nets in KwaZulu-Natal. The netted region
is currently comprised of 38 individual net installations (see
Cliff and Dudley 2011 for specific details on locations).
Figure 2.2 Representative picture of bow-tie section from vertebral 56
centra. Line indicates transect ablated by femtosecond
laser ablation inductively coupled plasma mass spectrometry
and common terms used to describe vertebral centra.
Figure 2.3 Combined images from SEM-EDS. Transect across the 57
vertebrae starting at the focus of the corpus calcareum (pre-natal)
extending to the outer edge (i.e. point of death). Boxes indicate
areas of SEM-EDS analysis.
Figure 2.4 Percentage frequency of occurrence of all detected elements 58
across the corpus calcareum of the vertebral centra of six
white sharks. Black dots represent location of element ratio
occurrence (Element: Ca ratio). Elements are listed with percent
frequency of occurrence across the entire vertebrae (excluding
pre-natal region). Elements are ranked from least abundant to
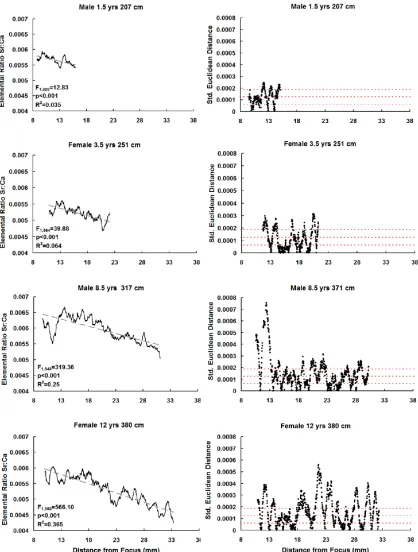
xiii Figure 2.5 Sr: Ca ratio (left graphs) as determined by Fs-LA-ICP-MS 59
for four white sharks. Gray dashed lines indicate least square
linear regression with associated F, R2, and p-values.
Dissimilarity profiles (right graphs) obtained from split moving
window analysis. Dashed lines indicate 1, 2 and 3 times the
standard deviation.
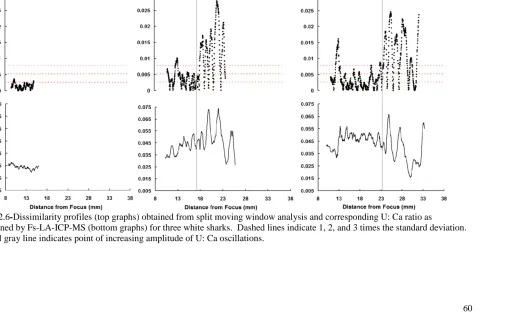
Figure 2.6 Dissimilarity profiles (top graphs) obtained from split moving 60
window analysis and corresponding U: Ca ratio as determined by
Fs-LA-ICP-MS (bottom graphs) for three white sharks. Dashed
lines indicate 1, 2, and 3 times the standard deviation. Vertical
gray line indicates point of increasing amplitude of U: Ca oscillations.
Figure 2.7 Dissimilarity profiles (top graphs) from split moving window 61
analysis and corresponding Pb: Ca ratio as determined by
Fs-LA-ICP-MS (bottom graphs) for three white sharks. Dashed
lines indicate 1, 2, and 3 times the standard deviation. Note
different y-axis scale for each graph (bottom).
Figure 2.8 Dissimilarity profiles (top graphs) from split moving window 62
analysis and corresponding Ba: Ca ratio as determined by
Fs-LA-ICP-MS (bottom graphs) for three white sharks. Dashed
lines indicate 1, 2, and 3 times the standard deviation as determined
above. Gray bars indicate location of opaque (summer) bands and
Chapter 3
Figure 3.1 Calcium profiles as determined by Fs-LA-ICP-MS for three 98
white sharks. Y-axis is normalized calcium concentration. X-axis
is the distance from the focus. A. Female- 139 cm FL B.
Male-232 cm FL C. Female 487cm FL. Black X’s indicate
identified peak; profiles on left are peaks detected by CA-R,
profiles on right are peaks detected by Ca-M
Figure 3.2 Age bias plot of Ca profile identified peaks between Reader 1 99
and Reader 2. Black line indicates one to one line.
Figure 3.3 Optimal growth curves from this study (x-ray-dashed black, 100
Ca-M-solid black, Ca-R long dashed black) along with growth
curves from California (gray line), South Africa (dashed gray line)
and Japan (longer dashed gray line). Black x’s indicate minimum
age for photographically identified individuals from California.
1 CHAPTER I
INTRODUCTION
1.1 Introduction
Currently, populations of elasmobranchs are declining worldwide. This is due to
many factors including fishing, by-catch, habitat destruction and pollution (Fowler et al.
2005). Species that spend periods of their life in the pelagic realm and migrate outside of
Exclusive Economic Zones (EEZ) are especially vulnerable to commercial fishing
operations; 32% of pelagic sharks and rays are listed as threatened on the International
Union for Conservation of Nature (IUCN) Red List (Camhi 2008). Many of these
threatened elasmobranchs are large predators that feed at the top of the food web and are
believed to exert top-down control (Stevens et al. 2000, Ferretti et al. 2010). In addition,
these large species are typically highly mobile (Stevens et al. 2000, Dulvy et al. 2008),
and exert influence over multiple environments within the marine ecosystem, the scale of
the effect being species-, size- and sex-specific (Hussey et al. 2011). Large-scale
removal of these apex predators therefore has serious implications for the structure and
stability of the entire marine food web (Stevens et al. 2000, Frank et al. 2005, Heithaus et
al. 2008).
In response to increased awareness of declining populations of elasmobranch
species, the Food and Agriculture Organization of the United Nations (FAO) developed
an international plan of action for the conservation and management of sharks in 1999.
As a part of this plan it was recommended that individual nations create their own
national plan of action (NPOA). However, since that time few member countries have
management status of sharks worldwide (FAO 2008). It was further recommended that
nations that have not created a NPOA should focus on determining critical life history
information (e.g. age, habitat use, movement and migration patterns) on primary species
of concern, including those on the CITES appendices (FAO 2008).
Determining these key characteristics in large marine predators, particularly
sharks, is often difficult. Habitat usage, movement, and migration patterns of sharks have
primarily been monitored through passive, acoustic and satellite tags. While these tags
provide high resolution data on individual movement and diving patterns, the data
provided is a snapshot of the individual’s life. A recent review by Speed et al. (2010)
highlights the need to quantify long term habitat changes over ontogeny and any changes
associated with sex and size as being vital to aid in conservation and management efforts.
Age determination is the basis for determining growth rates, age at maturity and
life span, which are all important metrics to conservation and management efforts (Cortés
1998). While age determination has been the topic of many studies on sharks and other
elasmobranchs (see reviews by Cailliet and Goldman, (2004), Cailliet et al. (1986),
Cailliet et al., (2006)), the age for few species have been validated. For most species,
there is an annual periodicity to growth ring formation (one opaque band and one
translucent band form per year). Thus the number of growth rings counted represent the
age of the individual. However, annual periodicity must be validated on a species to
species basis and without this validation it is difficult to create an accurate management
strategy for that species.
Given the need to determine key life history characteristics of large pelagic sharks
3 investigated the use of femtosecond laser ablation inductively coupled plasma mass
spectrometry (Fs-LA-ICP-MS) as a tool to analyze elemental profiles within shark
vertebrae. To determine if Fs-LA-ICP-MS is a suitable method to investigate these
characteristics, I determined baseline concentrations on a suite of elements and
investigated any patterns in the elemental profiles within and between individuals.
In order to investigate the relationship between elemental profiles and
environment due to seasonal changes accurate age estimates are required. Additionally,
accurate age estimates are required to investigate habitat use for each life stage. To
verify current age estimates obtained through X-radiography (X-ray) analysis I analyzed
the variation of calcium (Ca) within the vertebral centra across ontogeny.
Biomineralization
In many species, biomineralized structures have helped to elucidate information
on age and key life history characteristics. Biomineralized structures (e.g. fish otoliths,
mollusc shells, corals, and elasmobranch vertebrae) are formed by the incorporation of
elements from the surrounding environment into a growing structure (Weiner and Dove
2003), providing information on a variety of characteristics over ontogeny.
Elemental profiles contained within fish otoliths, a well-studied biomineralized
structure, have been used to identify natal streams, discriminate between stocks,
determine habitat preference, and identify movement patterns over ontogeny (Campana
1999, Elsdon et al. 2008). Several elements have predictable relationships between
environmental concentrations and concentrations within the otoliths, which allow
researchers to elucidate information on these life history characteristics. For example, the
fluctuating salinity within the habitat of the fish (Secor and Rooker 2000). Bath et al.
(2000), determined that elemental uptake in otoliths of spot (Leiostomus xanthurus) were
reflective of the surrounding environment for both strontium and barium. Using the
elemental profiles of potassium, strontium, manganese and barium in American shad
(Alosa sapidissim) otoliths, Thorrold et al. (1998) were able to identify natal streams of
adult fish based on the juvenile portion of the otoliths. While many studies have focused
on the differences between fresh and saltwater environments, Chittaro et al. (2004) were
able to distinguish between mangrove and coral reef habitat for the French grunt
(Haemulon flavolineatum) using the microchemistry of otoliths, showing the utility of
this method at a smaller spatial scale within an entirely marine system. In addition, fish
otoliths, have been used in age determination and validation studies (Pannella 1971,
Campana and Neilson 1985), based upon banding patterns within the otoliths caused by
differences in somatic growth.
Elasmobranch vertebrae: an under-utilized biomineralized structure
Elasmobranch vertebrae are also biomineralized structures, however, unlike fish
otoliths, which are aragonite, vertebrae are composed of hydroxyapatite and are secreted
incrementally (Ridewood 1921, Moss 1977). The vertebrae consist of cartilage, which is
primarily proteoglycans in a meshwork of collagen and mineralized areas (Zhang et al.
2009). For many species, it has been hypothesized that two growth bands (one opaque
and one translucent) combine to form one growth ring (Cailliet and Goldman 2004). It
has been determined for several species, such as gray reef shark (Carcharhinus
amblyrhynchos), common thresher shark (Alopias vulpinus), spiny dogfish (Squalus
5 mineralized and have higher Ca levels, while translucent bands are less mineralized and
have lower Ca levels (Holden and Vince 1973, Jones and Geen 1977, Cailliet and Radtke
1987). It is believed that most species will follow this pattern of mineralization (the
angel shark (Squatina califorinca) being one exception, Natanson and Cailliet (1990)).
Many researchers have attempted to apply the same techniques used in
determining life history characteristics in fish otoliths to elasmobranch vertebrae. While
there are similarities between the two structures there are also key differences in
composition and formation, which may complicate the blanket use of the same technique
applied to fish otoliths in vertebrae. In order to utilize the chemical composition as a
means of determining life history characteristics, several assumptions must be addressed.
First, there must be no reworking of the vertebral centra (i.e. elements are not exchanged
within the system once they have been laid down) and second, the elements contained
within the vertebral centra must be above detection limits of the analytical system and be
reflective of the surrounding environment.
The metabolic stability of the vertebral centra has been questioned to this point.
Campana et al. (2002) determined the organic component of the vertebrae was stable
through the use of bomb radiocarbon dating. However, they did not prove that the
inorganic portion was stable as well. The stability of the inorganic component has been
questioned throughout the literature often with conflicting results. Clement (1992)
provided a literature review and investigated mineralized tissues from five species of
sharks and concluded that vertebral centra grow by apposition without resorption.
Preziosi et al. (2006) investigated four species of sharks in Australian waters with spinal
Several studies however, have found opposite results. Welden et al. (1987) attempted to
use radiometric dating to age four species of elasmobranchs, but the results were
inconclusive, which was attributed to possible reworking of the vertebral centra; a spinal
deformity in a sand tiger shark (Carcharias taurus) was found to have reworking
occurring on five deformed vertebrae (Heupel et al. 1999); evidence of resorption after a
trauma to the vertebrae has also been documented in the school shark (Galeorhinus
galeus) (Officer et al. 1995), at the time of the study there was no reworking occurring
and a portion of the vertebrae that was cracked was found to not have undergone
reworking. This provided evidence that reworking was limited and used to restore
function to the vertebrae. No evidence was found for continued reworking and it was
concluded that it was not a part of normal physiological growth or Ca regulation. Since
there is no conclusive evidence to support or deny reworking, it must be determined
whether reworking is occurring before analyzing the elemental composition of the
vertebral centra.
Elemental composition of vertebral centa
Few studies have analyzed the elemental concentration of whole elasmobranch
vertebrae (Eisler 1984, Vas 1987, Vas et al. 1990). Vas et al. (1990) reported a decrease
in metal concentrations with an increase in size. This conclusion, however, was based on
concentration per total weight of the vertebral centrum. In addition, the vertebral centra
were not serially sampled, and comparisons were made based on differences between
individuals only. These results, therefore, may not truly represent ontogenetic shifts
occurring within individuals and patterns between individuals may be due to differences
7 LA-ICP-MS to investigate the composition of round stingray (Urobatis halleri) vertebrae
throughout ontogeny, they did not relate the elemental profiles to the environment. no
conclusions were made on the relationship between elemental concentrations in the
vertebrae and of the external environment.
Age validation and verification
Age validation has been attempted in many species of sharks through several methods
such as tag/recapture data (Cailliet et al. 1992), chemical marking utilizing
oxytetracycline (OTC) (Holden and Vince 1973, Wintner and Cliff 1999, Skomal and
Natanson 2003, Smith et al. 2003) and using bomb radiocarbon (Campana et al. 2002,
Kerr et al. 2006). Age verification has also been accomplished through the use of X-ray
spectrometry (Jones and Geen 1977) and electron microprobe (Cailliet and Radtke 1987).
Using these techniques there were clear peaks and troughs in both Ca and phosphorus
values. These peaks and valleys coincided with the opaque (peak) and translucent
(troughs) bands, which have enabled researchers to age these animals by counting their
bands. This same principle of Ca and phosphorus peaks occurring in opaque bands and
troughs occurring in translucent bands was the basis of the Hale et al. (2006) study
verifying optically determined ages for round stingrays up to age 5.
Femtosecond Laser Ablation Inductively Coupled Plasma Mass Spectrometry
Several methods such as energy dispersive electron microprobe, wavelength
dispersive electron microprobe and proton induced x-ray emissions can potentially be
used to determine the elemental composition of vertebral centra (Campana et al. 1997).
LA-ICP-MS has been favored over these methods due to its ability to analyze a suite of
thermal and matrix effects and detection limits of elements are decreased, allowing more
elements with lower concentrations to be analyzed (Shaheen et al. 2008). By utilizing
Fs-LA-ICP-MS, I will analyze a continuous transect from the focus (beginning of
development) to the outer edge (end of the individual’s life). The elemental profiles
collected will provide valuable information, which to this point has not been collected at
the individual level.
Study species
White sharks (Carcharodon carcharias) are large marine predators, which are
currently listed as vulnerable on the International Union for Conservation of Nature
(IUCN) Red List and are listed on Convention on International Trade in Endangered
Species of Wild Fauna and Flora (CITES) Appendix II. In addition, white sharks are
protected in coastal waters of Australia, Croatia, European Union, Maldives, Malta,
Mexico, Montenegro, Namibia, New Zealand, South Africa, and the United States of
America (Camhi 2008). Unfortunately, the development of region specific conservation
and management strategies for the white shark is difficult due to a lack of life history data
or more specifically data on geographic-specific life history strategies over ontogeny.
This is due in part to their large size, the scale of the environment they inhabit, the
relatively low encounter rates outside of known aggregation sites and their protected
status.
Much research has been undertaken in recent years to improve our knowledge of
many of these important characteristics of white sharks including data on reproduction
(Francis 1996, Saidi et al. 2005), diet and trophic level (Estrada et al. 2006, Kerr et al.
9 al. 2005, Bruce et al. 2006, Weng et al. 2007). The habitat and migration patterns of
white sharks have been well documented in the eastern Pacific using both photo
identification (Domeier and Nasby-Lucas 2007) and archival tagging studies (Boustany et
al. 2002, Dewar et al. 2004, Weng et al. 2007, Domeier and Nasby-Lucas 2008,
Jorgensen et al. 2010). These studies have determined that white sharks spend several
months in coastal waters, and then make large-scale seasonal migrations to an offshore
region outside the EEZ. Bonfil et al. (2010) found that white sharks from Chatham
Islands, New Zealand behaved similarly to white sharks from the Eastern Pacific ocean,
spending several months around the islands before making directed migrations offshore.
In contrast, white sharks in South Africa and Australia are most active in inshore regions
on the continental shelf with occasional offshore movements including a documented
trans-oceanic migration (Bonfil et al. 2005, Bruce et al. 2006). It is likely that
geographically separated populations of white sharks exhibit different behavioral patterns
and will, therefore, require region-specific management plans. For most regions, it is
unknown at what age offshore migrations occur and at what frequency. In order to create
an accurate and effective management plan for this species, more information about its
basic life history characteristics is needed.
Vertebral centra samples used in this thesis were obtained from incidentally
caught white sharks in beach protection nets off the coast of KwaZulu-Natal, South
Africa. No sharks were sacrificed for this study. Following the KwaZulu-Natal Sharks
Board (KZNSB) tag and release protocols, all live sharks found in the nets were tagged
samples were exported in accordance with the CITES requirements (CITES South
African Permit No. 106627).
Rationale and objectives
Using Fs-LA-ICP-MS and elemental profiles obtained from white shark vertebral
centra, we can investigate whether reworking is occurring based on comparisons of
elemental profiles of individuals of different age, sex and sizes. Furthermore, elemental
profiles can be analyzed to determine if patterns in the profiles exist within individuals
and between individuals. If these patterns exist, we can then begin linking vertebral
profiles to environmental elemental data thereby inferring habitat usage, movement, and
migration of the individual throughout ontogeny.
A more robust method is currently needed to determine if the banding patterns
(opaque and translucent bands being indicative of one year of growth) observed through
X-ray analysis are correct, as ages for white sharks have yet to be validated. Using
Fs-LA-ICP-MS, a continuous transect from the focus to the edge of the vertebral centra is
analyzed providing continuous data throughout ontogeny. There will be one peak and
one trough in the Ca data for each year of growth. By determining the number and
location of peaks and troughs, a second method of verifying opaque and translucent
bands is available. If X-ray analysis is accurate, the number of peaks and troughs in the
Ca profile will correspond to the number of opaque and translucent bands observed,
respectively.
My thesis consists of four objectives as follows to investigate the suitability of
Fs-LA-ICP-MS as a tool to investigate habitat usage, movement, migration, and age of white
11 1. Determine baseline concentration and detection limits on a suite of elements
within the vertebral centra of the white shark using Fs-LA-ICP-MS. (Chapter 2)
2. Investigate the extent of reworking (if any) within the vertebral centra of the
white shark using Fs-LA-ICP-MS and elemental profiles. (Chapter 2)
3. Preliminary investigations relating elemental profiles within vertebral centra to
external environmental characteristics. (Chapter 2)
4. Using normalized Ca data, determine peaks and troughs to verify current aging
techniques in white sharks. (Chapter 3)
1.2 References
Bath, G. E., S. R. Thorrold, C. M. Jones, S. E. Campana, J. W. McLaren, and J. W. H.
Lam. 2000. Strontium and barium uptake in aragonitic otoliths of marine fish.
Geochimica Et Cosmochimica Acta 64:1705-1714.
Bonfil, R., M. P. Francis, C. Duffy, M. J. Manning, and S. O'Brien. 2010. Large-scale
tropical movements and diving behavior of white sharks Carcharodon carcharias
tagged off New Zealand. Aquatic Biology 8:115-123.
Bonfil, R., M. Meyer, M. C. Scholl, R. Johnson, S. O'Brien, H. Oosthuizen, S. Swanson,
D. Kotze, and M. Paterson. 2005. Transoceanic migration, spatial dynamics, and
population linkages of white sharks. Science 310:100-103.
Boustany, A. M., S. F. Davis, P. Pyle, S. D. Anderson, B. J. Le Boeuf, and B. A. Block.
2002. Satellite tagging - Expanded niche for white sharks. Nature 415:35-36.
Bruce, B. D., J. D. Stevens, and H. Malcolm. 2006. Movements and swimming behaviour
of white sharks (Carcharodon carcharias) in Australian waters. Marine Biology
150:161-172.
Cailliet, G. M. and K. J. Goldman. 2004. Age determination and validation in
chondrichthyan fishes. Pages 399-447 in J. C. Carrier, J. A. Musick, and M. R.
Heithaus, editors. Biology of sharks and their relatives. CRC Press, New York.
Cailliet, G. M., H. F. Mollet, G. G. Pittenger, D. Bedford, and L. J. Natanson. 1992.
Growth and demography of the Pacific angel shark (Squatina-californica), based
upon tag returns off California. Australian Journal of Marine and Freshwater
13 Cailliet, G. M. and R. L. Radtke. 1987. A progress report on the electron microprobe
analysis technique for age determination and verification in elasmobranchs.
Pages 359-369 in R. C. Summerfelt and G. E. Hall, editors. The Age and Growth
of Fish. The Iowa State University Press, Ames, Iowa.
Cailliet, G. M., R. L. Radtke, and B. A. Welden. 1986. Elasmobranch age determination
and verification: a review. Pages 345-359 in Indo-Pacific Fish Biology:
Proceedings of the Second International Conference on Indo-Pacific Fishes.
Ichthyological Society of Japan, Tokyo.
Cailliet, G. M., W. D. Smith, H. F. Mollet, and K. J. Goldman. 2006. Age and growth
studies of chondrichthyan fishes: the need for consistency in terminology,
verification, validation, and growth function fitting. Environmental Biology of
Fishes 77:211-228.
Camhi, M. D. 2008. Conservation status of pelagic elasmobranchs. Pages 397-417 in M.
D. Camhi, E. K. Pikitch, and E. A. Babcock, editors. Sharks of the Open Ocean:
Biology, Fisheries and Conservation. Blackwell Publishing, Oxford, U.K.
Campana, S. E. 1999. Chemistry and composition of fish otoliths: pathways, mechanisms
and applications. Marine Ecology-Progress Series 188:263-297.
Campana, S. E., L. J. Natanson, and S. Myklevoll. 2002. Bomb dating and age
determination of large pelagic sharks. Canadian Journal of Fisheries and Aquatic
Sciences 59:450-455.
Campana, S. E. and J. D. Neilson. 1985. Microstructure of fish otoliths. Canadian Journal
Campana, S. E., S. R. Thorrold, C. M. Jones, D. Günther, M. Tubrett, H. Longerich, S.
Jackson, N. M. Halden, J. M. Kalish, P. Piccoli, H. dePontual, H. Troadec, J.
Panfili, D. H. Secor, K. P. Severin, S. H. Sie, R. Thresher, W. J. Teesdale, and J.
L. Campbell. 1997. Comparison of accuracy, precision, and sensitivity in
elemental assays of fish otoliths using the electron microprobe, proton-induced
X-ray emission, and laser ablation inductively coupled plasma mass spectrometry.
Canadian Journal of Fisheries and Aquatic Sciences 54:2068-2079.
Chittaro, P. M., B. J. Fryer, and R. Sale. 2004. Discrimination of French grunts
(Haemulon flavolineatum Desmarest, 1823) from mangrove and coral reef
habitats using otolith microchemistry. Journal of Experimental Marine Biology
and Ecology 308:169-183.
Clement, J. G., R. A. Officer, and E. Dykes. 1992. 3-Dimensional reconstruction of shark
vertebrae- a technique with applications to age and growth studies. Australian
Journal of Marine and Freshwater Research 43:923-933.
Cortés, E. 1998. Demographic analysis as an aid in shark stock assessment and
management. Fisheries Research 39:199-208.
Dewar, H., M. Domeier, and N. Nasby-Lucas. 2004. Insights into young of the year white
shark, Carcharodon carcharias, behavior in the Southern California Bight.
Environmental Biology of Fishes 70:133-143.
Domeier, M. L. and N. Nasby-Lucas. 2007. Annual re-sightings of photographically
identified white sharks (Carcharodon carcharias) at an eastern Pacific
15 Domeier, M. L. and N. Nasby-Lucas. 2008. Migration patterns of white sharks
Carcharodon carcharias tagged at Guadalupe Island, Mexico, and identification
of an eastern Pacific shared offshore foraging area. Marine Ecology-Progress
Series 370:221-237.
Dulvy, N. K., J. K. Baum, S. Clarke, L. J. V. Compagno, E. Cortes, A. Domingo, S.
Fordham, S. Fowler, M. P. Francis, C. Gibson, J. Martinez, J. A. Musick, A.
Soldo, J. D. Stevens, and S. Valenti. 2008. You can swim but you can't hide: the
global status and conservation of oceanic pelagic sharks and rays. Aquatic
Conservation-Marine and Freshwater Ecosystems 18:459-482.
Eisler, R. 1984. Trace-metal changes associated with age of marine vertebrates.
Biological Trace Element Research 6:165-180.
Elsdon, T. S., B. K. Wells, S. E. Campana, B. M. Gillanders, C. M. Jones, K. E. Limburg,
D. H. Secor, S. R. Thorrold, and B. D. Walther. 2008. Otolith chemistry to
describe movements and life history parameters of fishes: Hypotheses,
assumptions, limitations and inferences. Pages 297-330. Oceanography and
Marine Biology: an Annual Review, Vol 46.
Estrada, J. A., A. N. Rice, L. J. Natanson, and G. B. Skomal. 2006. Use of isotopic
analysis of vertebrae in reconstructing ontogenetic feeding ecology in white
sharks. Ecology 87:829-834.
FAO. 2008. Report of the technical workshop on the status, limitations
and opportunities for improving the monitoring of shark fisheries and trade. FAO
Ferretti, F., B. Worm, G. L. Britten, M. R. Heithaus, and H. K. Lotze. 2010. Patterns and
ecosystem consequences of shark declines in the ocean. Ecology Letters
13:1055-1071.
Fowler, S. L., R. D. Cavanagh, M. Camhi, G. H. Burgess, G. M. Cailliet, S. V. Fordham,
C. A. Simpfendorfer, and J. A. Musick. 2005. Sharks, Rays and Chimaeras: The
status of the chondrichthyan fishes. Page 461. IUCN/SSC Shark Specialist Group,
IUCN, Gland, Switzerland and Cambridge, UK.
Francis, M. P. 1996. Observations on a pregnant white shark with a review of
reproductive biology. Pages 157-172 in A. P. Klimley and D. G. Ainley, editors.
Great white sharks: the biology of Carcharodon carcharias. Academic, San
Diego.
Frank, K. T., B. Petrie, J. S. Choi, and W. C. Leggett. 2005. Trophic cascades in a
formerly cod-dominated ecosystem. Science 308:1621-1623.
Hale, L. F., J. V. Dudgeon, A. Z. Mason, and C. G. Lowe. 2006. Elemental signatures in
the vertebral cartilage of the round stingray, Urobatis halleri, from Seal Beach,
California. Environmental Biology of Fishes 77:317-325.
Heithaus, M. R., A. Frid, A. J. Wirsing, and B. Worm. 2008. Predicting ecological
consequences of marine top predator declines. Trends in Ecology & Evolution
23:202-210.
Heupel, M. R., C. A. Simpfendorfer, and M. B. Bennett. 1999. Skeletal deformities in
elasmobranchs from Australian waters. Journal of Fish Biology 54:1111-1115.
Holden, M. J. and M. R. Vince. 1973. Age validation studies on centra of Raja
17 Hussey, N.E, Dudley, S.F.J., McCarthy, I.D., Cliff, G. and Fisk, A.T. (2011) Stable
isotope profiles of large marine predators: viable indicators of trophic position,
diet and movement in sharks? Canadian Journal of Fisheries and Aquatic
Sciences. In press.
Jones, B. C. and G. H. Geen. 1977. Age-determination of an elasmobranch (Squalus
acanthias) by x-ray spectrometry. Journal of the Fisheries Research Board of
Canada 34:44-48.
Jorgensen, S. J., C. A. Reeb, T. K. Chapple, S. Anderson, C. Perle, S. R. Van Sommeran,
C. Fritz-Cope, A. C. Brown, A. P. Klimley, and B. A. Block. 2010. Philopatry and
migration of Pacific white sharks. Proceedings of the Royal Society B-Biological
Sciences 277:679-688.
Kerr, L. A., A. H. Andrews, G. M. Cailliet, T. A. Brown, and K. H. Coale. 2006.
Investigations of Delta C-14, delta C-13, and delta N-15 in vertebrae of white
shark (Carcharodon carcharias) from the eastern North Pacific Ocean.
Environmental Biology of Fishes 77:337-353.
Moss, M. L. 1977. Skeletal Tissues in Sharks. American Zoology 17:335-342.
Natanson, L. J. and G. M. Cailliet. 1990. Vertebral growth zone deposition in Pacific
angel sharks. Copeia 1990(4):1133-1145.
Officer, R. A., J. G. Clement, and D. K. Rowler. 1995. Vertebral deformities in a school
shark, Galeorhinus galeus- circumstantial evidence for endoskeletal resorption.
Journal of Fish Biology 46:85-98.
Pannella, G. 1971. Fish otoliths- daily growth layers and periodical patterns. Science
Preziosi, R., S. Gridelli, P. Borghetti, A. Diana, A. Parmeggiani, M. L. Fioravanti, F.
Marcer, I. Bianchi, M. Walsh, and I. Berzins. 2006. Spinal deformity in a sand
tiger shark, Carcharias taurus Rafinesque: a clinical-pathological study. Journal
of Fish Diseases 29:49-60.
Ridewood, W. G. 1921. On the calcification of the vertebral centra in sharks and rays.
Philosophical Transactions of the Royal Society of London Series B 210:311-407.
Saidi, B., M. N. Bradai, A. Bouain, O. Guelorget, and C. Capape. 2005. Capture of a
pregnant female white shark, Carcharodon carcharias (Lamnidae) in the Gulf of
Gabes (southern Tunisia, Central Mediterranean) with comments on oophagy in
sharks. Cybium 29:303-307.
Secor, D. H. and J. R. Rooker. 2000. Is otolith strontium a useful scalar of life cycles in
estuarine fishes? Fisheries Research 46:359-371.
Shaheen, M., J. E. Gagnon, Z. P. Yang, and B. J. Fryer. 2008. Evaluation of the analytical
performance of femtosecond laser ablation inductively coupled plasma mass
spectrometry at 785 nm with glass reference materials. Journal of Analytical
Atomic Spectrometry 23:1610-1621.
Skomal, G. B. and L. J. Natanson. 2003. Age and growth of the blue shark (Prionace
glauca) in the North Atlantic Ocean. Fishery Bulletin 101:627-639.
Smith, S. E., R. A. Mitchell, and D. Fuller. 2003. Age-validation of a leopard shark
(Triakis semifasciata) recaptured after 20 years. Fishery Bulletin 101:194-198.
Speed, C. W., I. C. Field, M. G. Meekan, and C. J. A. Bradshaw. 2010. Complexities of
coastal shark movements and their implications for management. Marine
19 Stevens, J. D., R. Bonfil, N. K. Dulvy, and P. A. Walker. 2000. The effects of fishing on
sharks, rays, and chimaeras (chondrichthyans), and the implications for marine
ecosystems. ICES Journal of Marine Science 57:476-494.
Thorrold, S. R., C. M. Jones, S. E. Campana, J. W. McLaren, and J. W. H. Lam. 1998.
Trace element signatures in otoliths record natal river of juvenile American shad
(Alosa sapidissima). Limnology and Oceanography 43:1826-1835.
Vas, P. 1987. Observations on trace-metal concentrations in a carcharhinid shark,
Galeorhinus galeus, from Liverpool Bay. Marine Pollution Bulletin 18:193-194.
Vas, P., J. D. Stevens, G. A. Bonwick, and O. A. Tizini. 1990. Cd, Mn, and Zn
concentrations in vertebrae of blue shark and shortfin mako in Australian coastal
waters. Marine Pollution Bulletin 21:203-206.
Weiner, S. and P. M. Dove. 2003. An overview of biomineralization processes and the
problem of the vital effect. Reviews in Mineralogy and Geochemistry 54:1-29.
Welden, B. A., G. A. Cailliet, and A. R. Flegal. 1987. Comparison of radiometric with
vertebral band age estimates in four California elasmobranchs. Pages 301-315 in
R. C. Summerfelt and G. E. Hall, editors. The age and growth of fish. Iowa State
University Press, Iowa.
Weng, K. C., A. M. Boustany, P. Pyle, S. D. Anderson, A. Brown, and B. A. Block.
2007. Migration and habitat of white sharks (Carcharodon carcharias) in the
eastern Pacific Ocean. Marine Biology 152:877-894.
Wintner, S. P. and G. Cliff. 1999. Age and growth determination of the white shark,
Carcharodon carcharias, from the east coast of South Africa. Fishery Bulletin
Zhang, G. J., B. F. Eames, and M. J. Cohn. 2009. Evolution of vertebrate cartilage
This manuscript is co-authored by H.M. Christiansen, N.E. Hussey, A.T. Fisk, S.P. 21 Wintner, G. Cliff, S.F.J. Dudley, S.A. Rush and B.J. Fryer
CHAPTER II
VALIDATING ELEMENTAL PROFILES IN WHITE SHARK, CARCHARODON
CARCHARIAS, VERTEBRAE AS A MARKER OF SIZE-BASED HABITAT-USE
AND MIGRATION PATTERNS USING FS-LA-ICP-MS
2.1 Introduction
There is considerable concern over the status of global shark populations, but
incomplete life history data for many species complicates the formulation of effective
management options (Ellis et al. 2005, Dulvy et al. 2008). In response to documented
declines in regional shark populations (Stevens et al. 2000, Dulvy et al. 2008), the Food
and Agriculture Organization of the United Nations (FAO) recommended that individual
nations focus on determining critical life history information for species of concern (FAO
2008).
Knowledge of habitat use, movement and migration patterns of sharks are key
parameters required for developing both regional and global management and
conservation plans (Kinney and Simpfendorfer 2009, Knip et al. 2010, Speed et al. 2010).
To date, standard tag-recapture programs (Kohler and Turner 2001, Hussey et al. 2009),
acoustic (Holland et al. 1999, Heupel and Hueter 2001) and satellite tags (Eckert and
Stewart 2001, Boustany et al. 2002) have been used with varying degrees of success to
determine these parameters. While the more technologically advanced tags provide
high-resolution data on individual movement and diving patterns, this method is often labor
intensive, expensive, and restricted in deployment time (typically 6 to 12 months). New
methodological approaches are, therefore, required to elucidate information on
species-specific habitat and movement profiles of individual animals over ontogeny (Speed et al.
Long-term changes in habitat use, movement, and migration patterns have been
monitored in aquatic species through the use of elemental profiles conserved in
biomineralized structures. Similarly, the elemental profiles conserved in shark vertebral
centra may provide unique tools to assess these parameters. Biomineralization is the
process whereby elements from the surrounding environment are incorporated into the
hard structures of an organism (e.g., fish otoliths, mollusc shells, statoliths), establishing
an elemental history throughout ontogeny (Weiner and Dove 2003). Profiles of a number
of elements in fish otoliths have been widely used to identify natal streams for adult fish,
habitat preference, stock discrimination, connectivity between sub-populations,
movement patterns over ontogeny and to validate pre-existing aging techniques (see
reviews by (Campana 1999, Elsdon et al. 2008)). Experimental work has determined that
the uptake of both strontium (Sr) and barium (Ba) in fish otoliths reflect that of the fish’s
environment (Bath et al. 2000). Thus, the strontium: calcium (Sr:Ca) concentration ratio
profile within fish otoliths can serve as an indicator of fluctuating salinity and water
temperature conditions (see reviews by (Secor and Rooker 2000, Martin et al. 2004,
Brown and Severin 2009)). This method has also been shown to be effective at
discriminating habitat at a range of spatial scales within entirely marine systems (Chittaro
et al. 2004, Hamer et al. 2006).
To validate the use of elemental profiles within the vertebral centra of sharks as a
tool for assessing habitat use, movement, and migration patterns, it is necessary to first
establish that the vertebral centra matrix, and the associated elements, is stable.
Essentially, there needs to be validation that there is no reworking or exchange of Ca and
23 inorganic portion of shark vertebrae was reworked based on the inability of the 210Pb:
210
Po isotopes to age four shark species, Campana et al. (2002) determined that the
organic component of the vertebral centra was stable based on ∆14C profiles.
To date, few studies have utilized the elements contained in the calcified cartilage
of elasmobranchs to investigate life history characteristics. In a preliminary study,
Edmonds et al. (1996) were able to differentiate regional gummy shark (Mustelus
antarcticus) populations in south-western Australia using the elemental composition of
jaw cartilage. More recently, in an effort to validate the counting of growth rings
(opaque and translucent bands) as an accurate method of aging, Hale et al. (2006)
examined the incremental chemistry of elasmobranch vertebral centra utilizing laser
ablation inductively coupled plasma mass spectrometry (LA-ICP-MS). Results indicated
that Ca peaks within the vertebral centra were closely correlated with the opaque bands,
which are formed during periods of high mineralization (summer).
Several analytical methods are available to determine the elemental profiles in
biomineralized structures. LA-ICP-MS is favored over most methods such as energy
dispersive electron microprobe, wavelength dispersive electron microprobe, and proton
induced X-ray emission, for its ability to be effective at analyzing a suite of elements
over small spatial scales with good precision (Campana et al. 1997). Additionally, by
using the newly available femtosecond laser ablation inductively coupled plasma mass
spectrometry (Fs-LA-ICP-MS), analyses are less matrix dependant, as finer particle sizes
are generated with minimal thermal effects (Shaheen et al. 2008). These conditions
decrease the required detection limits of elements, enabling previously undetected
To determine if the vertebral centra matrix and associated elements are stable and
to assess the utility of Fs-LA-ICP-MS in determining elemental profiles in shark vertebral
centra, we examined nine white sharks (Carcharodon carcharias) (5 male and 4 female)
ranging in size from 184 to 380 cm precaudal length (PCL) sampled from
KwaZulu-Natal, South Africa. The white shark is an apex predator (McCosker 1985) currently
listed as vulnerable on the International Union for Conservation of Nature (IUCN) Red
List (IUCN 2011) and in Convention on International Trade in Endangered Species of
Wild Fauna and Flora (CITES) Appendix II. The aim of this study was two-fold, (i) to
establish baseline data on a suite of elements measurable within shark vertebral centra
and their associated detection limits using Fs-LA-ICP-MS, and (ii) to determine the
extent of reworking (if any) by examining and comparing elemental concentration and
deposition patterns across ontogeny and between individuals of different sizes. We
hypothesize: i) that patterns of elements across the vertebral centra of the sharks will vary
between different elements; and ii) that elemental patterns in the vertebral centra of small
(juvenile) sharks will be conserved in the juvenile portion of the vertebral centra from
larger individuals, confirming that reworking of vertebral material is not taking place.
2.2 Methods
Vertebrae preparation and aging
Vertebral centra were obtained from white sharks incidentally caught in beach
protection nets along the coast of KwaZulu-Natal between 1992 and 2008 (Figure 2.1).
All white sharks sampled were found deceased on capture in the nets and no sharks were
sacrificed for this study. All live net-caught white sharks are tagged and released
25 information on the netting operation see Cliff and Dudley (2011). Permission to use white
shark vertebral centra samples was granted by the KwaZulu-Natal Sharks Board and
samples were exported in strict accordance with the CITES requirements (CITES South
African Permit No. 106627). On arrival at the KwaZulu-Natal Sharks Board laboratory,
shark mortalities were sexed and PCL and maturity were recorded. PCL was measured
as the straight-line distance from the tip of the snout to the precaudal notch as defined by
Cliff et al. (1988). Maturity was assessed based on criteria described by Bass et al.
(1973). Vertebral centra were excised anterior to the first dorsal fin from five males and
four females and immediately stored frozen (Table 2.1). Prior to analysis, samples were
cleaned of excess tissue and the following measurements were taken: dorsal diameter,
lateral diameter, and vertebral depth (Wintner and Cliff 1999). X-radiographs were then
taken of the whole centra, in a horizontal plane, using a Philips Optimus Bucky Diagnost
TH X-ray unit. The CR cassettes used were Kodak Directview CR with Kodak GP
Storage Phosphor screens. The CR reader used was a Kodak Directview CR975. Ages
were determined by counting band pairs (consisting of one opaque and one translucent
band). To determine individual band widths, measurements from the focus (mid-point of
the notochordal remnant) to the birth mark and to the edge of each opaque and
translucent band were made on the X-ray images using Image-Pro Discovery (version
4.5.1.29 © 2002). Pixel measurements were then converted to millimeter measurements
using the above-defined measurements of each vertebral centrum.
Vertebral centra were oven dried for 48 hrs at 40°C and 0.6 mm thick bow-tie
sections (Figure 2.2) were cut from each vertebral centra (corresponding to where X-ray
Ontario, Canada). The corpus calcareum was then separated from the intermedialia using
a rotary cutter, after which no metal instruments were used to reduce risk of
contamination. Each sample was sonicated in Milli-Q water for 20 minutes and dried for
24 hours in a class 100 laminar flow hood. After drying, each sample was fixed to a
microscope slide, using Crystal Bond 509, and stored in a covered petri dish.
Preliminary calcium study
When using LA-ICP-MS, an internal standard is required to correct for sampling
rate and to enable the calculation of element concentrations along the transect of ablated
material (Longerich et al. 1996). To determine the variation in calcium (Ca) present in
white shark vertebral centra, and to identify if Ca could be used as a reliable internal
standard, two preliminary investigations were undertaken; (i) the corpus calcareum from
one vertebral centrum was analyzed by scanning electron microscope with energy
dispersive spectroscopy (SEM-EDS). SEM-EDS measurements were made in 12 box
sections along a line scan from the inner edge (focus) to the outer edge of the corpus
calcareum (Figure 2.3) and; (ii) Powdered samples were hand drilled from predetermined
opaque and translucent bands (by X-ray analysis) for age 1 (3 samples for each band),
age 5 (2 samples for each band) and age 13 (1 sample each for each band) had Ca
concentrations determined by inductively coupled plasma optical emission spectroscopy
(ICP-OES). An analysis of variance (ANOVA) was performed to determine if there was
a statistical difference in Ca concentrations between opaque and translucent bands. The
mean Ca concentration in the corpus calcareum of white shark vertebral centra derived
from these two methods was used as the internal standard for Fs-LA-ICP-MS analysis
27
Elemental analysis
The elemental concentrations of each corpus calcareum were analyzed using
Fs-LA-ICP-MS at the Great Lakes Institute for Environmental Research, University of
Windsor. This system utilizes a Quantronix Integra C® femtosecond laser with a Ti:
sapphire laser based on the Chirped Pulse Amplification technique for sampling. The
ablated material was carried to the Thermo Electron X7-II ICP-MS® by argon (Ar) gas.
The laser instrumental conditions were as follows: repetition rate 100 Hz; energy 0.2
mJ/pulse; pin hole diameter 2.5mm; and laser ablation spot size 20µm. For further details
of the analytical system see Shaheen et al. (2008)
To calibrate the instrument and to correct for drift, two analyses of a trace
element-doped glass standard (National Institute of Standards and Technology, NIST
610) were run before and after each sample set. Each sample was pre-ablated over the
complete sampling transect with the laser to remove any residual surface contamination.
Data acquisition consisted of a 60 s gas background followed by sample ablation (2800s
to 5500s). To obtain background-corrected signals, the acquired background analyte
mean intensity (counts s-1) of the gas blank was subtracted from the sample analyte signal
intensity (counts s-1) obtained during ablation of the sample. The center of the corpus
calcareum was ablated in a continuous transect on an automated microscope stage that
moved at constant speeds of 4.3 to 7.1µm s-1, depending on the orientation of the sample.
In total, nineteen elements (twenty-four separate isotopes) including lithium (Li),
magnesium (Mg), phosphorus (P), potassium (K), calcium (Ca) manganese (Mn), copper
(Cu), zinc (Zn), rubidium (Rb), strontium (Sr), yttrium (Y), tin (Sn), cesium (Cs), barium
analyzed by Fs-LA-ICP-MS (Table 2.2). These elements were selected because they
have previously been used as chemical tracers for determining movement and habitat
(e.g. Sr and Ba) or are monoisotopic and have extremely low detection limits (e.g. Y, Cs,
Pr). As this study constitutes the first attempt, to our knowledge, to document trace
element concentrations in white shark vertebral centra over ontogeny using
Fs-LA-ICP-MS, we did not wish to eliminate any potentially useful markers. To account for the
natural variation in isotopic abundances, concentrations of the three lead isotopes (206Pb,
207
Pb, and 208Pb) were averaged. Precision was determined by percent relative standard
deviation (%RSD) as based on the NIST 610 (Table 2.2). Elements were considered
above detection limits if they were more than 3σ above the gas blank (Longerich et al.
1996).
Raw data were processed using Plasma Lab® software and in-house written
macros for Microsoft® Excel® to integrate data and standardize elemental counts to
internal standards. Every 683 ms, a sample cycle (consisting of measurements of all 24
isotopes) was completed, and five of these sampling cycles were integrated to provide an
elemental profile. Each data point, therefore, represents the average composition of the
corpus calcareum over a length of 14.7 to 24.2 µm (depending on the microscope stage
scanning speed). To account for variation in the performance of the laser and the
ICP-MS, each elemental concentration is presented as a ratio to calcium (herein referred to as
element: Ca ratio) (43Ca was measured as the internal standard) (Campana et al. 1997).
Outliers were removed using the interquartile range method whereas any data points
greater than three times the interquartile range were removed (Tukey 1977). To reduce
29 period (i.e. developing embryo stage, as indicated by any data points prior to the angle
change) were also discarded. Data were smoothed using a 25-point running average and
the mean, minimum, and maximum elemental concentrations for the nine sharks (using
the mean Ca concentration of 16.9%) were calculated for each isotope measured (Table
2.3).
Statistical analysis
Percentage frequency of occurrence (%Fo) for each element and per shark was
determined as the presence of a detectable signal at each sampling point across the length
of the corpus calcareum and was calculated as:
%Fo= Ei x 100 1.
ET
where Ei is the number of times the individual element was above detection limit across
the corpus calcareum and ET is the total number of data points sampled for the individual.
Several elements (Sr, Ba, Pb, and U) had high percentage frequency of occurrence
and were further analyzed to examine the oscillation patterns, consisting of high points
(peaks), low points (troughs), and the straight line distance between these two values
(amplitude) of individual elements throughout ontogeny and between different sized
individuals. Considering the documented relationship between temperature and Sr
incorporation rates in other biomineralized structures, and that white sharks, (i) spend
proportionally more time off-shore (Bonfil et al. 2005, Weng et al. 2007) and (ii) begin
deeper dive profiles with increasing size (Bonfil et al. 2005, Weng et al. 2007, Bonfil et
al. 2010), we examined the change in the Sr:Ca profile using least squares linear
To determine if statistically significant changes in elemental profiles occurred in
each vertebral centrum, a split moving window analysis (SMW) was conducted for each
element profile in R (R Core Development Team 2010). Following Cornelius and
Reynolds (1991), a window of one hundred data points was placed at the beginning of
each data series. The window was then split into two halves and the element profile was
averaged for each half. The windows were then shifted by one data point, and the
analysis was repeated until the end of the dataset was reached creating an elemental
dissimilarity profile for each shark (SMW dissimilarity profile). To compare averages
obtained along the element profiles, the Euclidean distance between the two halves was
calculated. To determine the statistical significance of any peaks in the resulting SMW
dissimilarity profiles, signifying dissimilarities between the window halves, a Monte
Carlo simulation was used. The Monte Carlo simulation consisted of randomizing the
position of each data vector along the series and calculating the SMW dissimilarity
profile. Each randomization was repeated 1000 times and a mean dissimilarity was
calculated for each window mid-point position. The variance of each element profile was
determined by calculating a weighted expected mean across all nine sharks and
comparing it to the mean value obtained from the Monte Carlo simulations. These
variance estimates were then pooled across all sharks and values of 1, 2, and 3 times the
pooled standard deviation were used to determine significance of the SMW dissimilarity
profiles. The SMW dissimilarity profiles obtained for the Ba:Ca ratios were then
compared to the seasonal band data to determine if significant changes coincided with
31 2.3 Results
Preliminary calcium analysis
The percentage of Ca in the corpus calcareum as determined by SEM-EDS ranged
from 14 to 21% with a mean of 17.5 ± 0.65 (mean ± SE). The Ca percentage determined
by ICP-OES in vertebral centra varied from 9.3 to 25% in opaque bands and from 5.5 to
20% in translucent bands. An ANOVA including age as a random factor found no
significant difference in Ca concentrations between opaque and translucent bands (Band:
F1, 6 = 0.08, p = 0.82; Age: F1, 6 = 0.01, p = 0.94 and Band-age interaction: F1, 6 = 1.94, p =
0.21). A mean concentration Ca (as determined by the two methods) of 16.9% was used
as the internal standard for Fs-LA-ICP-MS calculations.
Elemental analysis
Nineteen elements including major (P, K, Ca), minor (Mg, Zn, Sr), trace (Li, Mn,
Cu, Rb, Sn, Cs, Ba, Pb, U), and rare earth elements (Y, La, Ce, Pr) were detected within
the corpus calcareum of the white shark vertebral centra. The %RSD for the NIST 610
standard was determined to be acceptable (below 10%) for all elements except P and K
(they have exceedingly high background levels); these elements were therefore excluded
from further analysis (Table 2.2). The 16 elements with acceptable %RSD were also
above detection limits for our analytical conditions and the Fs-LA-ICP-MS system (Table
2.3). Element concentrations for all 9 individuals tested were variable, ranging from a
maximum of 2200 ± 8.4 ppm for Mg to a minimum of 0.011 ± 0.00041 ppm for La
(Table 2.3).
The percentage frequency of occurrence of each element varied between
elemental occurrence was greater than 95% in all individuals of different sizes, while the
occurrence of Cu, Rb, Y, Sn, Cs, and Ce were more variable (Figure 2.4). For less
abundant elements (Cu, Rb, Y, Sn, Cs, and Ce), the percentage frequency of occurrence
varied between individuals in terms of both total abundance and the location of
occurrence (Figure 2.4).
There was a significant negative linear relationship between the Sr:Ca ratio and
distance from the focus of the vertebral centrum (as a proxy for animal size) (Figure 2.5).
The Sr:Ca ratio variability that was explained by the regression increased with increasing
size of animal (Figure 2.5). In addition to the negative linear Sr:Ca ratio relationship;
SMW dissimilarity profiles for each individual shark showed there were also significant
oscillations occurring throughout ontogeny.
The U:Ca ratio and SMW dissimilarity profiles followed oscillatory patterns and
had statistically significant peaks and troughs throughout ontogeny for all individuals, but
the amplitude and level of significance of these oscillations increased beyond
approximately 18 to 23mm from the focus of the vertebral centrum (equating to ~200cm
PCL) (Figure 2.6). While there was intra-individual variation in the actual U:Ca ratio,
the above pattern was conserved between individuals of different sizes, i.e. the U:Ca ratio
patterns in small (juvenile) animals were the same in the juvenile section of large animals
(Figure 2.6).
The Pb:Ca ratio also followed an oscillatory pattern, however, no systematic
pattern was observed between individuals by size, sex or season (Figure 2.7). The Pb:Ca
SMW dissimilarity profile showed varying levels of statistical significance between