DEVELOPMENT OF EVALUATION METHOD FOR SEISMIC
ISOLATION SYSTEMS OF NUCLEAR POWER FACILITIES
- SEISMIC FRAGILITY EVALUATION OF EQUIPMENT-
Ryusuke Haraguchi1, Kunihiko Sato2, Yutaka Suzuki3, Masakazu Jimbo4, Takashi Ueki5, Tetsuo Imaoka6 and Shigenobu Onishi7
1 Deputy Manager, Structural & Seismic Engineering Section, Nuclear Plant Designing Department,
Nuclear Energy Systems Division, Energy & Environment, Mitsubishi Heavy Industries, Ltd., Japan
2 Chief Engineer, Nuclear Plant Designing Department, Nuclear Energy Systems Division, Energy &
Environment, Mitsubishi Heavy Industries, Ltd., Japan
3 Chief Manager, Piping Structural Design Group, Structural Safety Engineering Department, Plant
Development Promotive Division, MHI Nuclear Engineering Company, Ltd., Japan
4 Chief Specialist, Aseismic & Structure Technology Group, Plant Design & Engineering Dept., Isogo
Nuclear Engineering Center, Toshiba Corporation Power Systems Company, Japan
5
Senior Specialist, Aseismic & Structure Technology Group, Plant Design & Engineering Dept., Isogo Nuclear Engineering Center, Toshiba Corporation Power Systems Company, Japan
6
Senior Engineer , Aseismic Engineering Sec., Nuclear Plant Engineering Dept., Hitachi-GE Nuclear Energy, Ltd, Japan
7
Manager, Design & Engineering Group, Nuclear Power Dept., Nuclear Power Div., Chubu Electric Power Co. Inc., Japan
ABSTRACT
This paper provides a part of series of “Development of Evaluation Method For Seismic Isolation Systems of Nuclear Power Facilities”. This part describes the seismic fragility evaluation for equipment of the seismic isolated plants.
In order to respond the regulatory requirement of residual risk evaluation, a research on residual risk evaluation of the seismic isolated plants is proceeding as a part of the Japan national project of seismic isolation. As efforts for this research, realistic capacities of seismic isolators are studied by braking tests of full-scale seismic isolation systems and of crossover piping are studied by shaking tests of scaled model and static tests by simultaneous loads of in-plane and out-of-plane. Fragilities of the seismic isolators and crossover piping are evaluated based on the results of these studies.
Seismic response characteristics of the seismic isolated buildings show strong non-linearity and large displacement because of the vibration characteristic of the seismic isolation system. Therefore, response characteristics specific to the seismic isolated buildings such as non-linear response and relative displacement between isolated building and non-isolated building shall be considered in the fragility evaluation methodology for equipment of the seismic isolated plants.
This paper focuses on the seismic fragility evaluation of equipment of the seismic isolated plants considering the relative displacement and non-linear response of the buildings. Representative equipment of isolated plants are selected and fragility evaluations of the equipment are performed based on the results of the response analysis of buildings and crossover piping.
Result of seismic PRA using fragility values obtained in this study is reported in other part of this series of papers.
METHODOLOGY OF FRAGILITY EVALUATION
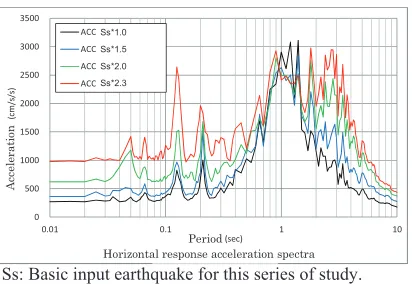
nonlinearity of response. Figure 1 shows an example of floor response spectra of a seismic isolated building with gradually increased seismic input.
In order to cope with this nonlinear characteristic of the seismic isolation, a methodology to obtain a fragility curve of a SSC by using the least square approximation from plots of failure probabilities at some input seismic acceleration level is considered.
0 500 1000 1500 2000 2500 3000 3500
0.01 0.1 1 10
ຍ ㏿ ᗘ (c m /s /s ) ࿘ᮇ(sec) Ỉᖹຍ㏿ᗘᛂ⟅䝇䝨䜽䝖䝹
ACC!0XM_10!H!!1001
ACC!0XM_15!H!!1001
ACC!0XM_20!H!!1001
ACC!0XM_23!H!!1001
Horizontal response acceleration spectra Period A cc e le ra ti o n Ss*1.0 Ss*1.5 Ss*2.0 Ss*2.3
Figure 1. Example of floor response of the isolated building
Failure probability F(A) for an input seismic motion A is calculated by formula (1) as a conditional failure
probability of the realistic response fR(A, x) exceeding the realistic capacity fS(x).
!
"!
#
$
%
&
'
(
)
0
(
,
)
0(
)
)
(
A
f
RA
x
R xf
Sx
dx
dx
RF
R(1)
The realistic response fR(A, x) is represented as a log normal distribution with median Rm(A) and
logarithmic standard deviation !R(A), as the following formula.
* +
* +
,
,
-,
,
.
/
,
,
0
,
,
1
2
#
#
#
#
#
$
%
&
&
&
&
&
'
(
##
$
%
&&
'
(
3
4
)
2)
(
ln
2
1
exp
2
1
)
,
(
A
A
R
x
x
A
x
A
f
R m R R5
5
6
(2)
The realistic capacity fS(x) is represented as a log normal distribution with median Sm and logarithmic
standard deviation !S, as the following formula.
,
,
-,
,
.
/
,
,
0
,
,
1
2
#
#
#
#
#
$
%
&
&
&
&
&
'
(
##
$
%
&&
'
(
3
4
)
2ln
2
1
exp
2
1
)
(
S m S SS
x
x
x
f
5
5
6
(3)
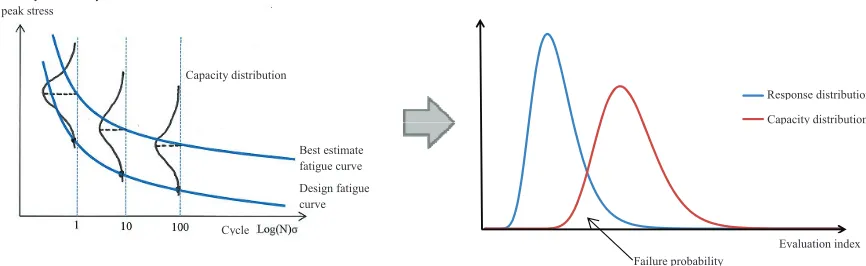
In the case of evaluations for components, median and logarithmic standard deviation of their realistic capacity and realistic response can be determined based on their material properties, various test results, parameter study of structure response analysis, etc. However, in the case of crossover piping between
buildings, fatigue failure will be critical for failure of the piping, not primary stress as in other components. Therefore, unlike the conventional method, the realistic capacity needs to be evaluated based on the fatigue curve of piping. To evaluate the realistic capacity distribution of the crossover piping, a methodology whereby the realistic capacity distribution is obtained by assuming that the best estimate fatigue curve and design fatigue curve are correspond to median and lower limit respectively is constructed, as shown in Figure 2.
Figure 2. Piping fragility considering fatigue failure
The methodology to create a fragility curve for failure probabilities which are discretely obtained by the process shown above is shown as follows.
The mean fragility curve is represented by the following formula.
7 7 7 7
8 9
: : : :
; <
# $ % & ' ( = )
c f
Am a
P
5
ln
(4)
Where,
! Pf: Failure probability
! !: Standardized cumulative normal distribution function
! a: Input acceleration
! Am: Median capacity
! !c: Combined logarithmic standard deviation
! !R: Logarithmic standard deviation for randomness
! !U: Logarithmic standard deviation for uncertainty
The inverse function of formula (4) is shown as follows.
* +
P* +
a* +
Amc c
f ln
1 ln
1
1 4
## $ % && ' ( 3 4
## $ % && ' ( ) =3
5
5
(5)
This formula represents a straight line with the inclination of 1/!c and the intercept of -(1/!c)ln(Am).
Therefore, the inclination of 1/!c and the intercept of -(1/!c)ln(Am) can be obtained from an straight line
created by the least square approximation of plots of !-1(Pf) and ln(a) which are calculated from failure
probability (Pf) at input acceleration a. Consequently, !c and Am are calculated from 1/!c and
- (1/!c)ln(Am).
ᛂ⟅ ⪏ຊ
ホ౯ᣦᶆ ☜⋡
ᦆയ☜⋡ Primary + secondary +
peak stress
Capacity distribution
Best estimate fatigue curve
Design fatigue curve
Cycle
Evaluation index Response distribution
Capacity distribution
Failure probability
# $ % &
'
( ) 2> 2
U R
c 5 5
CROSSOVER PIPING
Fragilities of crossover piping between an isolated building and a non-isolated building are evaluated using realistic response distributions which are obtained as the results of parameter study of structure analysis considering variation of factors which are sensitive to the structure response and some cases of input seismic motion.
Piping
(1)Piping fatigue evaluation
In general, piping elbow is considered to be most critical part for the fatigue failure of the crossover piping. Therefore, in this section, evaluation for the piping elbow is focused on.
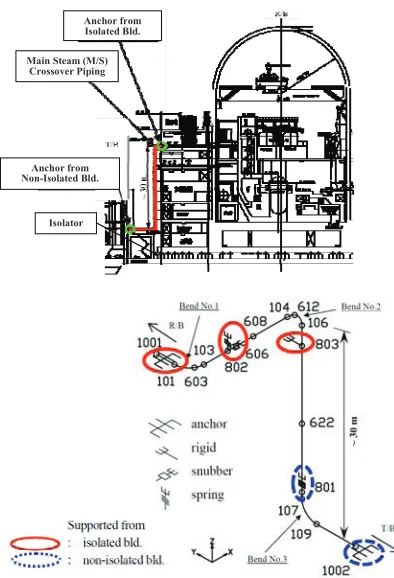
Evaluation for Main Steam (MS) crossover piping between isolated reactor building and non-isolated turbine building of PWR is shown here as a representative of the crossover piping. Analysis model schematic of the MS crossover piping is shown in Figure 3. Eight basic cases are specified considering combination of variation of three sensitive factors of the building isolator, i.e. horizontal rigidity of laminated rubber, initial rigidity of lead plug and yield shearing strength of lead plug. Response analysis for these eight basic cases are conducted at input seismic motions of Ss (basic input earthquake for this series of study) multiplied by factor "h ("h = 1 " 2.3).
Fatigue evaluation of parts of the MS crossover piping is conducted by multiple input analyses with input of time history waves whose parameters are varied as mentioned above. Analysis region of the MS crossover piping is between anchor points which are respectively placed on the isolated building and non-isolated building. Applied analysis code is ABAQUS.
Results of the fatigue analysis are shown in Figure 4. Blue line and red line in Figure 4 show, respectively, ASME design fatigue curve and NUPEC prediction fatigue curve based on the test of ultimate piping strength.
Anchor from Non-Isolated Bld.
Main Steam (M/S) Crossover Piping
Isolator Anchor from Isolated Bld.
Figure 3. Analysis model of MS crossover piping
(2) Fragility evaluation
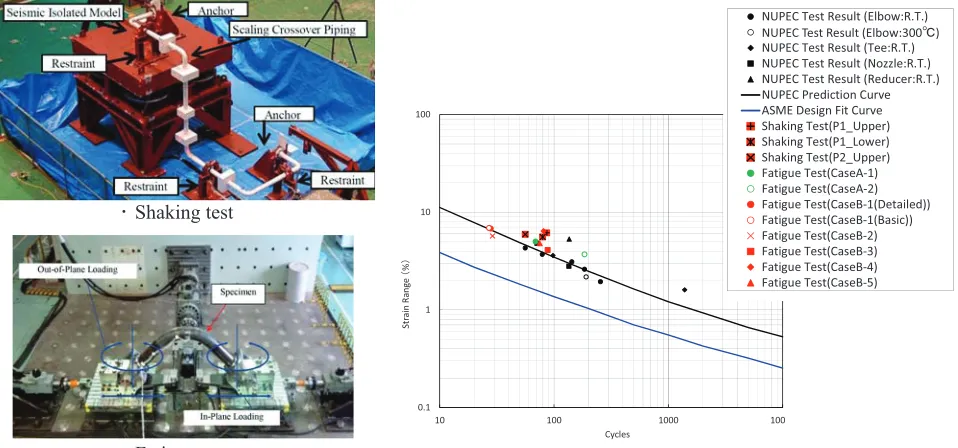
Realistic response distributions of the MS crossover piping at the input acceleration levels are created from the results of the response analysis mentioned in the previous section. Realistic capacity distribution of the MS crossover piping is created by assuming that the design fatigue curve and NUPEC prediction
(best estimate) fatigue curve are 3# and median respectively. NUPEC prediction (best estimate) fatigue
curve has been found to correspond to median capacity in shaking tests and fatigue tests, as shown in Figure 5.
As mentioned in the previous chapter, failure probabilities at the input acceleration levels are calculated from these response and capacity distributions. And a fragility curve is created by the least square approximation of plots of the failure probabilities. Figure 6 shows the created fragility curve and its fragility value as a result is as follows.
࣭ MS crossover piping: Am=5.26G, !c=0.134
This result shows that the seismic failure probability of the crossover piping elbow is sufficiently small.
Figure 5. Results of tests for crossover piping
Figure 6. Fragility curve of MS crossover piping (piping elbow) 0.1
1 10 100
10 100 1000 100
S
tr
a
in
!
R
a
n
g
e
!
䠄
%
䠅
Cycles
NUPEC!Test!Result!(Elbow:R.T.) NUPEC!Test!Result!(Elbow:300Υ) NUPEC!Test!Result!(Tee:R.T.) NUPEC!Test!Result!(Nozzle:R.T.) NUPEC!Test!Result!(Reducer:R.T.) NUPEC!Prediction!Curve ASME!Design!Fit!Curve Shaking!Test(P1_Upper) Shaking!Test(P1_Lower) Shaking!Test(P2_Upper) Fatigue!Test(CaseA"1) Fatigue!Test(CaseA"2) Fatigue!Test(CaseB"1(Detailed)) Fatigue!Test(CaseB"1(Basic)) Fatigue!Test(CaseB"2) Fatigue!Test(CaseB"3) Fatigue!Test(CaseB"4) Fatigue!Test(CaseB"5)
! Shaking test
! Fatigue test
Am = 5.26G
șc = 0.134
Input acceleration (Peak Ground Acceleration)
(G)
F
a
ilu
re
p
ro
b
a
b
ili
ty
Bellows
(1)Bellows fatigue evaluation
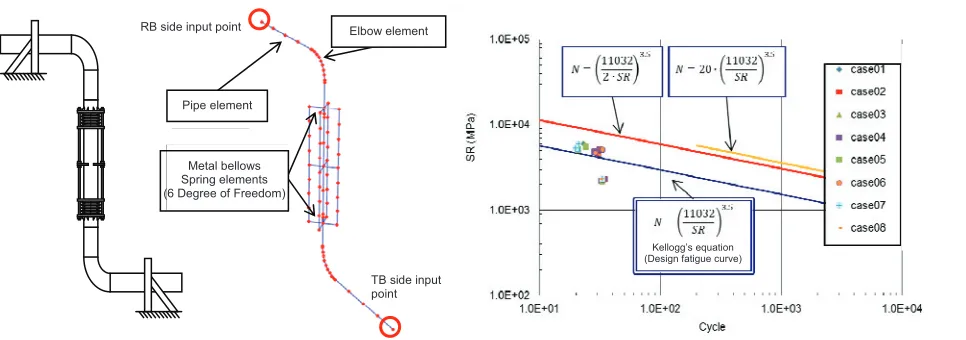
Reactor Component Cooling Water (RCCW) system crossover piping of BWR is designed to absorb relative displacement between isolated reactor building and non-isolated turbine building by installing bellows. Evaluation for this RCCW crossover piping is shown here as a representative of bellows. Analysis model schematic of the RCCW crossover piping with bellows is shown in Figure 7. Analysis cases are specified in the same way as the piping elbow, as mentioned in the previous section. Response analysis for the basic cases are conducted at input seismic motions of Ss (basic input earthquake for this series of study) multiplied by factor "h ("h = 1 " 2.5). Analysis region, methodology and code are also same
as the analysis for piping elbow mentioned in the previous section. Results of the fatigue analysis are shown in Figure 8.
(2) Fragility evaluation
Realistic response distributions of the RCCW crossover piping at the input acceleration levels are created from the results of the response analysis mentioned in the previous section. Realistic capacity distribution of the RCCW crossover piping is created by assuming that the design fatigue curve and the best estimate
fatigue curve are 3# and median respectively. The design fatigue curve of the metal bellows of crossover
piping is obtained by Kellog’s equation. And, because there is no available information about the best estimate fatigue curve of bellows, the best estimate fatigue curve is assumed to be twice stress and 20 times cycle of the design fatigue curve.
As mentioned in the previous chapter, failure probabilities at the input acceleration levels are calculated from these response and capacity distributions. And a fragility curve is created by the least square approximation of plots of the failure probabilities. Figure 9 shows the created fragility curve and its fragility value as a result is as follows.
! RCCW crossover piping bellows: Am=4.44G, !c=0.3903
This result shows that the seismic failure probability of the crossover piping bellows is sufficiently small. 㔠ᒓ࣮࣋ࣟࢬ㻌
㻢ᡂศࡤࡡ㻌
㻼㻵㻼㻱せ⣲㻌
㻱㻸㻮㻻㼃せ⣲
㻾㻮ഃධຊⅬ㻌
㼀㻮ഃධຊⅬ
Figure 7. Analysis model of RCCW crossover piping
Figure 8. Results of fatigue analyses of RCCW crossover piping
Elbow element
Pipe element
Metal bellows Spring elements (6 Degree of Freedom) RB side input point
TB side input point
Figure 9. Fragility curve of RCCW crossover piping (bellows)
COMPONENTS IN THE ISOLATED BUILDING
Fragilities of components except for crossover piping (i.e. primary components, heat exchangers,
electrical boards, etc.) which are placed inside the isolated buildings as shown in Figure 10 are evaluated based on the methodology mentioned in the first chapter.
Figure 10. An example of plant arrangement with the seismic isolation systems
Response and capacity of components
To evaluate the response of the components in the isolated buildings, design improvements to cope with response amplification in the vertical direction, which is the characteristic of the building isolation, are taken into consideration. Structure response analyses for multiple input acceleration levels are conducted to develop floor response spectra for each input acceleration level. Using the obtained floor response spectra, response of the components are evaluated and realistic response distributions are created considering uncertainty and randomness of the evaluation conditions.
Realistic capacity distributions are created by assuming median, uncertainty and randomness based on material properties of parts of the components, results of shaking test, etc.
&DVH
&DVH
&DVH
&DVH
Input acceleration (Peak Ground Acceleration)
(G)
F
a
ilu
re
p
ro
b
a
b
ili
ty ! Failure probability of each analysis case at each input acceleration level
&DVH
&DVH
&DVH
&DVH
Am = 4.44G
!c = 0.3903
Seismic isolators
- PWR - - BWR -
Fragility evaluations
As mentioned in the first chapter, failure probabilities at the input acceleration levels are calculated from these response and capacity distributions. And fragility curves are created by the least square
approximation of plots of the failure probabilities. Figure 11 shows the samples of created fragility curves of the components. And their fragility values as results are also shown in Figure 11.
From the results of fragility evaluations of components in the isolated buildings, it can be concluded that the building isolation is effective to lessen the fragilities of components and, as a result, to lessen Core Damage Frequency (CDF) of the plant.
Figure 11. Fragility curves of components (examples of results)
F a ilu re p ro b a b ili ty F a ilu re p ro b a b ili ty F a ilu re p ro b a b ili ty F a ilu re p ro b a b ili ty F a ilu re p ro b a b ili ty F a ilu re p ro b a b ili ty (G)
(G) (G)
(G) Input acceleration
(Peak Ground Acceleration)
Input acceleration (Peak Ground Acceleration)
Input acceleration (Peak Ground Acceleration)
Input acceleration (Peak Ground Acceleration)
Input acceleration
(Peak Ground Acceleration) Input acceleration
(Peak Ground Acceleration)
a) Primary component b) Piping
c) Electrical board d) Cable tray
e) Heat exchanger
f) HVAC fan
Am = 1.80G
!c = 0.21 Am ! = 4.37G
c= 0.38
Am = 1.94G !c = 0.10
Am = 4.73G !c= 0.44
Am = 2.38G !c = 0.12
Am = 2.89G !c = 0.14
CONCLUSION
Contents and results of this study are summarized as follows.
! Fragility evaluation methodology to cope with non-linearity of building response and fatigue failure
resulting from building isolation is considered and demonstrated.
! Fatigue analyses for the elbow and the bellows of the crossover piping between the isolated building
and the non-isolated building are performed. And their fragilities are evaluated based on above mentioned methodology and the results of the fatigue analyses. As the results, the seismic failure probability of the crossover piping is found to be sufficiently small.
! For the components placed in the isolated building, responses and fragilities are evaluated based on
above mentioned methodology.
! From the results of the fragility evaluations, the building isolation is concluded to be effective to
lessen the CDF of the plant.
Fragility evaluation methodology considered in this study is to be reflected to the seismic PRA standard of Japan in the future revision.
In many cases, fragility curves of components in a conventional (non-isolated) building show that the components have some failure probabilities in the region of design basic earthquakes. However, results of fragility evaluations in this study show that fragility curves of components in isolated building rise from the region of large input acceleration and their failure probabilities in the region of design basic earthquakes are significantly small. Figure 12 shows the comparison of fragility curves of a component in conventional building and isolated building.
Additionally, when a fail-safe mechanism is installed to the building isolation system, failure probability in the region of large input acceleration is expected to be reduced. And as a result, the fragility of the component will be improved further. Figure 12 also shows the expected fragility curve of a component in the isolated building with the fail-safe mechanism.
Figure 12 Comparison of fragility curves
Component in conventional building Component in isolated building
Component in isolated building with fail-safe mechanism
Acceleration region of design basic earthquakes
F
a
ilu
re
p
ro
b
a
b
ili
ty
(G) Input acceleration
ACKNOWLEDGEMENTS
This technology development has been carried out as Japan national project “Development for Evaluation Methods of Seismic Isolation Systems” with the participation of Chubu Electric Power, Japan Atomic Power, Hokkaido Electric Power, Tohoku Electric Power, Tokyo Electric Power, Hokuriku Electric Power, Kansai Electric Power, Chugoku Electric Power, Shikoku Electric Power, Kyushu Electric Power, J Power, Toshiba, Hitachi-GE Nuclear Energy, Mitsubishi Heavy Industries, and the Institute of Applied Energy.
We thank Dr. Nishikawa, a Professor Emeritus at Tokyo Metropolitan University, Dr. Kubo, a Professor Emeritus at the University of Tokyo, Dr. Fujita, a Professor Emeritus at the University of Tokyo, Dr. Kasahara, a Professor at the University of Tokyo, Dr. Yabana, the Central Research Institute of Electric Power Industry for their advice.
REFERENCES
G.Tanaka, et al., (2015). “Development of Evaluation Method for Seismic Isolation Systems of Nuclear
Power Facilities –Seismic PRA for the Seismic Isolated Nuclear Plant-,” SMiRT-23, Manchester,
UK.
K.Suzuki, et al., (2002). “Seismic Proving Test of Ultimate Piping Strength,” 10th International
Conference on Nuclear Engineering, Virginia, USA.
T.Otoyo, et al., (2014). “Development of an Evaluation Method for Seismic Isolation Systems of Nuclear Power Facilities (Part 4), Failure Behaviour of Crossover Piping for Seismic Isolation System,”
Proceedings of the ASME 2014 Pressure Vessels & Piping Conference, California, USA,
PVP2014-29011.
K.Mizuno, et al., (2014). “Development of an Evaluation Method for Seismic Isolation Systems of
Nuclear Power Facilities (Part 5), Fatigue Test of the Crossover Piping,” Proceedings of the ASME
2014 Pressure Vessels & Piping Conference, California, USA, PVP2014-29011.