BACKGROUND LOSSES REDUCTION BY EXCESSIVE PRESSURE CUT-OFF
ZAINUDIN BIN NGADIRAN
A thesis submitted in fulfilment of the requirements for the award of the degree of Master of Engineering (Hydraulics)
Faculty of Civil Engineering Universiti Teknologi Malaysia
Bismillahirrahmanirrahim...
Tesis ini didedikasikan khas untuk insan-insan yang teristimewa:
Untuk isteri tercinta Zaharah Elias, dan
puteri-puteri yang dikasihi, Nur Zuhairah Afrina & Nur Zahirah Amani,
Teristimewa untuk insan yang sentiasa diingati arwah ayah dan ibu,
Penyelia, P.M Ir. Fatimah Mohd Noor,
Jabatan Kawalan NRW, rakan-rakan sepejabat dan keluarga tercinta. Terima kasih di atas ilmu yang dicurahkan dan sokongan padu di sepanjang menyempurnakan naskah tesis ini. Semoga insan-insan teristimewa ini dilimpahi
ACKNOWLEDGEMENT
First and foremost, I would like to express my deepest appreciation to my supervisor Associate Professor Ir. Fatimah Mohd Noor, who has supported and guide me throughout the period of my research work. Furthermore, my gratitude also goes to my superior, Tn. Hj. Anuar Abd. Ghani, En. Yusof Halos, and En. Rosli Abidin for his invaluable encouragement and knowledge given to me throughout my research. I am very grateful that they had generously shared their knowledge and gave me strength to complete this research.
I also wish to express sincere appreciation to my fellow colleagues, especially members of NRW Control Department, SAJ Holdings Sdn Bhd, and Ranhill Water Services Sdn Bhd for their continuous support and encouragement. My sincere appreciation also extends to my entire dear friends for their kindness, encouragement and support.
ABSTRACT
ABSTRAK
Pihak pengurusan perkhidmatan bekalan air berhadapan dengan satu cabaran besar untuk mengurangkan dan mengawal kadar kehilangan air tidak berhasil (NRW) kepada paras yang ekonomik. Pengurangan kadar NRW merupakan petunjuk utama dalam menilai peningkatan prestasi sesebuah operator perkhidmatan bekalan air, selain memastikan air yang mencukupi dapat dibekalkan kepada penduduk. Kebocoran di bawah tanah yang di kategorikan sebagai kehilangan fizikal adalah merupakan komponen utama penyumbang kepada kadar NRW berbanding komponen-komponen NRW yang lain. Kajian ini menumpukan kepada kaedah pengawalan tekanan yang dijalankan ditapak untuk mengurangkan kebocoran di bawah tanah. Kaedah pengurusan tekanan digunakan melalui pemasangan Injap Pengurang Tekanan (PRV) dengan pemotongan tekanan terkawal berdasarkan penetapan masa sebagai pengesahan melalui kerja di tapak. Satu District Meter Area
(DMA) dalam Johor Bahru, iaitu BE59 Kg. Melayu Pandan telah dipilih sebagai kajian kes dan Ujian Berlangkah dijalankan untuk menganalisis dan mengenalpasti kawasan dengan kebocoran di bawah tanah yang tinggi, disamping mencari lokasi pemasangan PRV yang sesuai. Meter kadar alir DMA dan alat merekod data digunakan untuk mengukur kadar aliran masuk dan taburan tekanan bagi mengira kebocoran pada setiap step dan penentuan garisan dasar nilai kebocoran sebelum dan selepas pengakifan PRV pada DMA tersebut. Hasil kajian menunjukkan pengurangan kadar kebocoran di bawah tanah yang tinggi dan ini membantu mengawal dan menurunkan paras NRW di Johor Bahru. Dari sudut kewangan, nilai isipadu air yang dijimatkan dan perbelanjaan kos bulanan menunjukkan kadar bayaran balik R.O.I
TABLE OF CONTENTS
CHAPTER TITLE PAGE
DECLARATION ii
DEDICATION iii
ACKNOWLEDGEMENT iv
ABSTRACT v
ABSTRAK vi
TABLE OF CONTENTS vii
LIST OF TABLES xi
LIST OF FIGURES xiii
LIST OF ABBREVIATION AND SYMBOLS xix
1 INTRODUCTION 1
1.1 Introduction 1
1.2 Statement of Problem 2
1.3 Objectives of Study 4
1.4 Scope of Study 5
1.5 Significance of Study 7
2.1 Introduction 11
2.2 Non-Revenue Water and Leakages 15
2.2.1 Background Theory 18
2.2.2 Causes 19
2.2.3 Components 21
2.2.4 Monitoring and Control 23
2.3 NRW Components 24
2.3.1 Unbilled Authorised Consumption 24
2.3.2 Commercial Losses 25
2.3.3 Physical Losses 29
2.3.3.1 Leakage on Transmission and Distribution Mains 31 2.3.3.2 Leakage and Overflows from Utilities Storage 33
Tanks
2.3.3.3 Leakage on Service Connections up to 34 Customer Meter
2.4 Background Losses 37
2.4.1 Leakage Model 39
2.4.2 Measurement of Background Losses 40
2.5 Leakage Control Method 43
2.5.1 Active Leakage Control 46
2.5.1.1 Economic Level of Leakage 49
2.5.1.2 Step Testing 52
2.5.2 Speed and Quality of Repairs 56
2.5.3 Pipeline and Assets Management 57
2.5.4 Pressure Management 60
2.5.4.1 Pressure-Leakage Relationships 65
2.6 Pressure Reducing Valve 68
2.6.1 Fixed Outlet Controller 72
2.6.2 Time Modulated Controller 75
3.1 Introduction 80
3.2 Setting up of Site Works and Discussion 82
3.2.1 DMA Selection 84
3.2.1.1 Installation of Data Logger for Flow and Pressure 87 3.2.1.2 Background Losses Measurement 88
3.2.2 Step Test 91
3.2.2.1 Step Flow and Leakage Analysis 91
3.2.2.2 Pressure Survey 93
3.2.3 Installation of Pressure Reducing Valve (PRV) 94 3.2.4 Establishing Initial and Second Background Losses Baselines 95
3.3 Estimation of Saving 96
4 CASE STUDY 98
4.1 Introduction to Case Study Area 98
4.2 Site Works 109
4.2.1 Selection of DMA and Case Study Area 111
4.2.2 Step Test 120
4.2.3 Incorporation of Pressure Reducing Valve (PRV) 127 4.2.4 Establishing Background Loss Baselines 135
5 ANALYSIS OF RESULTS AND DISCUSSION 139
5.1 Introduction 139
5.2 Installation of Pressure Reducing Valve (PRV) with Timer Based – 140 Pressure Cut Off Controller
5.3 Background Losses Baseline 142
5.4 Background Losses Reduction on Volume and Cost Saving 146
5.5 Alternative Leakage Control Method 149
5.5.1 Active Leakage Control 149
5.5.2 Pipe Replacement 151
6 CONCLUSIONS AND RECOMMENDATIONS 162
6.1. Conclusions 162
6.2. Recommendations 163
6.3. Problems Encountered 165
LIST OF TABLES
TABLE NO. TITLE PAGE
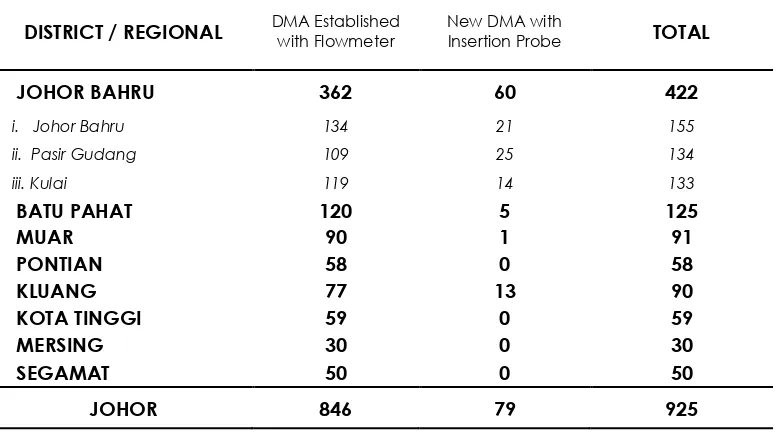
1.1 District Meter Area in Johor, by district (Source: NRW Control, 2011)
9
2.1 Rate of NRW, by state (Source: The Malaysian Water Association, 2010)
12
2.2 Standard International Water Balance (Source: Farley et al, 2008).
17
2.3 References in National Reports regarding Pressure Management (Source: Lambert, 2002)
62
3.1 Net night flow (NNF in litres/second) ranges in October 2009 (Source: NRW Control, 2009)
85
4.1 Total connection and pipe length in DMA, by districts. (October 2009) (Source: NRW Control, 2009)
99
4.2 Volume and percentage of NRW, by district (2009 and 2010) (Source: NRW Control, 2010)
102
4.3 NNF for DMA under squatter area category in Johor Bahru (January – June 2009) (Source: NRW Control, 2009)
103
4.4 NNF for DMA under squatter area category in Johor Bahru (July - December 2009) (Source: NRW Control, 2009)
103
4.5 DMA distribution, by district (October 2009) (Source: NRW Control, 2009)
104
4.6 Distribution of problematic DMA, by problem, (October 2009) (Source: NRW Control, 2009)
4.7 Distribution of problematic DMA, by problem, (October 2009) (Source: NRW Control, 2009)
106
4.8 Background loses distribution by DMA for Johor Bahru (October 2009) (Source: NRW Control, 2009)
111
4.9 Rank of DMA with NNF from 20 to 40 l/s (October 2009) (Source: NRW Control, 2009)
112
4.10 The Step properties (Source: NRW Control, 2009) 121 4.11 The Step Test Results (Source: NRW Control, 2009) 123
4.12 The maximum and minimum pressure values 127
4.13 The maximum and minimum pressure ranges and the day and night pressure cut-off
134
5.1 The cost spent against background losses reduction. 150 5.2 The estimate cost to replace all the pipes and connections
in Step 4.
151
5.3 The volume of NRW and background losses for the Johor state (Source: NRW Control, 2011).
153
5.4 The volume of NRW and background losses for the Johor Bahru (Source: NRW Control, 2011).
154
5.5 The total estimated cost spent for the leakage control methods
158
5.6 A comparison of the total estimated cost saving for three leakage control methods.
LIST OF FIGURES
FIGURE NO. TITLE PAGE
1.1 Location of Johor state (red circle) 5
1.2 Location of DMA:BE59-Kg.Melayu Pandan in Google map 7 2.1 Johor NRW Level from January 2004 to December 2009
(Source: NRW Control, 2010) 13
2.2 Volume of treated water losses in Johor from 2006 to 2009
(Source: NRW Control, 2010) 14
2.3 Trend of NRW volume and background losses in Net Night Flow (NNF) in Johor from December 2006 to July
2009 (Source: NRW Control, 2010) 15
2.4 NRW components (Source: Frauendorfer and Liemberger,
2010) 22
2.5 Leakage control methods (Source: Technical Working
Group on Waste Water, 1985). 23
2.6 Illegal tapping on meter stand (left) and air valve (right) 27 2.7 Tempered meter (left) and improper meter installation
(right) 27
2.8 Sediment (left) and corrosion (right) inside the body of a
water meter 28
2.9 Physical losses examples; air valve leaks and reservoir
overflow 30
2.10 Leakages on distribution pipe 31
2.12 Background leakages; leakage on service connection and
tapping ferrule 35
2.13 Major roads and properties damaged due to background
leakages 35
2.14 Background losses diagram (Source: Farley et al., 2008) 38
2.15 Invisible leakages or background losses 39
2.16 Leakage Model (Source: Farley et al., 2008). 40 2.17 Relationship between leakage (Net Night Flow) and
pressure (Source: Technical Working Group on Waste
Water, 1985). 42
2.18 Leakage Management Strategy (Source: Technical
Working Group on Waste Water, 1985). 44
2.19 Various type of leakage detection equipment 47
2.20 Leak Sounding 48
2.21 The leak run time components; awareness, location and
repair 48
2.22 Economic Level of Leakage Model (Source: Farley and
Trow, 2003) 50
2.23 Flow at closure and re-opening back the step valve in
sequence (Source: Farley et al., 2008). 54 2.24 Flow at closure of all the step valves and re-opening back
in sequence (Source: Farley et al., 2008). 54 2.25 Large flow drop in step 2 indicates presence of leaks
(Source: Farley et al., 2008). 55
2.26 Typical Step Test results showing the presence of leaks
(Source: NRW Control, 2011). 56
2.27 Pipe failures due to aging 59
2.28 The relationships between pressure and (Source: Technical
Working Group on Waste Water, 1985) 66
2.29 The relationships between pressure and leakage (Source:
2.31 PRV Installation 69 2.32 Pressure profile in the distribution and reticulation during
peak demand (Source: Mckenzie and Wegelin, 2005). 70 2.33 Pressure profile in the distribution and reticulation during
low flow (consumption) demand (Source: Mckenzie and
Wegelin, 2005). 71
2.34 Types of pressure control 72
2.35 Pilot or fixed outlet pressure controller sectional area
(Source: NRW Control, 2012) 73
2.36 Schematic of PRV with fixed pressure controller (Source:
NRW Control, 2012) 74
2.37 Pressure profile by using PRV with fixed outlet controller
(Source: Thornton et al., 2005). 74
2.38 PRV with time modulated controller 76
2.39 PRV with time modulated controller schematic (Source:
NRW Control, 2012). 76
2.40 Pressure profile by using PRV with time-modulated
controller (Source: Thornton et al., 2005). 77
2.41 PRV with flow modulated controller 78
2.42 Pressure profile by using PRV with flow modulated
controller (Source: NRW Control, 2012). 79
3.1 Works flowchart 81
3.2 The Setup Field Study process 83
3.3 Installation and Testing process 84
3.4 Typical DMA monitoring equipment 86
3.5 Typical data logger output showing typical flow and
pressure in DMA (Source: NRW Control, 2010). 88 3.6 Typical flow profiles in DMA (Source: NRW Control,
Control, 2010) 90 3.8 Typical pressure profiles in DMA (Source: NRW Control,
2010) 94
4.1 Total reticulation pipe length percentage, by districts
(October 2009) (Source: NRW Control, 2009) 100 4.2 Percentage of total connections, by districts (October
2009) (Source: NRW Control, 2009). 101
4.3 Percentage of DMA distribution, by district (October
2009) (Source: NRW Control, 2009). 105
4.4 Site study flow chart 110
4.5 BE 59 - Kg. Melayu Pandan in a Google map 114
4.6 BE 59 – DMA for Kg. Melayu Pandan 115
4.7 The schematic of BE 59 – DMA for Kg. Melayu Pandan 116 4.8 DMA panel for electromagnetic flow meter and data
logger 117
4.9 A typical flow pattern for three days (Source: NRW
Control, 2009). 118
4.10 A typical pressure pattern for three days (Source: NRW
Control, 2009). 118
4.11 Monthly flows overlaid by daily (Source: NRW Control,
2012) 119
4.12 Monthly pressures overlaid by daily (Source: NRW
Control, 2012) 119
4.13 Step Test Result (Source: NRW Control, 2009). 122
4.14 Step Test Analysis Form 123
4.15 Location of pressure point in the DMA 125
4.16 Pressure data logger installed in the DMA 125
4.17 The 24 hours pressure record for BE59–Kg. Melayu
point (P1) 128 4.19 The arrows shows the selected location of the PRV
installation at the DMA branches of the Step 4 (PV) 129
4.20 The PRV installation works 129
4.21 The daytime cut-off pressure reduction target, based on
the pressure profile at the PRV installation point 130 4.22 Night-time cut-off pressure reduction target based on the
pressure profile at the critical point 133
4.23 Typical pressure profiles at the upstream and downstream of PRV (PV) and at critical point (CP) (Source: NRW
Control, 2009). 134
4.24 Typical background losses trend before and after the PRV
installation (Source: NRW Control, 2009). 135 4.25 Background losses trend before and after the PRV
installation 137
5.1 Pressure trend before and after PRV installation 141 5.2 The daytime (PVdt) and night time (PVnt) pressure cut-off
targets 141
5.3 The pressure trend before and after PRV activation at
critical point. 142
5.4 The MNF trends before (MNFb) activation of PRV. 143 5.5 MNFb and NNFb trends before activation of PRV. 144 5.6 The MNF trend after (MNFa) activation of PRV. 145 5.7 One month MNFa and NNFa trends after activation of
PRV. 146
5.8 The MNFb and MNFa superimposed graphs of 4-days. 147 5.9 The NNFb and NNFa overlaid graph for 30 days periods. 148 5.10 The annual NRW and background loss volume for the
Johor state (Source: NRW Control, 2011). 153 5.11 The annual NRW and background loss volume for Johor
5.12 The annual background loss volume for the Johor state
against Johor Bahru district (Source:NRW Control, 2011). 156 5.13 A comparison of the estimated cost per unit measurement
(RM / m3) for the leakage control methods. 159 5.14 A comparison of the R.O.I for the three leakage control
methods.
161
6.1 Background losses trend before and after activation the
LIST OF ABBREVIATION AND SYMBOLS
% percentage
A.C Asbestos Cement
ALC Active Leakage Control
CP Critical Point
CPcmin Estimated Elevation Difference between the CP and the
Highest Customer Roof Tank Level
CPnmax Average Daily maximum Value for Night-time Periods at Critical Point
CV Cut-off Value
CVd Cut-off Value for the Daytime Pressure CVn Cut-off Values for Night-time Pressure
DMA District Meter Area
BABE Background and Burst Estimates
ELL Economic Leakage Level
FAVAD Fixed and Variables Area Discharges HDPE High Density Polyethylene
IWA International Water Association
KPI Key Performance Indices
LNF Legitimate Night Flow
mH Meter Head
MNF Minimum Night Flow
MNFa Average MNF line after PRV installation MNFb Average MNF line before PRV installation
NNFa Daily Average of the Background Losses Value After the PRV Installation
NNFb Daily Average of the Background Losses Value Before PRV Installation
NNFd Daily Volume of Background Losses Reduction
NNFda Average Daily Background Loss Volume After Activation of PRV
NNFdb Average Daily Background Loss Volume Before Activation of PRV
NNFr Value of Background Losses Reduction
NRR Natural Rate of Rise
NRW Non-Revenue Water
P1 Inlet of the DMA inlet point
P2 Farthest point of the DMA
P3 Highest point of Step 3
PRV Pressure Reducing Valve
PV Point of PRV Installed
PVdmax Average maximum value of daytime pressure PVdt Daytime Pressure Cut-off Target
PVnmax Average Maximum Value of Night-Time Pressure PVnt Night-time Pressure Cut-off Target
PVC Polyvinyl Chloride
R.O.I Return of Investment
SAJ SAJ Holdings Sdn Bhd
SPAN Suruhanjaya Perkhidmatan Air Negara
UFW Unaccounted for Water
VS Average Daily Amount of Volume Saved
WLTF Water Loss Task Force
INTRODUCTION
1.1Introduction
physical losses.
Latest development on pressure management shows the conventional implementation of Pressure Reducing Valves (PRV) have improved and add a new function by using timer-based pressure cut-off and pressure modulation controller to minimise the excess pressure in the water reticulation, hence reduce the background loss. This timer-based pressure cut off controller is attached to the existing PRV and functions to cut-off excess pressure, where the higher current pressure switches to the lower user setting at a designated time, while pressure modulation will accommodate the pressure increase or decrease based on consumption demand or flow profile of the designated District Meter Area (DMA). This study will identify the impact on reduction of background losses by using the PRV with timer-based pressure cut-off at the DMA inlet and comparing the resulting cost of this equipment installation and operation with total length pipe replacement and Active Leakage Control (ALC) implementation.
1.2Statement of Problem
Controlling and reducing NRW is the biggest challenge to the water operator since there are no very efficient tools and strategy to do so. In developing countries, physical loss, due to background leakage such as communication pipe leaks, burst and pipe breakages, pipe fractures due to pipe aging because of oldest infrastructure and worse assets condition, is a major and the biggest contributor to NRW.
level (which is technically feasible), 150 million people could be supplied with already treated water (Frauendorfer and Liemberger, 2010).
Moreover, unmanageable pressure in water reticulation can cause high pressure, sudden changes and wide ranges of pressure transient to occur in the water supply system. This puts a high stress and load to the existing old water system. Pressure and leakage relationship shows a direct relation between these components. High pressures mean high leakage which is directly causing high NRW. This excessive pressure (or over pressure) to the water assets will directly create new leaks at the weak points on the existing assets, and increase the frequency and volume of leakage in the water supply system (Farley et al., 2008).
Pressure Reducing Valve (PRV) is one of the most popular pressure management equipment widely implemented near to DMAs and branches. PRV is the basic pressure equipment which helps avoid the extreme pressures transient in a system. It works as a control by adjusting the maximum and cap the downstream pressure outlet at one fixed pressure line set by the user (Farley and Trow, 2003). In practice, the pressure set at the PRV outlet is the pressure demand on the daytime during peak flow demand. However, the pressure in the system will develop significant ranges more than the daytime (peak consumption demand), when there is less or no water consumed or with low head loss and no flows at the night time. To control and minimise this significant pressure increase in the system during night time, this study has proposed to attach a timer-based pressure cut-off tool to the existing PRV where it would function to provide the additional fix pressure line to control and cap the downstream pressure outlet across the day and night time.
level is shown to be reducing and under control. The background losses line shows an increased trend or upset than the NRW level reduction line, as expected. Once all the efforts to reduce background losses have been put in place, the soaring trends may become a major concern to those water operators to overcome in the coming years.
This study focuses on NRW against background losses trends in Johor. Data on volume of losses on monthly basis are collected and an approach used to reduce background losses by installing pressure management strategy using pressure reducing valve (PRV) is utilised. The PRV would cut down the excessive pressure resulted in the water reticulation system.
1.3Objectives of Study
The objectives of the study has been identified as follows;
1. To determine the volume of background loss that contributes to non-revenue water (NRW) in Johor.
2. To analyse the volume saved due to reduce background loss by using the PRV to cut-off the excessive pressure.
control and sustain by exposing the pressure management using PRV with excess pressure cut-off for better future selection.
1.4Scope of Study
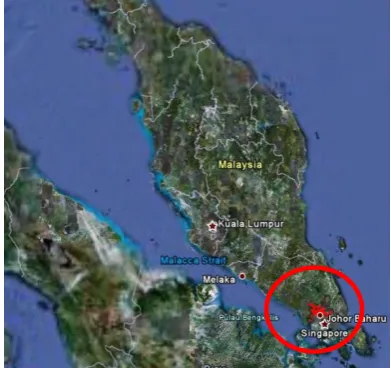
This study is focused on the implementation of NRW control methods in Johor state as shown in Figure 1.1, highlighting on progress performances, milestone, target, achievements and continued improvement efforts put up by the water authority.
Figure 1.1 Location of Johor state (red circle)
the Johor state (NRW Control, 2012).
ii. Johor Bahru has also recorded the highest population density, most DMAs and the longest pipe length in the Johor state (NRW Control, 2012).
iii. Since Johor Bahru has the highest consumers, it has a variety of demographic and businesses such as shop house, light and heavy industry and etc.
A case study will be conducted on BE59 – Kg. Melayu Pandan. It is located along the Tebrau – Kota Tinggi main road and covers most of Kampung Melayu Pandan as shown in Figure 1.2. Out of 348 non-problematic DMAs in Johor Bahru district, BE59 – Kg. Melayu Pandan is selected as a case study due to the highest magnitude of background loss in the DMA rank in the Johor Bahru district. Selection of the district and DMA in this case study is discussed in details in Section 4.2.
Figure 1.2 Location of DMA: BE59 - Kg. Melayu Pandan in Google map
1.5Significance of Study
Reducing NRW means saving a lot of natural resources, energy, chemical usage, etc. The significance impact in reducing NRW is mentioned as follows;
i. To cater for consumer growth and future demands, water utilities will need to look into large scale project on developing new water resources, water treated schemes and catchment area which involved a huge budget allocation to do so.
significant amounts of energy.
iii. Increase cash revenue to water utility by channelling the volume losses to industrial consumers.
iv. Increase water utilities efficiency and image or reputation especially on managing water losses.
v. Provide sustainable water resources plan for future generations.
This study will look into the function of a PRV placed in the water supply line. The pressure and background loss or net night flow (NNF) baseline is determined and whatever excess pressure fluctuations that occur in that duration will be cut-off to maintain the baseline pressure. This excess pressure would reduce the volume of NNF, hence reducing the NRW for that particular district.
DISTRICT / REGIONAL DMA Established with Flowmeter New DMA with Insertion Probe TOTAL
JOHOR BAHRU 362 60 422
i. Johor Bahru 134 21 155
ii. Pasir Gudang 109 25 134
iii. Kulai 119 14 133
BATU PAHAT 120 5 125
MUAR 90 1 91
PONTIAN 58 0 58
KLUANG 77 13 90
KOTA TINGGI 59 0 59
MERSING 30 0 30
SEGAMAT 50 0 50
JOHOR 846 79 925
From economics point of view, large capital investment is always associated with the development of new water resources, water treatment plants, dams and water transfer schemes. However, it can be delayed or postponed for many years due to many unanticipated reasons. However, a postponement can create an opportunity to water providers to gain access in self-generated cash flow, increase in revenue, increase the water provider efficiency and reputation and meet the NRW percentage target as stated in contract between water provider and water authorities.
1.6Limitations of Study
The limitations of study during carry out the site verification has identified and considered two criteria as follows;
These two criteria are considered due to;
i. Collective DMA ranked by background loss magnitude is close to the objectives of this study. Furthermore almost all DMA have data loggers installed to gauge magnitude of daily background loss or Net Night Flow (NNF) in litre per second. Moreover, the historical data for the other options which involve many parameters or variables in their calculation lack specific formula to calculate monthly values. The database system to cater and record all the data for NRW and losses have not yet been develop, which at this moment is in the feasibility study phase for tendering.
ii. The DMA under squatter area is considered in this study since the residents are staying in this area illegally, with the improper service facilities and physical infrastructures not provided sufficiently, and do not normally meet the local authority standard requirements. Furthermore, in most cases, the land acquisition taken by new land owner or developer can be complex as they are not allowed to do any physical works or any obvious improvement activities on the land. The consequences are; some of the major leakage management activities such as pipe replacement or rehabilitation, Active Leakage Control (ALC) and active leakage detection such as regular sounding are not allowed to be carried out.
American Water Works Association (2009). Water Audits and Loss Control Programs - M36: Manual of Water Supply Practices. United States, America: Glacier Publishing.
Andrews, M., Berardo, P. and Foster, D. (2011). The Sustainable Industrial Water Cycle – A Review of the Economics and Approach. Water Science and Technology: Water Supply. 11(1), 67-77.
Asset Replacement. (2010). Asset Replacement Annual Report. Malaysia: SAJ Holdings Sdn. Bhd.
Bambos, C. (2008). Use of District Metered Areas Coupled with Pressure Optimisation to Reduce Leakage. Water Science and Technology: Water Supply. 8(1), 57-62.
Carpenter, T., Lambert, A. O., and McKenzie, R. (2003). Applying the IWA Approach to Water Loss Performance Indicators in Australia. Water Science and Technology: Water Supply. 3(1), 153-161.
Christodoulou, S. and Agathokleous, A. (2012). A Study on the Effects of Intermittent Water Supply on the Vulnerability of Urban Water Distribution Networks. Water Science and Technology: Water Supply. 12(4), 523-530.
Fanner, P. and Thornton, J. (2005). The Importance of Real Loss Component for Determining the Correct Intervention Strategy. Conference Proceedings of the Leakage 2005. 12-14 September. Halifax, Canada, 192 - 202.
Farley, M. and Liemberger, R. (2005). Developing a Non-Revenue Water Reduction Strategy: Planning and Implementing the Strategy. Water Science and Technology: Water Supply. 5(1), 41-50.
Farley, M. and Trow, S. (2003). Losses in Water Distribution Networks - A Practitioner's Guide to Assessment, Monitoring and Control. London: IWA Publishing.
Farley, M., Wyeth, G., Mohd Ghazali, Z., Istandar, A., and Singh, S. (2008). The Manager’s Non-Revenue Water Handbook: A Guide to Understanding Water
Losses. Malaysia: Ranhill Utilities Berhad and the United States Agency for International Development (USAID).
Feldman, D. L. (2011). Integrated Water Management and Environmental Justice – Public Acceptability and Fairness in Adopting Water Innovations. Water Science and Technology: Water Supply. 11(2), 135-141.
Frauendorfer, R. and Liemberger, R. (2010). The Issues and Challenges of Reducing Non-Revenue Water. Philippines: Asian Development Bank.
Ishiwatari, Y., Mishima, I., Utsuno, N. and Fujita, M. (2013). Diagnosis of the Ageing of Water Pipe Systems by Water Quality and Structure of Iron Corrosion in Supplied Water. Water Science and Technology: Water Supply.
13(1), 178-183.
JKR Design Criteria and Standards Committee (1989). JKR Design Criteria and Standards for Water Supply System. Kuala Lumpur: JKR Water Supplies.
Water Science and Technology: Water Supply. 12(4), 504-512.
Kunkel, G. (2005). Developments in Water Loss Control Policy and Regulation in the United States. Conference Proceedings of the Leakage 2005. 12-14 September. Halifax, Canada, 7 - 14.
Lambert, A. O. (2002). International Report: Water Losses Management and Techniques. Water Science and Technology: Water Supply. 2(4), 1-20.
Lambert, A. O. and Fantozzi, M. (2005). Recent Advances in Calculating Economic Intervention Frequency for Active Leakage Control, and Implications for Calculation of Economic Leakage Levels. Water Science and Technology: Water Supply. 5(6), 263-271.
Lambert, A. O. and Lalonde, A. (2005). Using Practical Predictions of Economic Intervention Frequency to Calculate Short-run Economic Leakage Level, With or Without Pressure Management. Conference Proceedings of the Leakage 2005. 12-14 September. Halifax, Canada, 310 - 321.
Liemberger, R. (2002). Performance Target Based Non-Revenue Water Reduction Contracts: A New Concept Successfully Implemented in Southeast Asia. Water Science and Technology: Water Supply. 2(4), 21-28.
Mckenzie, R. S. and Wegelin, W. (2005). Sebokeng/Evaton Pressure/Leakage Reduction: Public Private Partnership. Conference Proceedings of the Leakage 2005. 12-14 September. Halifax, Canada, 382 - 391.
Water Supply System From the Economic Viewpoint and Affecting Factors – Case Study of a City. Water Science and Technology: Water Supply. 12(6), 937-942.
Naveh, N., Ingham, M., Melamed, C., Enav, Y., Cohen, O. and Shalom, G. B. (2005). The Entrepreneurial Approach to Implementing a Leakage Control System in Municipal Networks – Case Studies. Conference Proceedings of the Leakage 2005. 12-14 September. Halifax, Canada, 261 - 271.
Network. (2012). Annual Report – 2012: Network. Malaysia: SAJ Holdings Sdn. Bhd.
NRW Control. (2006). Annual Report – 2006: NRW Control. Malaysia: SAJ Holdings Sdn. Bhd.
NRW Control. (2007). Annual Report – 2007: NRW Control. Malaysia: SAJ Holdings Sdn. Bhd.
NRW Control. (2009). Annual Report – 2009: NRW Control. Malaysia: SAJ Holdings Sdn. Bhd.
NRW Control. (2010). Annual Report – 2010: NRW Control. Malaysia: SAJ Holdings Sdn. Bhd.
NRW Control. (2011). Annual Report – 2011: NRW Control. Malaysia: SAJ Holdings Sdn. Bhd.
NRW Control. (2012). Annual Report – 2012: NRW Control. Malaysia: SAJ Holdings Sdn. Bhd.
Pearson, D. and Trow, S. (2005). Calculating Economic Levels of Leakage.
How Does Pressure Reduction Reduce Burst Frequency?. Conference Proceedings of the Leakage 2005. 12-14 September. Halifax, Canada, 368 - 381.
Pilipovic, Z. and Taylor, R. (2003). Pressure Management in Waitakere City, New Zealand – A Case Study. Water Science and Technology: Water Supply. 3(1), 135-141.
Project Planning. (2011). Annual Report – 2011: Project Planning. Malaysia: SAJ Holdings Sdn. Bhd.
Rogers, D. (2005). Reducing Leakage in Jakarta, Indonesia. Conference Proceedings of the Leakage 2005. 12-14 September. Halifax, Canada, 253 - 260.
South African Water Research Commission (2002). WRC Report TT 169/02. Republic of South Africa: South African Water Research Commission.
Standards and Practice Committee (1994). MWA Design Guidelines for Water Supply System. Kuala Lumpur: Malaysian Water Association.
Tanyimboh, T. T., Marika, T. T. and Saleh, S. (2011). Reliability Assessment of Water Distribution Systems with Statistical Entropy and Other Surrogate Measures. Water Science and Technology: Water Supply. 11(4), 437-443.
Technical Working Group on Waste Water (1985). Leakage Control Policy and Practice. London: Water Authorities Association.
Water Supply Statistics & Performance Indicators. Kuala Lumpur: The Malaysian Water Association.
Thornton, J. and Lambert, A. O. (2005). Progress in Practical Prediction of Pressure: Leakage Pressure: Burst Frequency and Pressure: Consumption Relationships.
Conference Proceedings of the Leakage 2005. 12-14 September. Halifax, Canada, 347 - 357.
Thornton, J., Shaw, M., Aguiar, M. and Liemberger, R. (2005). How Low Can You Go? A Practical Approach to Pressure Control in Low Pressure Systems.
Conference Proceedings of the Leakage 2005. 12-14 September. Halifax, Canada, 392 - 402.
Tooms, S. and Morrison, J.A.E. (2005). DMA Management Manual by the Water Losses Task Force: Progress. Conference Proceedings of the Leakage 2005.
12-14 September. Halifax, Canada, 427 - 431.
Trow, S., and Farley, M. (2004). Developing a Strategy for Leakage Management in Water Distribution System. Water Science and Technology: Water Supply. 4(3), 149-168.
Tuhovcak, L, Svoboda, M., Svitak, Z. and Tothova, K. (2005). The Technical Audit of Water Distribution Network Using the Different Leakage Indicators.
Conference Proceedings of the Leakage 2005. 12-14 September. Halifax, Canada, 495 - 503.
Vanham, D. (2011). How Much Water Do We Really Use? A Case Study of The City State of Singapore. Water Science and Technology: Water Supply. 11(2), 219-228.
Warren, R. P. (2005). The Service Pipe – A Forgotten Asset in Leak Detection.
Woodward, C. A., Rogers, C. D. F. and Chapman, D. (2005). The Effect of Soil Properties on Leakage Economics. Conference Proceedings of the Leakage 2005. 12-14 September. Halifax, Canada, 339 - 346.
Wyatt, A. and Alshafey, M. (2012). Non-Revenue Water: Financial Model for Optimal Management in Developing Countries – Application in Aqaba, Jordan.