Scholarship at UWindsor
Scholarship at UWindsor
Electronic Theses and Dissertations Theses, Dissertations, and Major Papers
11-6-2015
Multi-attribute Performance Models for Small Manufacturing
Multi-attribute Performance Models for Small Manufacturing
Enterprises
Enterprises
Madani Abdu Alomar University of Windsor
Follow this and additional works at: https://scholar.uwindsor.ca/etd
Recommended Citation Recommended Citation
Alomar, Madani Abdu, "Multi-attribute Performance Models for Small Manufacturing Enterprises" (2015). Electronic Theses and Dissertations. 5526.
https://scholar.uwindsor.ca/etd/5526
This online database contains the full-text of PhD dissertations and Masters’ theses of University of Windsor students from 1954 forward. These documents are made available for personal study and research purposes only, in accordance with the Canadian Copyright Act and the Creative Commons license—CC BY-NC-ND (Attribution, Non-Commercial, No Derivative Works). Under this license, works must always be attributed to the copyright holder (original author), cannot be used for any commercial purposes, and may not be altered. Any other use would require the permission of the copyright holder. Students may inquire about withdrawing their dissertation and/or thesis from this database. For additional inquiries, please contact the repository administrator via email
By
Madani Abdu Alomar
A Dissertation
submitted to the Faculty of Graduate Studies
through the Department of Industrial and Manufacturing Systems Engineering in Partial Fulfillment of the Requirements for
the Degree of Doctor of Philosophy at the University of Windsor
Windsor, Ontario, Canada
2015
Enterprises
by
Madani Abdu Alomar
APPROVED BY:
D. Alwerfalli, External Examiner Lawrence Technological University
X. Guo
Odette School of Business
G. Zhang
Department of Mechanical, Automotive & Materials Engineering
H. ElMaraghy
Department of Industrial and Manufacturing Systems Engineering
Z. Pasek, Advisor
Department of Industrial and Manufacturing Systems Engineering
DECLARATION OF CO-AUTHORSHIP/PREVIOUS PUBLICATION I. Co-Authorship Declaration
I hereby declare that this thesis incorporates material thatis the result of joint research. In all cases, the key ideas, primary contributions, experimental designs, data analysis, and
interpretation were performed by the author with the contribution of Dr. Z. Pasek, the advisor.
I am aware of the University of Windsor Senate Policy on Authorship and I certify that I have properly acknowledged the contribution of other researchers to my thesis, and have obtained written permission from each of the co-author(s) to include the above material(s) in my thesis. I certify that, with the above qualification, this thesis, and the research to which it refers, is the product of my own work.
II. Declaration of Previous Publication
This thesis includes [4] original papers that have been previously published/submitted for publication in peer reviewed journals, as follows:
Thesis Chapter
Publication title/full citation Publication
status* Chapter
2&3
Alomar, M. (2013). Improving performance of SMEs using SCOR and AHP methodology. Proceedings from the 2013 Winter
Simulation Conference: Simulation: Making Decisions in a Complex World.
Published
Chapter 2 & 3
Alomar, M., & Pasek, Z. (2014). A supply chain strategy management model for small and medium sized enterprises. Proceedings from 3rd International Conference on Operations Research and Enterprise Systems.
Published
Chapter 3&4
Alomar, M., & Pasek, Z. (2014). Linking supply chain strategy and processes top performance improvement. Procedia CIRP.
Published
Chapter 3&4
Alomar, M., & Pasek, Z. (2014). Improving performance of SME’S using supply chain. Proceedings from International Symposium of the Analytic Hierarchy Process 2014.
Published
I certify that I have obtained a written permission from the copyright owner(s) to include the above published material(s) in my thesis. I certify that the above material describes work completed during my registration as graduate student at the University of Windsor. I declare that, to the best of my knowledge, my thesis does not infringe upon anyone’s copyright nor violate any proprietary rights and that any ideas, techniques, quotations, or any other material from the work of other people included in my thesis, published or otherwise, are fully acknowledged in
accordance with the standard referencing practices. Furthermore, to the extent that I have
included copyrighted material that surpasses the bounds of fair dealing within the meaning of the Canada Copyright Act, I certify that I have obtained a written permission from the copyright owner(s) to include such material(s) in my thesis.
ABSTRACT
Nowadays, there are huge environmental changes in the business world. These
changes have resulted in tremendous growth and opportunities for new markets but also
in challenges that threaten the operations and survival of firms. These competitive
pressures are driving firms to re-evaluate their competitive strategies, supply chains, and
manufacturing technologies in order to improve performance and survive long term.
Small and medium-sized enterprises also face these challenges, which influence their
operations and existence. They are significantly constrained by remarkable limitations in
terms of financial resources as well as non-financial factors, such as informal strategic
decisions and actions. Reports have revealed that small enterprises are vulnerable to
failure. Only around 50% of them in Canada and the United States survive for more than
five years.
Focusing on financial measures alone is not a good strategy for guaranteeing the
long term success of a business. The absence of objective and formal strategic decisions
and performance measurement systems in small enterprises increase their chances of
failure. Therefore, models have been developed that assess and translate informal and
qualitative in small enterprises into measurable, quantitative data. This allows for the
evaluation and measurement of decisions and actions, which increases the chances of
success for a small enterprise. Using the multi-criteria decision methodology (MCDM)
allows for the following: integrating and linking various levels of decision-making and
processes, converting subjective information into objective decision making, executing
An analytical hierarchy process approach was first used to develop a simple
model. Using the case of a small manufacturing enterprise, it was found that the business
did not emphasize financial measures alone; they also paid attention to non-financial
measures, such as reliability and responsiveness. It was observed that the business was
willing to rank strategic attributes and supporting business processes each time there was
a change in the external environment. Finally, an analytical network process approach to
express the links and effects among the supply chains of a small business were
DEDICATION
This dissertation is dedicated to my children: Lana, Toleen, and Faris. I give
my special and deepest expression of love and appreciation to my wife, Alaa, for the
encouragement that she gave and the sacrifices she made during my graduate program. I
am truly thankful for having them in my life. This work is also dedicated to my parents,
Abdu Omar, may Allah have mercy on him, and Ghalia, who has always loved me
unconditionally and whose good examples have taught me to work hard for the things I
ACKNOWLEDGEMENTS
Foremost, I would like to express my sincere gratitude to my advisor, Dr.
Zpigniew J. Pasek, for his continuous support during my PhD program, and for his
patience, motivation, enthusiasm, and immense knowledge. His guidance helped me
throughout all the research and writing processes of this dissertation. Besides my
advisor, I would like to thank the rest of my thesis committee, Dr. Guoqing Zhang, Dr.
Hoda ElMaraghy, and Dr. Xiaolei Guo, for their encouragement, insightful comments,
and challenging questions. My sincere gratitude also goes to Dr. Waguih ElMaraghy, for
his valuable advice that positively contributed to the production of high quality research.
Last, but not least, I would like to thank my parents, my family, and my friends for
supporting me throughout my work and life.
TABLE OF CONTENTS
DECLARATION OF CO-AUTHORSHIP/PREVIOUS PUBLICATION ... iii
ABSTRACT ... iv
DEDICATION ... vi
ACKNOWLEDGEMENTS ... vii
LIST OF TABLES ...x
LIST OF FIGURES ... xiii
LIST OF ABBREVIATIONS/SYMBOLS ... xvi
CHAPTER 1 ...1
Motivation ...4
Thesis Statement ...5
Research Objective ...5
Approach ...6
CHAPTER 2 ...7
Taxonomy of Enterprises and Firms ...7
Characteristics of Large Firms and SMEs...8
Importance of Small and Medium-Sized Enterprises ...11
SMEs’ Challenges and Obstacles ...13
Challenges against Characteristics ...16
Definition and Importance of Performance Measurement ...18
Performance Measurement Systems ...20
Performance Measurement System for SMEs ...29
Previous Research in Performance Dimensions and Measures ...34
Supply Chain Management ...37
CHAPTER 3 ...42
The Conceptual Model ...43
Verification and Implementation of Proposed Model ...65
The implementation process...67
The Analytical Network Process (ANP) ...84
Constructing a Model Using ANP Methodology ...86
Implementation and Analysis ...93
Sensitivity Analysis ...105
Calculating Supply Chain Overall Performance (SCOPI) ...114
CHAPTER 4 ...123
Discussion ...123
Limitations ...126
Future Work ...128
The Novelty and Research Contributions ...128
Conferences and Papers Publications ...131
REFERENCES ...133
APPENDIX ...143
LIST OF TABLES
Table 1. Taxonomy of Firms in Various Countries ... 8
Table 2. Characteristics of SMES Versus Large Firms ... 10
Table 3. Basic Analysis of the Previous Works on PMMS ... 22
Table 4. Basic Analysis of Major Works Conducted for SMEs ... 31
Table 5. Strengths and Weaknesses of Some Models that are Fundamentally Designed to Assist Small and Medium-Sized Enterprises ... 33
Table 6. A Summary of Studies Related to Manufacturing Performance Dimensions .... 34
Table 7. Performance Dimensions and Some of the Related Indicators... 36
Table 8.Strategic Comparison of large firms and SMEs ... 39
Table 9. The Evolution of Supply Chain Performance Models in an Orgnaizational Context ... 41
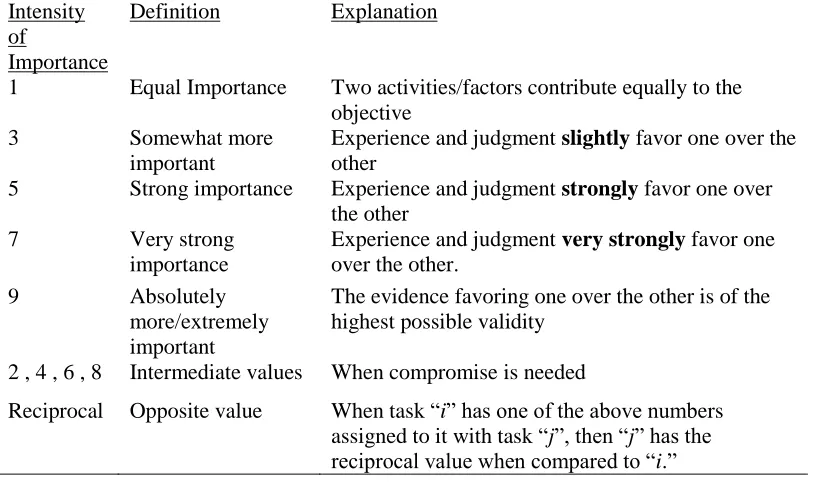
Table 10. The Nine-Point Scale as Designed by Saaty ... 52
Table 11. Pairwise Comparison within N Number of Elements ... 53
Table 12. Definitions of the Selected Strategic Attributes ... 60
Table 13. SC Processes and Definitions ... 62
Table 14. Demand Categories for the Company ... 67
Table 15. Summary of the Enterprise’s Pairwise Comparisons of the Market Demands Level ... 67
Table 16. Pairwise Comparison Matrix of Level 1 Elements ... 68
Table 17. Column Sum of Criteria ... 69
Table 18. Results of Step 2, the Normalized Pairwise Comparison Matrix ... 69
Table 20. Values of RI and n Number of Compared Elements ... 72
Table 21. The Pairwise Comparison of Performance Attributes under High Market Demand ... 73
Table 22. Importance of Business Processes under High Market Demand ... 75
Table 23. Performance Measurement System Before Making the Assessment ... 81
Table 24. Important Measures in Low Market ... 81
Table 25. Important Measures in Average Market ... 81
Table 26. Important Measures in High Market ... 81
Table 27. Pairwise Comparison of Market demand and Product Type ... 94
Table 28. Pairwise Comparison of Market Demand ... 95
Table 29. Judgments on Product Type with Respect to Goal ... 95
Table 30. Pairwise Compariosn among Strategic Attributes with Respect to High Market Demand ... 97
Table 31. Supplier Criteria Comparison and Local Priorities with Respect to High Market Demand ... 97
Table 32. Supplier Criteria with Respect to Functional Product Type ... 98
Table 33. The Pairwise Comparison of Process Cluster with Respect to High Market Demand ... 98
Table 34. Source and Make Processes for Delivery Process ... 99
Table 35. Unweighted Supermatrix, Local Priority of each Node in the Model ... 101
Table 36. Cluster Matrix Obtained Using Super Decisions Software ... 102
Table 37. Weighted Supermatrix ... 103
Table 39. Market Demand Comparison for Scenaio 2 ... 107
Table 40. Pairwise Comparison for the Supplier Criteria under Low Market Demand . 107 Table 41. Pairwise Comparison for the Supply Chain Processes with Respect to Low Market Demand ... 108
Table 42. Pairwise Comparison for Supply Chain Attributes with Respect to Low Market Demand ... 108
Table 43 Unweighed supermatix for scenario 2. ... 110
Table 44. Cluster Matrix for Market Scenario 2 ... 110
Table 45. Weighted Supermatrix for Market Scenario 2 ... 111
Table 46. Limit Supermatrix for Market Scenario 2 ... 112
Table 47. Ranking of Critera at Various Market Scenarios ... 113
Table 48. SCOPI for Market Scenario 1, High Market Demand ... 121
Table 49. Calculation of Overall Supply Chain Performance ……….122
LIST OF FIGURES
Figure 1. Contribution to Canada’s GDP by firm size in private sector. ... 11
Figure 2. Contribution to Canada’s GDP by firm size (public and private). ... 12
Figure 3. Share in percentage of total private employment by size of business. ... 12
Figure 4. Percentage of private job creation by size of business... 13
Figure 5. Survival Rates of Canadian Employer Businesses (with fewer than 250 employees), 2001–2006 ... 17
Figure 6. Large companies and SMEs: Future areas of research ... 21
Figure 7. Sink and Tuttle performance measurement model. ... 24
Figure 8. Balance Scorecard by Kaplan and Norton, 1992. ... 24
Figure 9. Performance pyramid proposed by Cross and Lynch. ... 26
Figure 10. Performance prism. ... 26
Figure 11. Medori and Steeple’s framework. ... 27
Figure 12. The use of different dimensions in the selected studies. ... 35
Figure 13. Pillars of the proposed model... 43
Figure 14. Closed loop performance measurement feedback system. ... 44
Figure 15. Conceptual model that links strategic objectives and business processes to metrics ... 45
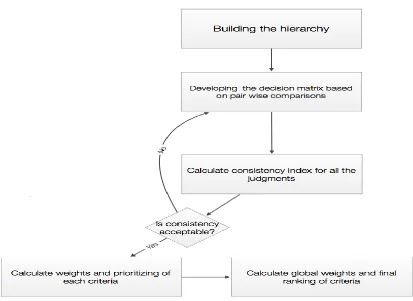
Figure 16. Steps involved in problem solving using the AHP approach... 51
Figure 17. Basic structure of AHP heirichcal model. ... 51
Figure 18. The first two levels using AHP structural approach ... 58
Figure 20. Market demands, strategic attributes and processes in three connected levels
... 61
Figure 21. Performance improvement model with three levels including strategic attributes. ... 63
Figure 22. The hierarchical structure of the proposed performance Measurement and improvement model using AHP methodology ... 64
Figure 23. The likelihood of different market scenarios. ... 70
Figure 24. Weights of performance attributes under high market demand. ... 74
Figure 25. Distribution of business process under various strategic attributes in high market demand. ... 75
Figure 26. Weight of the two alternatives in high market demand. ... 76
Figure 27. Ranking and importance of strategic attributes when demand is 100% low. . 77
Figure 28. The importance of each business process under various strategic attributes in 100% low market demand. ... 78
Figure 29. Selection and priority of strategy under low market demand ... 78
Figure 30. Relative importance of strategic attributes under average market demand. ... 79
Figure 31. The importance of each business process under various strategic attributes in 100% average market demand. ... 79
Figure 32. Selection and priority of strategy under average market demand. ... 80
Figure 33. Selection of strategy under low market demand. ... 82
Figure 34. Selection of strategy under average market demand. ... 82
Figure 35. Selection of strategy under high market demand. ... 83
Figure 37. Connections among market demands and product type clusters. ... 87
Figure 38. Market demand, product type, and strategic attributes. ... 89
Figure 39. Connecting processes cluster to other clusters with internal loops. ... 91
Figure 40. The propsoed Anayltical Netwrok Process model shows clusters conections and loops. ... 92
Figure 41. Ranking of critera at various market scenarios. ... 114
Figure 42. Costs associated with supply chain processes... 117
LIST OF ABBREVIATIONS/SYMBOLS
ABC Activity based costing
AHP Analytical hierarchy process
ANP Analytical networking process
BSC Balance scorecard
C11 Cost of source
C12 Cost of make
C13 Cost of deliver
C14 Cost of return
CI Consistency index
CR Consistency ratio
CSR Cost saving ratio
DIPM Dynamic integrated performance measurement
ES Efficient strategy
ESCS Efficient supply chain strategy
GDP Gross domestic product
MCDA Multi-criteria decision analysis
MCDM Multi-criteria decision-making
Ni Total number of indicators belong to criteria i
OPM Organizational performance measurement
PMM Performance measurement and management
PMS Performance measurement system
R1 Number of orders delivered within agreed time
R2 Total number of orders
Rijk Rating of decision alternative k and for indicator j of criteria i
RI Random index
RS Responsive strategy
RSCS Responsive supply chain strategy
SCPM Supply chain performance measurement
Sk Overall decision of alternative k
SME Small and medium-sized enterprise
TOC Theory of constrains
TSCC Total supply chain costs
X1 Cost saving ratio or CSR
X2 Order fill rate
X3 Response rate
W1 Value assigned for cost/cost saving ratio
W2 Value assigned for reliability/order fill rate
W3 Value assigned for responsiveness/response rate
Wi Relative weight of criteria i
Wij Relative weight of indicator j of criteria i
CHAPTER 1
BACKGROUND OF THE RESEARCH
Since the beginning of last decade of the twentieth century, there have been huge
environmental changes in the business world. On one hand, these changes have resulted
in tremendous growth and opportunities for new markets, and on the other, they have
resulted in problems and challenges of growing complexity that have threatened the
operations and survival of firms. These competitive pressures are driving firms to
continuously re-evaluate their competitive strategies, supply chains, and manufacturing
technologies in order to improve performance, be more competitive, and survive long
term (Alomar and Pasek, 2013).
Small and medium-sized enterprises (SMEs) play significant roles in achievement
of national competitive advantages worldwide by providing a method for the creation of
employment and the generation of wealth. Nevertheless, small enterprises are not
exempted from external pressures. They face the same global turbulences and challenges
that other enterprises face, which in turn, influence their operations and existence.
Moreover, they are significantly constrained by remarkable limitations, including
financial resources, manpower and managerial skills, weak to moderate bargaining power
against customers and suppliers, ‘fire-fighting’ strategies, informal decisions and actions,
and shallow organizational structures.
Studies revealed that small businesses are extremely susceptible to failure; about
50% of small businesses in Canada and 53% in the United States fail to survive for more
than five years. In reality, these survived enterprises successfully maintained their
Several researchers have linked the success of businesses to the type of
performance measurement system they use and to the successful design and
implementation of those measurement systems. Other researchers have considered
strategic performance measurement systems as a means to attain competitive advantages,
continuous improvement, and the ability to respond to the changes (Cocca & Alberti,
2009). However, prior studies have found that the focus of many small enterprises is
primarily on financial indexes. In 2001, Hudson and others conducted an empirical study
on the implementation of performance measurement systems in small and medium-sized
enterprises. The researchers found that all companies in the study had a surplus of
financial measures, but their measurement systems were not derived from strategy, were
often unclear with complex or obsolete data, and were historically focused with some
outdated measures (Hudson, et al., 2001). An empirical survey conducted on eighty-three
Danish enterprises found that 50% of them had either only one performance indicator,
such as cost, or no performance indicator in place at all (Hvolby & Thorstenson, 2001).
Although a few multi-dimensional models of enterprise performance have existed
for decades, previous studies have revealed that the majority of small and medium-sized
enterprises fail to implement these performance measurement systems, and many of them
maintain only financial measures. For example, a study about Canadian manufactures
revealed that about 70% failed to implement well-known strategic performance
measurement models, such as the balance scorecard model (Gosselin, 2005). The failure
to implement strategic performance measurement systems in SMEs is mainly due to the
characteristics and limitations of small and medium sized enterprises or a result of the
model. Hudson (2001) proposed that there are various obstructions to the use of
performance measurement systems in SMEs. The failure to use them is basically a result
of the development process being excessively concentrated on assets and resources and
too strategically focused. This conflicts with the limited resources of SMEs and the more
dynamic, emergent strategy styles found in SMEs (Hudson, 2001). These issues are
intensely problematic because building up a strategic performance measurement system
is a fundamentally long term process, and it unambiguously obliges the subsequent
measures to be strategically focused. Consequently, numerous SMEs do not have the
benefits of executing a multi-dimensional, money related, and non-monetary,
measurement systems that connects business targets and capacities to business operations
and market conditions.
While these performance measurement systems are mainly proposed to assist
small and medium-sized enterprises in improving performance, most of them do not take
the following important aspects into consideration:
1. The measurements that are utilized as a part of a performance measurement system
ought to have the ability to capture the organizations’ performance.
2. Performance measurement ought to reflect clear links with different levels of
decision-making, such as strategic and operational decisions.
3. Performance measurement should reflect a satisfactory balance between financial
and non-financial aspects.
4. The individual needs and preferences of different small and medium-sized
According to Tangen (2004, p.736), “The various approaches have a clear academic
foundation and are theoretically sound, but they hardly aid the practical understanding of
specific measures at an operational level.” Therefore, a new approach is required to
develop a performance measurement model that allows for more visibility and the linkage
of all key business processes, and performance measures—a model that considers all
forms of limitations that exist in small enterprises and in the supply chain structures and
operations of small businesses—a performance measurement model that is capable of
translating qualitative information into quantitative decisions as well as measuring and
capturing owners’ decisions and actions and their influences on business processes and
market success.
Motivation
SMEs have surpluses of financial measures, but their measurement systems are
not derived from strategy, are often unclear with complex or obsolete data, and
tend to be historically focused with outdated measures.
Decisions made in small enterprises are usually informal and subjective, which
leads to incorrect actions and undesirable results.
Performance measurement research that focuses on the specific needs of small
sized enterprises has been in existence for decades; however, it appears that this
research has not fully satisfied the needs of SMEs.
Different multi-dimensional performance measurement models have been created
links among small business characteristics, structures, operations, and
measurements at the operational level.
A poor fit exists between supply chain management and SMEs. This is attributed
to the improper implementation of supply chain management by SMEs and the
lack of the use of supply chain management to complement strategic focus.
Thesis Statement
A well-defined performance measurement and improvement model, suitable for
small-size enterprises that is capable of translating qualitative decisions into quantitative
data, providing decision support, linking and evaluating decisions, and measuring
performance has been formulated.
Research Objective
This research aimed at developing a comprehensive and flexible performance
improvement and measurement model that has the ability to convert qualitative strategic
information into quantitative, actionable decisions in order to help assess the performance
of small and medium-sized enterprises. To accomplish this, the most appropriate
performance measurement and improvement elements, attributes, and measures were
identified, and the connections among them were considered. Performance measurement
is connected to strategic decisions, and it allows management to support decision-makers
in assessing the status of their small enterprise. The research can be divided into the
To develop a comprehensive and flexible model with which to assess and measure
performance in small and medium-sized enterprises
To develop a mathematical equation with which to calculate overall performance
Approach
In order to achieve the research objectives, the following approaches were used:
A review of the related literature to investigate and identify the needs and
characteristics of small and medium-sized enterprises (SMEs)
The identification of gaps in performance measurement systems (PMS) and their
implementation in SMEs
The proposal of a performance measurement and improvement model based on
SMEs limitations, PMS characteristics and the gaps among them
The implementation of a multi-criteria decision analysis approach that assist in
translating subjective decisions into objective decisions, and the selection and
ranking of elements into one comprehensive business performance model
The identification of an appropriate software-based simulation tool
The testing and verification of the proposed model and the application of the
CHAPTER 2
REVIEW OF LITERATURE
This chapter summarizes the literature related to small and medium-sized
enterprises (SMEs). It starts with the classification of firms and categorization standards
used in various economies and the difference between large firms and smaller ones. This
chapter emphasizes the economic and social value that small enterprises contribute to
nations. It also provides readers with sufficient information and background about the
special characteristics of small enterprises, the surrounding hindrances, and the effects of
both on the performance and survival of a small business. The chapter also discusses
supply chain performance measurement in large firms and SMEs.
Taxonomy of Enterprises and Firms
The size of a business can be defined in many ways. It can be defined by its
annual gross or net revenue, by the size of its assets or its workforce, or by the value of
its shipments or annual sale.However, businesses are defined based on the needs or the
requirements of institutions. Industry Canada uses definitions based on workforce size or
the number of employees in a firm, which vary according to the industry. For example,
goods-producers are considered small if they have less than 100 employees. If they have
between 100 and 499 employees, then the firm is considered to be medium-sized
(Industry Canada, 2013). In the United States, firms with more than 10 employees and
less than 100 are considered small, while firms with 100 to 499 employees are considered
considered small, while those with 50 to 249 are classified as medium-sized enterprises.
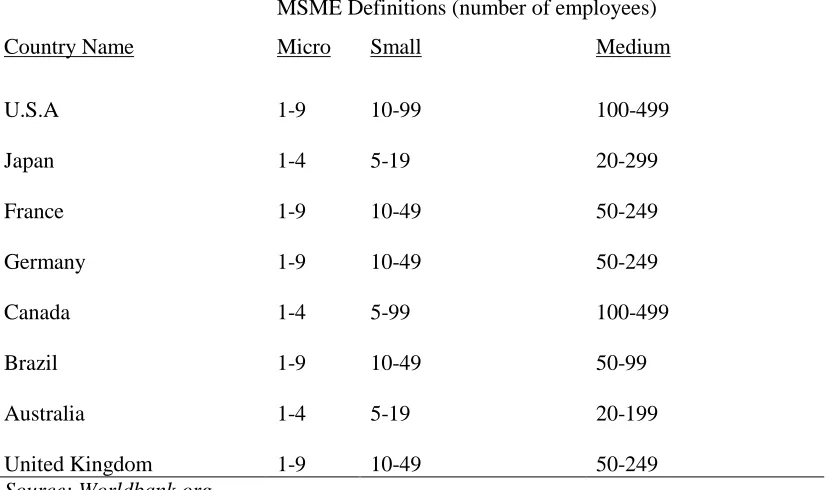
Table 1 shows the general classifications of SMEs in different countries.
Table 1
Taxonomy of Firms in Various Countries
Country Name
MSME Definitions (number of employees)
Micro Small Medium
U.S.A 1-9 10-99 100-499
Japan 1-4 5-19 20-299
France 1-9 10-49 50-249
Germany 1-9 10-49 50-249
Canada 1-4 5-99 100-499
Brazil 1-9 10-49 50-99
Australia 1-4 5-19 20-199
United Kingdom 1-9 10-49 50-249
Source: Worldbank.org
The term “small and medium-sized enterprises” frequently describes firms with
less than 500 employees, while firms with 500 or more employees are classified as large
firms. In Canada, for example, 98% of businesses are considered small and micro
businesses (with less than 100 employees).
Characteristics of Large Firms and SMEs
There are certain characteristics that differentiate large companies from SMEs,
such as culture and behavior, systems and procedures, structure, human resources, and
market and customers (Deros et al., 2006). For example, the structures of SMEs are flat;
delivery point, they have smaller amount of delegation, the division of activities is
narrow and uncertain, there is a lower degree of specialization, they have elastic
structures, and information flows more freely. In regard to the structures of large firms,
however, they involve many layers of management, top management is not visible and is
far from the point of delivery, they have a lot of delegations with clear divisions of
activates and a higher degree of specialization, they show rigid structures and information
flows, and their strategic processes are done on wholesale levels (Deros et al., 2006).
The systems and procedures in SMEs consist of activities and operations that are
not governed by formal rules and procedures; they use informal evaluation, incidences of
‘gut feeling’ decisions, simple planning and control systems, informal reporting
procedures, and flexible and adaptable processes. In large firms, however, the systems
and procedures include activities and operations that are governed by formal rules and
procedures; they use a high degree of standardization, complicated planning and control
systems, formal evaluation, control, and reporting procedures, rigid processes, and most
decisions are made based on facts. Table 2 gives a summary of large company and SME
characteristics. The literature on this topic underlines the fact that the central distinction
between small and large firms is the greater external uncertainty of the environments in
which small firms operate and the greater internal consistency of their motivations and
actions (Bititci et al., 2005). Welsh and White (1981) suggested that a small company is
not a little large business because there are many differences between them, such as
structure, policy making, procedures, and the utilization of resources, to the extent that
Table 2
Characteristics of SMES Versus Large Firms
SMEs Large Firms
Structure
Flat with very few layers of management top management highly visible and closed to the point of delivery
Less delegation
Division of activates limited and unclear
Lower degree of specialization
Flexible structure and information flows
Strategic process incremental and heuristic
Many layers of management levels top management not visible and far from the point of delivery
A lot of delegations
Clear division of activates
High degree of specialization
Rigid structure and information flow
Strategic process done wholesale
System & Procedure
Activities and operations not governed by formal rules and procedures
Simple planning and control system
Incidences of “gut feeling” decisions
Informal evaluation, control, and reporting procedure
Flexible and adaptable processes
Activities and operations governed by formal rules and procedures
High degree of standardization
Complicated planning and control system
Most decisions made based on facts
Formal evaluation, control, and reporting procedure & Rigid processes
Human Resource
High personal authority and commitment of the owner
Few decision-makers
Dominated by pioneers and entrepreneurs
Individual creativity encourages and high incidence of innovativeness
Modest human capital financial resources and know-how
Low degree of resistance to changes
More generalists, some stuff may cover more than one department
Many decision-makers
Encourages teams creativity
Abundant skilled human capital, financial
resources and know-how
Individuals could not see directly the results of their endeavors
High degree of resistance to changes
More specialists, dedicated only to one department
Markets &
Customers
Span of activates narrow
limited external contact
Normally dependent on small customers
Products and services mostly for local market , few national or international markets
Large span of activities
Large external contacts
Normally dependent on large customer
Compete based on quality, price and delivery performance
Products and services for local and international markets
Importance of Small and Medium-Sized Enterprises
Small and medium-sized enterprises (SMEs) have received great attention in
recent years due to the important role they play in most national economies, in both
developed and developing countries. They are perceived as the main drivers of economic
growth, product innovation, and job creation. They are often the suppliers of products and
services to larger companies. Some advanced economies are successful because SMEs
form a fundamental part of the economy.
In a recent report, Statistics Canada found that small enterprises (those with 1 to
99 workers) represented around 41% of private segment GDP and SMEs with 1 to 499
workers represented around 52%. Considering both the private and public segments,
small enterprises in the private division represent around 30% of the GDP, and
medium-sized organizations represent 9%.
In the meantime, large firms account for 36% of the GDP, while the public sector
accounts for only 25% (see Figure 1 and Figure 2) (Industry Canada, 2013). Moreover,
about 44% of manufacturing contributions to Canada’s GDP come from SMEs, and the
remaining 46% comes from large firms.
Source: Industry Canada, 2013.
Figure 1. Contribution to Canada’s GDP by firm size in private sector.
41
11
48
0 20 40 60 80 100
Small Medium Large
%
of
G
D
Source: Industry Canada, 2013.
Figure 2. Contribution to Canada’s GDP by firm size (public and private).
In the year of 2012, there were over 7.7 million employees, or 69.7% of the total
private force work, worked for small businesses. (See Figure 3). Totally, around 10
million individuals workers in SMEs, or 89.9% of employees. In Canada, 98% of
businesses have 1 to 99 employees (Industry Canada, 2013).
Source: Industry Canada, 2013.
Figure 3. Share in percentage of total private employment by size of business.
Small businesses produce a larger role in job market creation than larger firms.
They generated 77.7% of all private jobs from 2002 to 2012 (see Figure 4). On average,
25 30
9
36 0
20 40 60 80 100
Public Small Medium Large
%
of
G
D
P
Small, 69.7 Medium,
20.2
small businesses create a little over 100,000 jobs each year. Medium-sized and large
businesses account for 1.6% and 0.1% of all firms, respectively. They produced 12.5%
and 9.8% of new jobs over the same years, respectively representing about 17,000 and
11,800 jobs each year on average (Industry Canada, 2013).
Source: Industry Canada, 2013.
Figure 4. Percentage of private job creation by size of business.
SMEs’ Challenges and Obstacles
In recent years, literature has identified the increasing complexity of small and
medium-sized enterprises (SMEs) and emphasised the challenges that most SMEs
encounter. For example, Ndubisi (2006) highlighted many of the challenges that are still
facing SMEs. He identified five key challenges: lack of access to finances, human
resource constraints, the limited ability or inability to adopt technology, lack of
information on potential markets and customers, and global competition. He also argued
77.7% 12.5%
9.8%
that there is a high risk that SMEs will be wiped out if they do not increase their
competitiveness in the new, rapidly changing world of globalization (Ndubisi, 2006).
Silas Titus (2014) identified two types of challenges: managerial challenges and
financial challenges. The managerial challenges include the following: lack of industry
experience; poor business planning; fragile systems of control; management
ineffectiveness; ignoring the competition; access to human capital, markets, and
technology; and financial challenges, such as inadequate finance and lack of adequate
cash flow (Titus, 2014). Some of these challenges are summarized below (Reasons,
2014).
2.4.1. Industry experience. Businesses work according to their own
environment. Therefore, the internal resources and core competencies of a business must
be linked to the needs of its environment. Lack of industry experience will lead to weak
organization and the poor utilization of resources. Small firms have to pay attention to
their industry’s structure and carefully study and analyze changes because changes in the
external environment can significantly influence a firm and its resources.
2.4.2. Business planning. A good business plan helps identify a business’ mission, cost, structure, customers, markets, and other external influences. A good
business plan also helps in identifying the strengths and weaknesses of a business.
Around 90% of business failures in the United States are caused by a lack of general
business management skills and planning.
2.4.3. Poor system of control. Metrics and measures help managers to manage organizational activities. If a firm cannot regulate the external influences that affect its
controls is required to measure the performance and achievements of a business. Controls
can be implemented in several aspects of an SME, including controls for measuring the
quality and quantity of decisions and processes. Therefore, a performance measurement
system is an essential part of a control system through which a firm can measure
decisions and operation outcomes against designed and planned business goals. Small
firms usually do not have power to control most external factors, such as markets, supply,
and competitors, but they can adjust their internal decisions, activities, and operations to
meet any uncontrollable changes. A lack of proper control of internal activities can
eventually lead to business failure. An effective system of control measures the quality of
operations and outputs, financial aspects, and overall business performance.
2.4.4. Management incompetence. Effective management properly implements and monitors the strategic, tactical, and operational plans of a business. Around 90% of
business failures are linked to management inadequacy.
2.4.5. Access to finance or inadequate financing. For many SMEs, although financial service suppliers are making funds available for business growth, the reality is
that it is getting tougher to secure financing. The global financial crisis and markets
collapse have caused financial institutions to be more careful, and credit treating has
become so complex that, frequently, SMEs find it difficult to understand both the
procedures and the decisions when it comes to loan processing.
2.4.6. Weakened customer base. Expanding the market is an important element in building a business. This means being flexible enough to adapt to new trends and
concepts. Therefore, it is recommended for small enterprises to focus on a market
Challenges against Characteristics
Existing literature revealed that small and medium-sized enterprises are
distinguished from larger firms by a number of key characteristics (Hudson, Lean &
Smart, 2001). According to the researchers, SMEs are characterized by the following:
Personalized administration frameworks with little designation
Severe asset confinements (related to talented labour and finances)
Flat and flexible structures
Reactive management and ‘fire-fighting’ attitudes
Casual strategies and subjective decision-making
Dependencies on small numbers of customers (narrow markets)
High innovativeness
These characteristics are also considered critical factors in influencing the
implementation of continuous improvement processes as well as performance
measurement systems in SMEs (Garengo, Biazzo & Bititci, 2005). For example, SMEs
experience the significant effects cause by constrained assets for information examination
processes needed for well-known performance measurement models. These
characteristics are common in all SMEs; however, the actual impacts of them depend on
firm size and the volume of the business and market (Alomar & Pasek, 2014). For
example, a medium-sized manufacturing firm usually has a better position in terms of
internal capabilities, technology, resources, number of customers, and market share. Such
firms also have better management and more skilled employees than smaller enterprises
According to Industry Canada (2013), the survival of businesses reflects their
productivity, innovation, and resourcefulness, as well as their adaptability to changing
market conditions. Figure 5 shows survival rates for Canadian SMEs with less than 250
workers. The rates represent the percentage of firms that survived until 2006 and were
formed one to five years prior to that. According to Industry Canada (2013), “About 85%
of businesses that entered the market in 2005 survived for one full year; however survival
rates declined over time. About 70% of firms survived for two years, 62% survived for
three years, and only 51% of firms survived for five years. The fact that half of the new
businesses survived their first five years of operation suggests that these businesses are
able to attain competitive advantages in their markets.”
Source: Industry Canada, 2013
Figure 5.Survival rates of Canadian employer businesses (with fewer than 250 employees), 2001–2006.
In terms of strategy, SMEs often either do not consider long-term strategies or
treat them in an ambiguous manner (Taticchi, 2008).SMEs are often characterized by
weak strategic planning, and their decision-making processes are not formalized (Bititci,
100%
85%
70%
62%
53% 51%
0% 20% 40% 60% 80% 100%
et al., 2002). Although scholars and practitioners have encouraged small enterprises to
use formal strategic management modes to leverage their performance, small enterprises
continue to depict informal strategic management modes, characterized by unstructured
decision-making processes.
The nonattendance of clear systems and methodologies to bolster the control
process indorses both a short-term orientation and planning and a reactive approach to
managing the business activities (Garengo et al., 2005). This represents a crafting issue in
PMM as PMSs ordinarily use well-defined strategy. The dynamic strategies of small
businesses mean that they change their decisions more frequently than larger firms. This
significantly impacts inward operations and the relations with clients and suppliers. Such
conduct, the use of a dynamic strategy, requires a superior arrangement of control with
better capacities to quickly and adequately control the outcomes on the inward and outer
operations of the business.
These constraints and limitations in small manufacturing enterprises stress the
significance of executing performance measurement and control systems. Such a system
must efficiently and effectively reflect key business processes with fewer, but more
critical, measures (when compared to the systems used in larger firms)that are composed
in a reasonable structure and customized to fit the particular needs of every individual
enterprise (Hudson et al., 2001).
Definition and Importance of Performance Measurement
Performance measurement has become an essential subject for academics and
practitioners since the beginning of the 1990s (Gosselin, 2005). Neely and others (2005)
measurement is the process of quantification and action leads to performance.” They
further proposed that performance is a function of the efficiency and the effectiveness of
actions undertaken (Neely, et al, 2005).
Performance measurement is the process of quantifying the efficiency and
effectiveness of actions.
A performance measure is a metric used to quantify the efficiency and/or
effectiveness of an action.
A performance measurement system is the set of metrics used to quantify both the
efficiency and effectiveness of actions.
Based on the performance measurement literature, there are two categories of
effectiveness and efficiency that are commonly addressed as the main indicators of a
business’ performance. Effectiveness states the degree to which clients’ needs are met,
while efficiency is a measure of how firms utilize their resources. Thus, the level of
performance a business achieves is a component of the productivity and adequacy of the
activities it attempts (Neely et al., 2005).Businesses achieve goals by satisfying
customers with better efficiency and effectiveness than rivals (Kotler, 2000). As cited in
Mola (2004), performance measurement is the process of creating indicators that report
on the accomplishments and improvement of an organization. Najmi and Kehoe (2001)
assumed that performance measures are built up to accomplish objectives and are
delivered with a plan to direct, and enhance business’ functions. Typically, performance
measurement is used in the context of guiding organizational change and development
(Mola, 2004). Ittner and Larcker (2003) suggested that performance measurement is used
strategic objectives, and evaluate managerial performance. Neely and others (1994)
claimed that performance measurement aids managers in identifying healthy
performance, makes the trade-offs among profits and investments clear, provides a means
of introducing individual strategic goals and a method for presenting individual key
targets. Performance measurement is thought to be the center of control and management
systems. It assumes a vital part in creating key strategic plans, evaluating organizational
goals, and motivating organizational learning. Likewise, it assumes an important part in
assessing businesses gains, sustaining competitive advantages, and directing corrective
adjustments, activities, and actions (Holban, 2009). Various researchers have linked the
success of businesses to the type of performance measurement system they use and to the
successful design and implementation of the measurement systems used (Alomar &
Pasek, 2014).
Other researchers have considered strategic performance measurement systems as
means to attain competitive advantages and continuous improvement, as well as methods
for responding to internal and external changes (Cocca & Alberti, 2009). Therefore, the
performance measurement systems’ (PMSs) are the tools that support decision-making
for executing or selecting improvement actions or forming objectives (Bititci, 1997;
Neely, 2000). Consequently, a performance measurement system is a multi-criteria
instrument that is made of a group of performance expressions, which are also referred to
as metrics (Melnyk et al., 2004).
Performance Measurement Systems
An extensive survey was conducted by Taticchi et al. (2010) to review the
and management systems over a publication period of forty years. It was observed that
interest in performance measurement and management subjects increased over the last
two decades. The evolution of the focus on performance from a financial viewpoint
shifted towards focusing on performance from non-financial perspectives. However,
based on previous studies, it is understood that there was a significant lack of work in
measuring and assessing the performance of SMEs (Taticchi et al., 2010). A similar
statement was published more than ten years ago by Hudson (2001), which stated that,
regardless of the broad research that has been done to examine the needs and qualities of
PMSs in large organizations, there is a remarkable absence of published research within
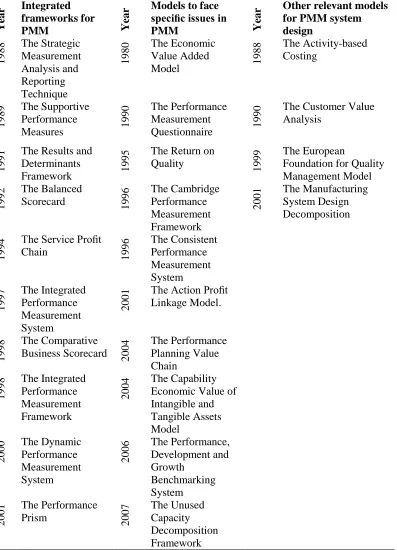
the context of small and medium-sized enterprises (see Figure 6). Taticchi and others
categorized the previous works into three types of research as shown in table 3 (Taticchi
et al., 2010). Some of the well-known performance measurement frameworks and models
will be presented with pros and cons as well.
Source: Taticchi et al., 2010.
Table 3
Basic Analysis of the Previous Works on PMMS
Y
ear
Integrated frameworks for
PMM Y
ear
Models to face specific issues in
PMM Y
ear
Other relevant models for PMM system design 1988 The Strategic Measurement Analysis and Reporting Technique 1980 The Economic Value Added
Model 1988
The Activity-based Costing
1989
The Supportive Performance
Measures 1990
The Performance Measurement
Questionnaire 1990
The Customer Value Analysis
1991
The Results and Determinants
Framework 1995
The Return on
Quality 1999
The European
Foundation for Quality Management Model
1992
The Balanced
Scorecard 1996
The Cambridge Performance Measurement Framework 2001 The Manufacturing System Design Decomposition 1994
The Service Profit
Chain 1996
The Consistent Performance Measurement System 1997 The Integrated Performance Measurement System 2001
The Action Profit Linkage Model.
1998
The Comparative Business Scorecard 2004
The Performance Planning Value Chain 1998 The Integrated Performance Measurement Framework 2004 The Capability Economic Value of Intangible and Tangible Assets Model 2000 The Dynamic Performance Measurement System 2006 The Performance, Development and Growth Benchmarking System 2001 The Performance
Prism 2007
2.7.1. Activity-based costing. Activity-based costing (ABC) was created in the late of 1980s by Johnson and Kaplan as a push to determine some of the essential
insufficiencies of traditional cost accounting. The ABC methodology is concerned with
the expense of business tasks and activities and their connections with the makers of
particular merchandise (Hill, 1995). Basically, the ABC method aims to investigate and
examine the indirect costs within a company and to understand the activities that cause
these costs. These types of activities are called cost drivers, and they can be used to
allocate overheads to particular products. It is supposed that ABC results in a more
accurate identification of costs than traditional cost allocation.
The ABC can be of pragmatic worth for item valuing, production
decision-making, reducing overhead costs, and persistent change and improvement. In any case,
there are analysts who claim that the contention that ABC provides more exact item
expenses has never been demonstrated (Tangen, 2004). Moreover, activity-based costing
depends heavily on the assumption of proportional activity cost structures, and it ignores
resource and technological constraints (Yahya Zadeh, 2011).
2.7.2. Sink and Tuttle model. This model claims that business performance is an unpredictable interrelationship between seven execution criteria (Sink and Tuttle, 1989),
(see Figure 7). Albeit impressive changes in industry settings and conditions have
happened since this model was initially exhibited, these seven performance criteria are
still imperative. On the other hand, this model has a few impediments. For instance, it
does not consider the requirement for adaptability (Tangen, 2004). Moreover, this type of
model requires thorough and accurate analysis that can be time consuming, and it
Source: Sink and Tuttle, 1989.
Figure 7. Sink and Tuttle performance measurement model.
2.7.3. Balanced scorecard (BSC). Created and advanced by Kaplan and Norton (1992). The BSC is a framework that can be utilized to convert an organization’s mission
and strategic goals into an arrangement of performance measures. The balance scorecard
proposes that an organization ought to utilize a balanced measures that allows top
management to have exhaustive evidence of an organization’s performance based on
imperative perspectives that give answers to four essential inquiries (Figure8).
Source: Kaplan and Norton, 1992.
The balanced scorecard incorporates budgetary and non-money related
performance measures. By giving data from four perspectives, the balanced scorecard
decreases data over-burden by controlling the quantity of measures utilized. Likewise, it
pushes administrators to concentrate on the measures that are generally significant. The
BSC is designed to provide top management with an overall view of performance. Thus,
it is not intended for, nor is it applicable to, the factory operations level. The balanced
scorecard is constructed as a monitoring and controlling tool rather than an improvement
tool (Tangen, 2004).
Moreover, it gives little direction on how the proper measures can be
distinguished, presented, or used to deal with a business. Furthermore, top-level
administration decision support measures may not be the most appropriate method to
bolster lower-level operations.
2.7.4. The performance pyramid. Proposed by Cross and Lynch (1992) (see Figure 9). The attractiveness of this framework is that it links business strategy with
day-to-day operations. The performance pyramid connects strategy with operations by
interpreting targets starting from the top (taking into account client needs) and measures
from the base up. It incorporates four levels of targets that address an organization’s
outside effectiveness (left half of the pyramid) and its inner efficiency (right half of the
pyramid). The key strength of the performance pyramid is its effort to integrate business
objectives with operational performance indicators. Nevertheless, it does not offer any
mechanism with which to identify key performance indicators, nor does it clearly
integrate the concept of continuous improvement (Tangen, 2004). Moreover, it does not
Source: Cross and Lynch, 1991.
Figure 9. Performance pyramid proposed by Cross and Lynch.
2.7.5. The performance prism. One of the recently developed conceptual frameworks is the performance prism (Figure 10).It suggests that a performance
measurement system must be planned around five distinctive, however, linked
standpoints of performance (Neely et al., 2001). The five dimensions are: stakeholder
satisfaction; strategies; processes; capabilities; and stakeholder’s contributions
Source: Smartdraw.com, 2015.
The performance prism starts its process by thinking about the stakeholders and
what they want. The performance prism has a more wide perspective of partners than
other performance measurement frameworks and models (Neely et al., 2001). The strong
point of this work is that it addresses the issues in the present strategy before the
procedure of selecting measures is begun. This step ensures that the performance
measures have a strong groundwork. However, the performance prism offers minimal
help about how the performance measures will be realized, and little thought is given to
the current PMSs that organizations may already be using (Tangen, 2004).
2.7.6. Medori and Steeple’s framework. In 2000, Medori and Steeple presented an integrated framework for auditing and enhancing performance measurement systems.
It consists of six detailed stages (see Figure 11). The framework begins with defining a
company’s strategy and success factors. The remaining steps and stages are: matching
strategy to predefined competitive priorities; selection of appropriate measures, auditing
existing PMS and measures. The actual implementation of the measures comes in stage 5,
and the periodic review of the firms’ performance measurement system starts in stage 6.
Source: Medori and Steeple, 2000.
As opposed to numerous different systems, this one goes past straightforward
rules. A noteworthy favorable aspect of this framework is that it can be utilized to outline
a new PMS or to upgrade a current PMS. It additionally contains a special depiction of
how performance measures ought to be figured out. Its limits are mostly situated in stage
2, where a performance measurement framework is made with a specific end goal to give
the PMS its fundamental configuration. Little direction is given here, and the network is
just built from six focused needs (Tangen, 2004; Kurien and Qureshi, 2011).
2.7.7. Theory of constraints. In 1990, Goldratt developed an approach called the theory of constraints (TOC).A constraint is characterized as anything that restricts the
system from accomplishing higher performance in respect to its motivation. The TOC
offers an efficient and focused process that organizations utilize to seek effective change.
The TOC’s “five steps of focusing” are conducted in the following way (Goldratt, 1990).
1. Identify the system’s constraints.
2. Decide how to exploit systems constraints.
3. Subordinate everything else to the above decisions.
4. Elevate the system’s constraints.
5. When a constraint is broken, go back to step 1.
The TOC approach provides focus in a world of information overload. In addition, the
performance measures within the TOC are easy to access and easy to understand.
However, the TOC is far from being a comprehensive performance measurement system
(Tangen, 2004).
Some researchers point out that, even if general models were applied correctly,
enterprise is different from the big company; you cannot simply look at the needs of
SMEs by turning your binoculars upside down and making small what was big”(Biazzo,
et al., 2012). Other researchers who have evaluated the practical implementation of the
well-known performance measurement such as, for example, balanced scorecard in SMEs
conclude that this model is not suitable for SMEs (Hvolby & Thorstenson, 2000;
McAdam, 2000).
Performance Measurement System for SMEs
The literature on PMSs for SMEs compared to the literature about PMSs for large
enterprises is immature. For example, the first PMS models for large companies were
developed in the 1980s, while the first literature related to the PMSs of small and
medium-sized enterprise appeared in the latter half of the 1990s (Taticchi et al., 2010).
During this period, SMEs basically used financial performance measures designed for
large companies, such as ROI, ROE, ROCE, and their derivatives (Taticchi et al., 2010).
According to Taticchi and others, the exploration of performance measurement in
connection to SMEs took two headings; the first was the application and adjustment of
the models produced for large firms and the second was the advancement of particular
models for SMEs. Within the first, it is conceivable to discover instances of the usage of
well-known models like the balance scorecard and utilizations of the ABC. In the
literature, it is also possible to find, three frameworks proposing integrated approaches to
performance measurement (Garengo et al., 2005; Taticchi et al., 2010). Table 4 shows the
classifications of the models/research studies related to SMEs. Although focused
dimensions (i.e., the total cost structure and calculation), which in turn, helps enterprises
properly set product prices, profits, and overhead cost reduction, researchers claim that
these financial models do not cover other manufacturing aspects that are relevant to a
firm’s competitive strategy and customer satisfaction (Tangen, 2004). However, despite
the remarkable progress and evolution of performance measurement models and
frameworks, many businesses, especially small ones, are still mainly depending on
traditional financial performance measures.
Financial performance measurement systems have many disadvantages and
weaknesses that affect the long term ability of an enterprise to compete in the
marketplace. Some of these weaknesses are the following (Tangen, 2004):
Measuring cost, cost efficiency, and utilization leads to short term thinking to
reducing costs at the expense of long term planning and improvement.
Financial measures usually provide businesses with obsolete information,
showing only the results of previous actions.
Financial measures usually focus on the return on investment (ROI) and are rarely
directed to manufacturing strategies.
In opposition to these financial performance measurement systems, there are
multi-dimensional models, such as the organizational performance measurement (OPM)
system, the dynamic integrated performance measurement (DIPM) system, and the
balance scorecard (BSC) system, which involve different dimensions in terms of financial
and non-financial measures. However, these systems have certain weaknesses that create
Table 4
Basic Analysis of Major Works Conducted for SMEs
Y
ear
Integrated frameworks for
SME PMM Y
ear
Application/adapt ation of large companies PMM models
Y
ea
r
Models to face specific issues in SME
2000
OPM: a system for organizational performance measurement
1995
Model for quality-based
performances 1998
Customer orientation and performance 2001 Effective performance measurement in SMEs 1997
BSC application to
SMEs 2000
Computer-based performance measurement in SMEs 2002 Dynamic integrated performance measurement system 1999 Activity based
costing in SMEs 2007
A BPI framework and PAM for SMEs
Y
ear
Interesting researches for PMM system design in SMEs
2000
Quality models in an SME context
2000
Performance measurement based on SME owner’s objectives
2000
Performance measurements in the implementation of CIM in SMEs
2001 Indicators for performance measurement in SMEs 2004 A strategic
planning model for SMEs based on the BSC
2001
Theory and practice in SME performance measurement systems 2007 BSC implementation in a not-for-profit SME 2005 Practice of performance measurement 2008 A performance measurement model based on the grounded theory approach.
For example, the BSC is mainly designed to provide senior managers with a
general view of performance improvement but not of the factory operations level, in
addition, it provides little guidance on how the correct measures can be identified,
presented, and used in order to improve business operations. (Ghalayini et al., 1997).One
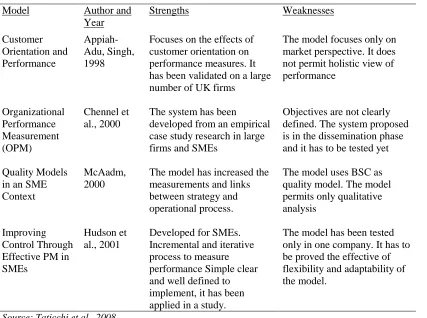
of the main weaknesses with the application of multi-dimensional performance
measurement systems in small enterprises is that their structures are not unmistakably
organized and, hence, application is subjective. Table 5 shows the strengths and
weaknesses of some models that are fundamentally designed to assist small and
medium-sized enterprises in improving performance. As Tangen (2004) explains, “These various
approaches have a clear academic foundation and are theoretically sound, but they hardly
aid the practical understanding of specific measures at an operational level.” This is
considered a major obstacle in implementing multi-dimensional performance
measurement systems in small enterprises. On the other hand, many small enterprises are
family-owned businesses and can often be characterized by a shortage of financial
resources. They do not have the assets to possess advanced technology, bringing about
low efficiency, an inability to take after the best practices, an inability to accumulate
adequate pertinent information for analysis, and they confront constraints on their
operations (Taticchi et al., 2010). In 2001, Hudson and others conducted an empirical
study on the implementation of performance measurement systems in small and
medium-sized enterprises. The researchers found that all companies in the study had a surplus of
financial measures, but their measurement systems were not derived from strategy,
vague, with out of date information, and with some obsolete measures (Hudson et al.,