ABSTRACT
GASPERSON, SEAN MORGAN. The Effects of Item-by-Item Feedback during a Computer Adaptive Test. (Under the direction of Lori Foster Thompson.)
Decisions involved in designing high-stakes tests include whether to give examinees feedback and, if it is given, how to display the feedback to them. Researchers have yet to examine the effects of item response theory-related feedback on state test anxiety and examinees’ perceptions of fairness when said feedback is given on an item-by-item basis – such as during a computer adaptive test. To address these gaps in the literature, this experiment examined the effects of feedback on state test anxiety and perceived test fairness, accounting for individual differences in feedback acceptance, exam
performance, and performance goal orientation. These effects were examined across three modes of item-by-item feedback (i.e., text feedback, graphical feedback, and
text/graphical feedback together) during a computer adaptive test in an online sample (N
The Effects of Item-by-Item Feedback during a Computer Adaptive Test
by
Sean Morgan Gasperson
A dissertation submitted to the Graduate Faculty of North Carolina State University
in partial fulfillment of the requirements for the degree of
Doctor of Philosophy
Psychology
Raleigh, North Carolina 2014
APPROVED BY:
_______________________________ ______________________________
Dr. Lori Foster Thompson Dr. Adam W. Meade
Committee Chair
________________________________ ______________________________
BIOGRAPHY
ACKNOWLEDGEMENTS
I would like to thank many people for their support during this journey. First, I would like to acknowledge my committee chair, Dr. Lori Foster Thompson, and my committee members, Drs. Adam Meade, Bart Craig, and Mark Wilson. Your advice, support, humor, and candor have been tremendous assets to me, both personally and professionally. Thank you all for the knowledge, skills, abilities, and other characteristics you have engendered in me to be the best scientist-practitioner that I can be, so that I may “spiral up” in the cycle of high performance.
This project and pathway would have been impossible without the love of my family and friends. My parents, George and Margaret, have loved me unconditionally and have helped me keep my name off of the board ever since I wanted to wear my Superman thing to school. My brother, Jesse, and sister-in-law, Carrie, have been the type of parents that I aspire to be. My ECU advisor, Mark Bowler, has been a valuable mentor and friend. Mark, thank you for keeping me in the in-group! To my cohorts – thank you all for keeping this arduous process enjoyable! I will always cherish your friendships.
TABLE OF CONTENTS
LIST OF TABLES ... v
LIST OF FIGURES ... vii
Introduction ... 1
Test Feedback ... 1
State Test Anxiety ... 4
Perceived Test Fairness... 8
Method ... 11
Participants ... 11
Design ... 12
Procedure ... 12
Measures ... 16
Results ... 19
Discussion ... 21
Practical Implications... 23
Limitations and Future Directions ... 24
Conclusion ... 25
REFERENCES ... 26
LIST OF TABLES
Table 1. Descriptive Statistics and Correlations among Study Variables ... 33 Table 2. Means and Standard Deviations of Moderator and Outcome Variables by Study
Condition... 34 Table 3. Demographic Variables by Phase ... 35 Table 4. Regression Analysis Predicting State Test Anxiety from Text Feedback and
Test Performance ... 36 Table 5. Regression Analysis Predicting State Test Anxiety from Graphical Feedback
and Test Performance ... 37 Table 6. Regression Analysis Predicting State Test Anxiety from Text and Graphical
Feedback and Test Performance ... 38 Table 7. Regression Analysis Predicting State Test Anxiety from Text Feedback, Test
Performance, and Avoid Performance Goal Orientation ... 39 Table 8. Regression Analysis Predicting State Test Anxiety from Graphical Feedback,
Test Performance, and Avoid Performance Goal Orientation ... 40 Table 9. Regression Analysis Predicting State Test Anxiety from Text and Graphical
Feedback, Test Performance, and Avoid Performance Goal Orientation ... 41 Table 10. Regression Analysis Predicting State Test Anxiety from Text Feedback, Test
Performance, and Prove Performance Goal Orientation... 42 Table 11. Regression Analysis Predicting State Test Anxiety from Graphical Feedback,
Test Performance, and Prove Performance Goal Orientation ... 43 Table 12. Regression Analysis Predicting State Test Anxiety from Text and Graphical
Feedback, Test Performance, and Prove Performance Goal Orientation ... 44 Table 13. Regression Analysis Predicting Perceived Test Fairness from Text Feedback
and Test Performance ... 45 Table 14. Regression Analysis Predicting Perceived Test Fairness from Graphical
LIST OF FIGURES
Introduction
Many factors can affect test takers in high-stakes testing environments such as pre-employment testing or university entrance exams. Each year, decision makers and
psychometricians spend a substantial amount of money selecting and developing tests for administration to applicants (Harper, 2008). Test design is vital to consider due to the potential ramifications of (a) examinees responding to test characteristics in different ways, and (b) examinees having adverse reactions to aspects of the test. Among the decisions involved in designing a test are whether to give examinees feedback, when to give feedback to them, and how to give feedback to them. These decisions could affect examinees’ anxiety levels during the test as well as how fair they perceive the test to be. However, there is a dearth of literature devoted to this topic, particularly in the context of computer adaptive testing (CAT). The purpose of this study is to assess the effect of various modes of item-by-item feedback on examinees’ state test anxiety and perceptions of test fairness during a computer adaptive test in a high-stakes testing situation.
Test Feedback
performance” (p. 255). Giving examinees feedback typically refers to providing them with some sort of report of their performance at the end of the test. However, researchers have explored the extent to which more complex characteristics of the feedback (e.g., content, frequency, mode, and source) affect outcomes such as performance on a particular task or job (for reviews, see Alvero, Bucklin, & Austin, 2008 and Balcazar, Hopkins, & Suarez, 1985).
Two dimensions on which feedback can vary are the timing of the feedback (i.e., when it is administered) and the mode of feedback (i.e., how the feedback is displayed to the test taker). Feedback is typically given at the end of the test or later, though some research has been devoted to assessing the effect of giving feedback after examinees complete each item (e.g., Butler, Karpicke, & Roediger, 2007; Clark, Fox, & Schneider, 1998). This
research, though practical, is lacking in two ways. First, the content of the feedback is limited to whether examinees answered the item correctly or incorrectly. Second, the research has been mainly focused on examinees’ preference for the timing of feedback and how delayed versus immediate feedback affects performance on the task (e.g., Butler et al., 2007). Other outcomes, such as examinees’ test anxiety and perceptions of the test’s fairness, should be explored.
Feedback can also vary by how it is given or displayed to the examinees. In
conducting a literature review on the effect of various forms of feedback, Alvero et al. (2008) identified four primary methods of providing feedback: text, verbal, graphical, and
feedback effects. Text feedback that was accompanied by graphical feedback, however, was effective in 86% of the studies. Thus, research suggests that coupling text feedback with graphical feedback is more effective. Like feedback timing, however, research on feedback mode has primarily focused on performance- and satisfaction-based outcomes.
Computer adaptive testing and item response theory (IRT) provide a valuable
feedback effects extend to tests that provide said feedback on an item-by-item basis. This study contributes to the literature by being the first to assess the effects of IRT-specific feedback in this way (i.e., item-by-item) during this type of test (i.e., CAT). Feedback could act as a method of focusing examinees’ attention toward aspects of their performance. Alternatively, by presenting additional stimuli, it could distract them from the test. Research is needed to assess its effects on outcomes such as state test anxiety and perceived test fairness.
State Test Anxiety
Test anxiety has been operationalized as emotional, physiological, and behavioral responses to the potential consequences of negative outcomes on a test or exam (Zeidner, 1998). Test anxiety is induced when test takers perceive that the demands of the test situation exceed their intellectual, motivational, and/or social capabilities (Sarason & Sarason, 1990). Research on the topic has addressed a variety of concerns, including interventions for test anxiety (e.g., Ergene, 2003), personal and situational predictors of test anxiety (e.g., Putwain, Woods, & Symes, 2010), its relationship with various constructs such as learned helplessness (e.g., Akca, 2011), and perhaps most notably, its relationship with task performance (see Alam, 2013; Cohen, Ben-Zur, & Rosenfield, 2008; In’nami, 2006). Test anxiety can
generally be divided into state test anxiety and trait test anxiety. State test anxiety refers to an anxious, temporary condition specific to a particular testing situation, while trait test anxiety refers to a more stable tendency to have anxiety across any testing situation (Hong, 1998).
received feedback of poor performance reported higher test anxiety, and those who received feedback of high performance reported lower test anxiety. This research, however, did not assess whether higher and lower performers react differently to real-time feedback.
Immediate feedback (i.e., item-by-item) inherently gives examinees an indication of test performance. As individuals take a test, immediate feedback makes them aware of the discrepancy (or lack thereof) between their current performance and their desired
performance (Kluger & DeNisi, 1996). For better performers, this discrepancy will be lower. For poorer performers, it will be higher. Furthermore, feedback that gives examinees a more detailed item-by-item account of their performance and how their abilities are being
estimated heightens examinees’ awareness of that discrepancy. The typical alternative, giving examinees their score at the end of the test, does not have the capacity to influence state test anxiety throughout the testing situation because examinees may not be completely certain how many items they answered correctly or incorrectly. Thus, for poorer performers, detailed item-by-item feedback should lead to higher levels of state test anxiety. For better
performers, detailed item-by-item feedback should lead to lower levels of test anxiety. Although some research has been devoted to assessing the main effect of feedback on state test anxiety (e.g., DiBattista & Gosse, 2006; Hansen, 1974), the moderating effect of performance on the relationship between feedback and state test anxiety during a test that provides ongoing item-level feedback throughout the test has not been examined.
Hypothesis 1: Test performance will moderate the effect of item-by-item feedback on
As prior research has suggested that the way feedback information is presented to people can influence reactions to it (Alvero et al., 2008), this and all subsequent hypotheses will be tested across three modes of feedback: text feedback, graphical feedback, and text and graphical feedback together.
There may be types of individuals for whom the moderating effect of test
performance is especially likely. In particular, examinees oriented toward performance goals may be particularly sensitive to feedback conveying performance failures and successes. As an overall construct, goal orientation refers to how people react to opportunities to
demonstrate or develop ability (Dweck, 1986). Goal orientation can be divided into learning goal orientation (i.e., seeking to master and acquire new skills) and performance goal orientation (i.e., seeking opportunities to demonstrate or validate one’s competence; Dweck & Leggett, 1988). Vandewalle (1997) further differentiated performance goal orientation into
prove performance goal orientation (PPGO) and avoid performance goal orientation (APGO). PPGO is one’s tendency to seek opportunities that may demonstrate competence, while APGO is one’s tendency to avoid situations that may disprove competence. In a meta-analysis examining the relationship of goal orientation dimensions and proximal and distal outcomes, Payne, Youngcourt, and Beaubien (2007) found that individuals with high levels of APGO and PPGO were likely to have high levels of state test anxiety. As item-by-item feedback provides immediate knowledge of results, individuals who are high in performance goal orientation (both avoid and prove) and receive feedback indicating that they are
Hypothesis 2: There will be a three-way interaction between feedback, test performance, and performance goal orientation on state test anxiety, such that
performance’s moderating influence on the effect of feedback is more pronounced for those more oriented toward avoid performance (H2a) and prove performance (H2b) goals.
Perceived Test Fairness
Moving beyond state test anxiety, feedback’s influence over other outcome variables is also important to consider. Perceptions of a test’s fairness, in particular, warrant
consideration. Perceptions of test fairness can be understood by examining the organizational justice literature. Organizational justice has been a popular area of research throughout recent years. It refers to “people’s perceptions of fairness in organizations along with their
associated behavioral, cognitive, and emotional reactions” (Greenberg, 2011, p. 271). Three primary types of organizational justice have been identified – distributive justice, procedural justice, and interactional justice (Bierhoff, Cohen, & Greenberg, 1986; Bies & Moag, 1986; Folger & Greenberg, 1985). Procedural justice (i.e., the perceived fairness of the processes that are used when organizational decisions are made; Folger & Greenberg, 1985) is thought to be composed of ten “rules” which, when violated, lead to perceptions of injustice
(Gilliland, 1993; Leventhal, 1980). As pre-employment testing is included in the organizational decision-making process (more specifically, the hiring process), much research about procedural justice focuses on perceptions of test fairness.
feedback during the testing process can affect perceived test fairness. Specifically, research has indicated that the mere presence of feedback during the testing process can result in higher evaluations of fairness (Lounsbury, Bobrow, & Jensen, 1989). Furthermore, other research has shown a significant effect of feedback on post-feedback fairness perceptions (van Vianen, Taris, Scholten, & Schinkel, 2004). Feedback, when given throughout the test, provides information to examinees regarding how they are performing and how their final scores are calculated. Particular to computer adaptive testing, item-by-item feedback can facilitate examinees’ understanding of how their scores are calculated by providing
information about the scoring process. In essence, rather than simply providing a final score after testing, information such as real-time ability (i.e., theta) estimates, the precision with which the examinees’ ability is being estimated (i.e., standard error of measurement), and the difficulty of the items can be given to the examinee, providing transparency and clarity about the methods of item response theory. This transparency is a defining characteristic of
procedural justice – namely, facilitating examinees’ knowledge about the how the tests are selected, constructed, and used (Gilliland, 1993).
1998; Smither, Reilly, Millsap, Pearlman, & Stoffey, 1993). Researchers have attributed this relationship to self-serving biases (Chan, Schmitt, Jennings, Clause, & Delbridge, 1998). That is, poorer performing examinees are more likely than better performing examinees to evaluate a test as unfair in order to maintain a positive view of themselves by means of threat-reduction or ego-enhancement. As examinees receive detailed item-by-item feedback throughout the test, any ambiguity regarding their performance will be reduced. For better performers, item-by-item feedback should reinforce the higher perceptions of fairness that they hold about the test, while for poorer performers, item-by-item feedback should reinforce the lower perceptions of fairness that they hold about the test.
Though previous research has examined the main effects of feedback and test performance on perceived test fairness, there is a dearth of research exploring their interactive effects. It is possible that providing real-time information about the test and examinees’ test performance, combined with how well one performs on the test, could affect perceptions of test fairness.
Hypothesis 3: Test performance will moderate the degree to which item-by-item
feedback affects perceived test fairness, such that feedback will increase perceived test fairness for better performers and decrease perceived test fairness for poorer performers.
Fisher, & Taylor, 1979). Research has previously examined the moderating effect of
feedback acceptance on the relationship between feedback and outcomes such as satisfaction with the test and fairness perceptions. Tonidandel, Quiñones, and Adams (2002) found that when participants accepted test feedback and had accurate perceptions of their performance, there was a positive relationship between feedback and perceptions of test fairness. When participants did not accept test feedback and had inaccurate perceptions of their performance, there was no relationship between feedback and fairness perceptions. Thus, it appears that examinees may evaluate whether the performance feedback aligns with their perceptions of their own performance when deciding whether to accept the feedback. Though previous research (e.g., Tonidandel et al., 2002) provides some evidence of the relationship of feedback acceptance and perceived test fairness, the feedback was only given at the end of the test. While end-of-test feedback is informative, research has not provided a thorough examination of real-time feedback as it relates to perceived test fairness.
Hypothesis 4: Among individuals who receive item-by-item feedback, there will be a
positive relationship between feedback acceptance and perceived test fairness. Method
Participants
Participation for this study was solicited via Amazon Mechanical Turk (MTurk). MTurk is a crowdsourcing website through which researchers can pay participants to
2013). This study’s sample was restricted to individuals who speak English as a first language and who reside in the United States. This is due to the fact that some items in the test require a nuanced understanding of the English language.
Design
This study employed a between-groups design. Participants were randomly assigned to one of four conditions that varied according to the mode of feedback that they received: control (no feedback), text feedback only, graphical feedback only, or text and graphical feedback. The mode of feedback is the independent variable, with the four levels described above. There were two dependent variables – state test anxiety and perceived test fairness. Test performance and goal orientation were tested as moderators, and a correlational relationship between feedback acceptance and perceived test fairness was assessed. Procedure
1 were compensated $0.75. A total of 488 participants signed up to complete phase 1. Participants’ responses were discarded if they did not complete the entire test, spent fewer than ten minutes taking the test, or spent greater than 120 minutes taking the test. This left 335 usable responses for phase 1.
Before the item subsets were linked, dimensionality and reliability were assessed. It is inappropriate to equate two test forms that measure different constructs and that are not equally reliable (Dorans & Holland, 2000). Thus, an exploratory factor analysis (EFA) was conducted on each item subset, and the factor structure of each test was compared.
Concurrently, the reliability of each measure was assessed. Items that displayed low item total correlations and poor factor loadings were discarded. The factor structures and reliability estimates of both forms were adequately similar. Thus, it was appropriate to combine the forms into a single test. After combining the forms, items with discriminations lower than .5 were discarded. In total, ten analogy items were discarded, leaving 140 final items that were entered into the test bank for the CAT.
receiving additional incentives. A total of 380 participants signed up to complete this phase. Participants’ responses were discarded if they had incomplete data or spent fewer than two minutes on the assessments of the dependent and moderator variables examined in this study. This left 338 usable responses for phase 2.
Participants were randomly assigned to one of the four feedback conditions. Each condition varied with regard to whether and how the feedback information was displayed on the screen after answering each item. The control condition contained neither the text nor graphical feedback; that is, it provided no information about examinees’ estimated theta, etc. The three feedback conditions displayed examinees’ estimated theta, the standard error of their theta estimate, and the item difficulty numerically after each item, accompanied by a brief description of how this information could be interpreted. These terms (e.g., theta estimate, item difficulty, etc.) were described in a way that could be understood by laypersons, and were shown on every screen throughout the test. The text-only feedback condition displayed the numbers corresponding with these terms without any graphs. For the graphical feedback condition, three separate line graphs displaying examinees’ estimated theta, the precision of their theta estimate, and the item difficulty were displayed,
graphical depictions of them. An example of each condition can be found in Appendix A. Before participants completed the computer adaptive test, they were given a brief tutorial to familiarize them with the terminology and feedback they would receive during the test. Participants in the control condition were only given a tutorial that related to the analogy items. Participants in the feedback conditions were given the analogy item tutorial as well as a feedback tutorial that provided pictorial examples accompanied with explanations of the feedback they would receive during the test. In the feedback conditions, participants were required to answer three questions about the tutorial to ensure that they understood it.
The CAT began with an item that corresponded to a theta level of zero. Each subsequent item was selected by giving examinees an item that they have not previously taken that provides the most information at their current estimated theta level. The test terminated when the standard error for the examinees’ estimated theta reached a predefined value (i.e., no substantial additional information was being gained). Scores were estimated via the expected a posteriori (EAP) method. After the test terminated, examinees were directed to another web page where they completed subsequent measures assessing the moderator and outcome measures of interest.
Measures
Demographics (8 items). Eight items were administered in phases 1 and 2 of data collection to assess participants’ age, gender, race, work experience, country of origin, native language, country of residence, and education. These data were collected to provide a
General reasoning (150 items). One hundred and fifty practice items for the Miller Analogies Test (MAT) formed the basis for phase 1 and 2 data collection. These items were developed to be used by individuals who are preparing to take the MAT (Study Mode, 2014). The MAT is a series of analogies which requires examinees to infer the relationship between two words and apply that relationship to another set of words. Examinees must select a word that completes the word pair that is most similar to the given word pair. An example item is “(____) : PUCCINI :: SCULPTURE : OPERA.” The response options for this item are “A. Cellini, B. Rembrandt, C. Wagner, D. Petrarch.”
The items that assessed the dependent and moderator variables were given only during phase 2, and were presented with Likert-type response scales, with scores ranging from 1 (strongly disagree) to 7 (strongly agree).
State test anxiety(8 items, α = .93). State test anxiety was measured via a modified eight-item measure from Hong and Karstensson (2002). Four items measure state worry, and four items measure state emotionality. An example item of state worry is “During the test I got so nervous that I forgot facts I really knew.” An example item of state emotionality is “During the test, I felt very tense.” The scale was modified by removing context-specific language from one item (i.e., “in the course”) and replacing it with more general language (i.e., “on the test”).
Goal orientation(8 items). Vandewalle’s (1997) performance goal orientation measure was used. This measures prove performance goal orientation (4 items, α = .81) and avoid performance goal orientation (4 items, α = .87). An example item for prove
my coworkers.” An example item for avoid performance goal orientation is “I would avoid taking on a new task if there was a chance that I would appear rather incompetent to others.”
Perceived test fairness (8 items, α = .84). Perceptions of test fairness were assessed via an eight-item measure adapted from Tonidandel et al. (2002). An example item is “Under the circumstances, the test was fair.” The test was modified by removing context-specific language in one item (i.e., “knowledge of general psychology”) and replacing it with more general language (i.e., “general reasoning”).
Feedback acceptance (4 items, α = .87). A four-item scale taken from Tonidandel et al. (2002) measured feedback acceptance. An example item is “I do not believe that the feedback is accurate.”
Manipulation check (4 items, α = .94). Four items were given to examinees to assess whether the experimental manipulations (i.e., the feedback conditions) were salient to
examinees. That is, these items were given to ensure that during the CAT, examinees who received feedback were aware that they were receiving it. These items included: “Each time I answered a test question, I received feedback about how I was doing on the test,” “I always knew how well I was doing while taking the test because of the feedback display,”
“Feedback was provided during the test to show my score,” and “During the test, there was feedback that gave me updates about my test score.”
Results
After participants were discarded based on the criteria of incomplete data and time spent on dependent and moderator variables, attention check items were used to check for careless respondents. No remaining participant in any condition answered more than one attention check incorrectly, so none were discarded based on this criterion. After the data were cleaned and reliabilities were estimated, skewness and kurtosis of all variables were checked to assess whether any assumptions of normality would be violated. All values were determined to be acceptable. Next, a one-way ANOVA was employed to assess the salience of the experimental manipulations to the examinees. Results indicated that participants in the text feedback condition (M = 5.69, SD = .93), the graph condition (M = 5.94, SD = 1.12), and the text and graph condition (M = 6.00, SD = .87) were significantly more likely than those in the control condition (M = 2.15) to indicate that they had received feedback (F (4, 345) = 245.82, p < .001). Thus, it was clear that the feedback manipulation was salient to
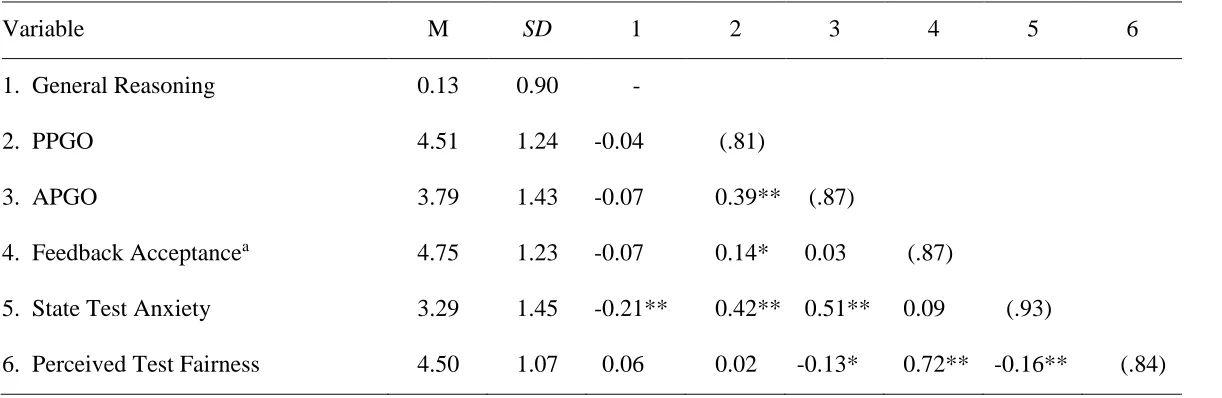
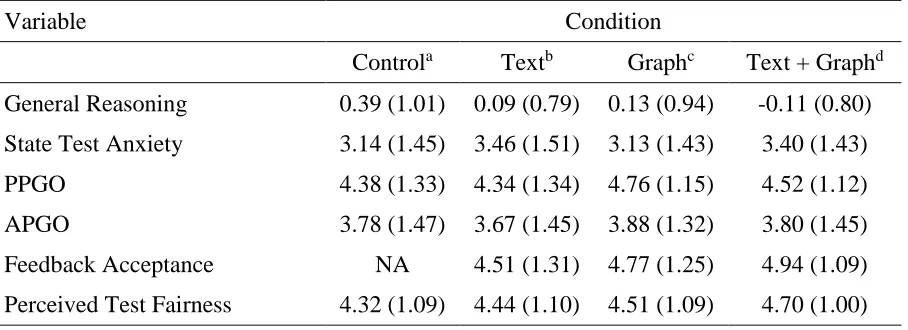
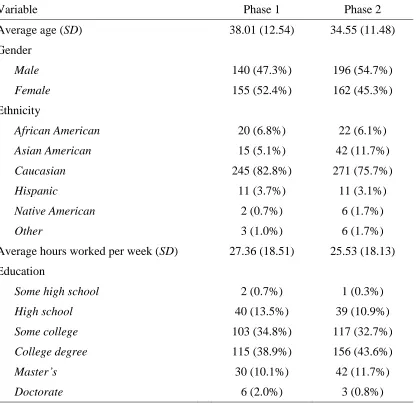
participants. Descriptive statistics and correlations among variables were calculated (Table 1). Descriptive statistics for dependent and moderator variables were calculated broken down by study condition (Table 2), and demographic variables were calculated by phase. As seen in Table 3, each sample provided a gender-balanced representation of working adults, which is a strength of the study and provides support for the generalizability of the results.
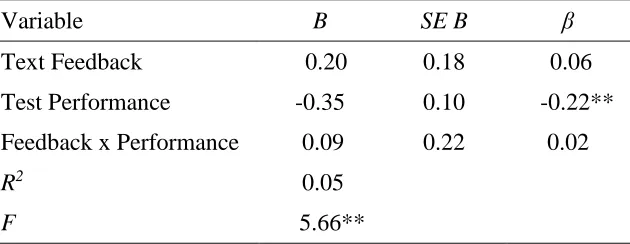
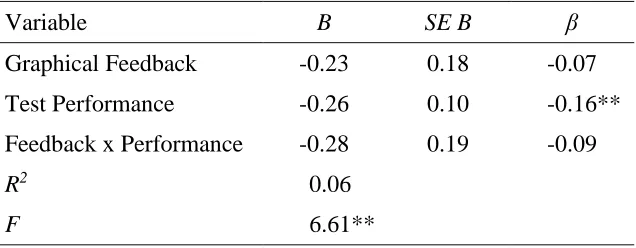
Separate regressions were necessary because feedback mode was dummy coded. Each regression compared one mode of feedback to the control condition. Though the overall models were significant, the interactions were not. Thus, hypothesis 1 was not supported. As seen by the significant beta values, test performance was the main contributor to the
significant overall models.
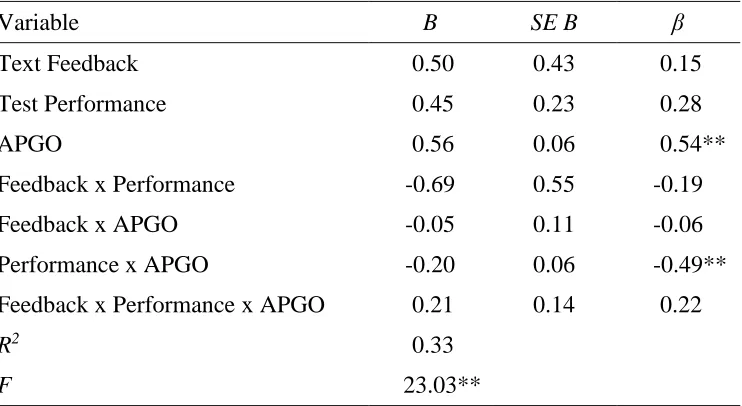
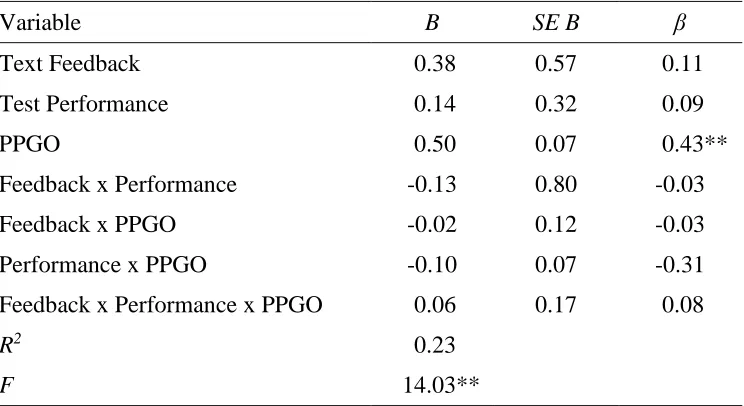
Hypothesis 2 was tested via linear regressions (Tables 7-12). Six three-way interactions between feedback, test performance, and performance goal orientation (three modes of feedback per type of goal orientation) were assessed. Of the six interactions tested, one was significant. The significant interaction occurred between prove performance goal orientation, test performance, and text and graphical feedback. Thus, hypothesis 2 was partially supported. The significant interaction is graphed in Figure 1. As seen in Figure 1, when text and graphical feedback were present, the magnitude of the differences in state test anxiety between higher and lower performers did not depend on their level of PPGO. When there was no text and graphical feedback present, the magnitude of the differences in state test anxiety between higher and lower performers was greater for participants who were higher in PPGO than lower in PPGO. This significant three-way interaction can be seen in Table 12. The main effects of both APGO and PPGO were the primary contributors to the significance of the overall models, as shown by their beta weights.
interactions were tested – one for each form of feedback. The interactions were not significant. Thus, hypothesis 3 was not supported.
Hypothesis 4 assessed the relationship between feedback acceptance and perceived test fairness among those who received feedback via a correlation. This correlation was significant (r = .72, p < .001). Thus, hypothesis 4 was supported.
Discussion
perceptions of fairness – one must evaluate the content and method of feedback to ensure that examinees will perceive it as accurate.
Upon further examination of the analyses, it is apparent that the primary determinants of the significance of the overall models that predicted state test anxiety were exam
performance and both forms of performance goal orientation. Though this wasn’t a primary avenue of research in this study, evidence suggests that, independent of any feedback
received, poorer performers and those who were more performance-goal oriented were more likely to be anxious during the test. The fact that item-by-item feedback has no effect on the nature of this relationship speaks to the ambiguity of the effect that feedback has had on state test anxiety in prior research. This has been manifest by many differing and, at times,
conflicting findings. There is evidence to suggest that moderators exist in this relationship, but based on the results of this research, it is unlikely that performance and performance goal orientation are them.
Regarding perceived fairness, this study’s results appear to have mixed support for previous research. In general, providing feedback on a test has resulted in higher evaluations of fairness. In this study, in only one of three conditions (i.e., the text and graphical feedback condition) did the presence of feedback relate to higher perceived test fairness. Perhaps due to the fact that there was simply more feedback present, and thus more detail and clarity, examinees were more confident in the fairness of their evaluation in this condition.
Though there was some support for this research, the overall narrative is that
served to distract participants from their current versus desired performance, rather than heightening their awareness to it. A basic assumption of human performance theory (HPT) is the idea of limited cognitive resources—that when people complete tasks, they draw from a finite amount of cognitive resources (Draycott & Kline, 1996). In this study, requiring participants to pay attention to many sources of feedback that displays information with which they may not have been familiar prior to this study, coupled with the task of
completing an ability test, could have required the use of too many cognitive resources for the feedback to truly be effective. To assess whether this may have been the case, a post hoc exploratory ANOVA comparing performance on the CAT for each feedback group was conducted. This analysis revealed that significant differences existed between groups (F (3, 335) = 4.33, p < .01). Post hoc comparisons showed that participants in the control condition (M = 0.38, SD = 1.01) scored significantly higher on the CAT than the participants in the text and graphical condition (M = -0.11, SD = 0.80). Though this alone is insufficient evidence for a deleterious effect of feedback, it raises the possibility that the cognitive resources spent analyzing the item-by-item feedback hindered participants’ attention to the ability test. Practical Implications
no main effect of feedback existed. Thus, when designing high-stakes tests and considering examinees’ state test anxiety and perceptions of test fairness, IRT-specific item-by-item feedback does not appear to be an effective intervention.
The follow-up tests of the effects of feedback on performance yielded interesting results – namely, that item-by-item feedback presented in graph and text format
simultaneously can hinder examinees’ performance. Though additional research is needed, these results indicate that examinees who receive item-by-item feedback could be
disadvantaged relative to those who do not receive feedback. This is an important matter, considering the criticality of whether exams function similarly across examinees. Prior research has revealed mixed results about the effect of feedback on performance (Kluger & DeNisi, 1996). In this case, it is unclear whether the deleterious effect of feedback was related to the content, complexity, or timing of the feedback. However, test makers and administrators who provide item-by-item feedback to examinees should consider the results of this study.
Limitations and Future Directions
This study was not without limitations. First, due to the complexity of the test, the study limited participation to those who currently reside in the United States and speak English as a primary language. As research has shown that people from different cultures can react differently to performance feedback (Earley, Gibson, & Chen, 1999), future research should explore the extent to which these results remain constant across various cultures.
verbal and via video (Alvero et al., 2008). Thus, future studies should assess the extent to which other modes of feedback are effective during testing. Third, though state test anxiety has typically been measured at the end of exams, it could be beneficial to assess anxiety levels on an item-by-item basis. This may serve to provide a more detailed picture of state test anxiety throughout the testing process. This could take the form of a mobile application or in-text Likert-type rating scales. Finally, this study heavily relied on an online unproctored ability test. Online exam security has proven to be a contentious issue, and research has demonstrated that examinees may cheat on unproctored online exams (Harmon, Lambrinos & Kennedy, 2008). Though steps were taken to deter participants from cheating, there was no definitive way of knowing whether participants utilized other resources during the test.
Conclusion
Among the decisions to be made when administering a high-stakes examination are 1) whether to give feedback to examinees, 2) when to give it to them, and 3) what information to include in the feedback. Though many of the hypothesized interactions were not
REFERENCES
Akca, F. (2011). The relationship between test anxiety and learned helplessness. Social Behavior and Personality: An International Journal, 39, 101-111.
Alam, M. M. (2013). A study of test anxiety, self-esteem, and academic performance among adolescents. IUP Journal of Organizational Behavior, 12, 33-43.
Alvero, A. M., Bucklin, B. R., & Austin, J. (2008). An objective review of the effectiveness and essential characteristics of performance feedback in organizational settings (1985-1998). Journal of Organizational Behavior Management, 21, 3-29. Arps, G. F. (1920). Work with knowledge of results versus work without knowledge of
results. Psychological Monographs, 28, 1-41.
Azzam, T., & Jacobson, M. R. (2013). Finding a comparison group: Is online crowdsourcing a viable option? American Journal of Evaluation, 34, 372-384.
Balcazar, F., Hopkins, B. L., & Suarez, Y. (1985). A critical, objective review of
performance feedback. Journal of Organizational Behavior Management, 7, 65-89. Bauer, T. N., Maertz, Jr., C. P., Dolen, M. R., & Campion, M. A. (1998). Longitudinal
assessment of applicant reactions to employment testing and test outcome feedback.
Journal of Applied Psychology, 83, 892-903.
Behrend, T. S., Sharek, D. J., Meade, A. W., & Wiebe, E. N. (2011). The viability of crowdsourcing for survey research. Behavior Research Methods, 43, 800-813.
Bies, R. J., & Moag, J. F. (1986). Interactional justice: Communication criteria of fairness. In R. J. Lewicki, B. H. Sheppard, & M. H. Bazerman (Eds.), Research on negotiations in organizations (Vol. 1, pp. 43–55). Greenwich, CT: JAI Press.
Bradshaw, G. D., & Gaudry, E. (1968). The effects of a single experience of success or failure on test anxiety. Australian Journal of Psychology, 20, 219-223.
Butler, A. C., Karpicke, J. D., & Roediger, H. L. (2007). The effect of type and timing of feedback on learning from multiple choice tests. Journal of Experimental Psychology, 13, 273-281.
Casler, K., Bickel, L., & Hackett, E. (2013). Separate but equal? A comparison of
participants and data gathered via Amazon’s MTurk, social media, and face-to-face behavioral testing. Computers in Human Behavior, 29, 2156-2160.
Chan, D., Schmitt, N., Jennings, D., Clause, C. S., & Delbridge, K. (1998). Applicant perceptions of test fairness: Integrating justice and self-serving bias perspectives.
International Journal of Selection and Assessment, 6, 232-239.
Clark, J. W., Fox, P. A., & Schneider, H. G. (1998). Feedback, test anxiety, and performance in a college course. Psychological Reports, 82, 203-208.
Cohen, M., Ben-Zur, H., & Rosenfield, M. J. (2008). Sense of coherence, coping strategies, and test anxiety as predictors of test performance among college students.
International Journal of Stress Management, 15, 289-303.
Dorans, N. J., & Holland, P. W. (2000). Population invariance and the equatability of tests: Basic theory and the linear case (RR-00-19). Washington, D. C.: Educational Testing Service. Retrieved from
http://www.ets.org/Media/Research/pdf/RR-00-19-Dorans.pdf
Draycott, S. G., & Kline, P. (1996). Validation of the AGARD STRES Battery of Performance Tests. Human Factors, 38, 347-361.
Dweck, C. S. (1986). Motivational processes affecting learning. American Psychologist, 41, 1040-1048.
Dweck, C. S., & Leggett, E. L. (1988). A social-cognitive approach to motivation and personality. Psychological Review, 95, 256-273.
Earley, P. C., Gibson, C. B., & Chen, C. C. (1999) “How did I do?” versus “How did we do?”: Cultural contrasts of performance feedback use and self-efficacy. Journal of Cross-Cultural Psychology, 30, 594-619.
Ergene, T. (2003). Effective interventions on test anxiety reduction: A meta-analysis. School Psychology International, 24, 313-328.
Folger, R., & Greenberg, J. (1985). Procedural justice: An interpretive analysis of personnel systems. Research in Personnel and Human Resources Management, 3, 141-183. Gilliland, S. W. (1993). The perceived fairness of selection systems: An organizational
justice perspective. Academy of Management Review, 18, 694-734.
Greenberg, J. (2011). Organizational justice: The dynamics of fairness in the workplace. In S. Zedeck (Ed.), APA handbook of industrial and organizational psychology, Vol 3: Maintaining, expanding, and contracting the organization (pp. 271-327).
Washington, DC US: American Psychological Association. doi:10.1037/12171-008 Harmon, O. R., Lambrinos, J., & Kennedy, P. (2008). Are online exams an invitation to
cheat? Journal of Economic Education, 39, 116-125.
Harper, A. (2008). Psychometric tests are now a multi-million-pound business: What lies behind a coach’s decision to use them? International Journal of Evidence Based Coaching and Mentoring, 2, 40-51.
Hansen, J. B. (1974). Effects of feedback, learner control, and cognitive abilities on state anxiety and performance in a computer-assisted instruction task. Journal of Educational Psychology, 66, 247-254.
Hong, E. (1998). Differential stability of individual differences in state and trait test anxiety.
Learning and Individual Differences, 10, 51-69.
Hong, E. & Karstensson, L. (2002). Antecedents of state test anxiety. Contemporary Educational Psychology, 27, 348-367.
Ilgen, D. R., Fisher, C. D., & Taylor, M. S. (1979). Consequences of individual feedback seeking on behavior in organizations. Journal of Applied Psychology, 64, 349-371. In’nami, Y. (2006). The effects of test anxiety on listening test performance. System: An
Judd, C. H. (1905). Practice without knowledge of results. Psychological Review Monographs, 2, 185-198.
Kluger, A. N., & DeNisi, A. (1996). The effects of feedback interventions on performance: A historical review, a meta-analysis, and a preliminary feedback intervention theory.
Psychological Bulletin, 119, 254-284.
Kuncel, N. R., Hezlett, S. A., & Ones, D. S. (2004). Academic performance, career potential, creativity, and job performance: Can one construct predict them all? Journal of Personality and Social Psychology, 86, 148-161.
Leventhal, G. S. (1980). What should be done with equity theory? New approaches to the study of fairness in social relationships. In K. J. Gergen, M. S. Greenberg, & R. H. Willis (Eds.), Social Exchange: Advances in Theory and Research: 27-55. New York, Plenum.
Lounsbury, J. W., Bobrow, W., & Jensen, J. B. (1989). Attitudes toward employment testing: Scale development, correlates, and “known-group” validation. Professional
Psychology: Research and Practice, 20, 340-349.
Nease, A. A., Mudgett, B. O., & Quiñones, M. A. (1999). Relationships among feedback sign, self-efficacy, and acceptance of performance feedback. Journal of Applied Psychology, 84, 806-814.
Putwain, D. W., Woods, K. A., & Symes, W. (2010). Personal and situational predictors of test anxiety of students in post-compulsory education. British Journal of Educational Psychology, 80, 137-160.
Sarason, I. G., & Sarason, B. R. (1990). Test anxiety. In H. Leitenberg (Ed.), Handbook of social and evaluative anxiety (pp. 475-496). New York: Plenum.
Smither, J. W., Reilly, R. R., Millsap, R. E., Pearlman, K., & Stoffey, R. W. (1993). Applicant reactions to selection procedures. Personnel Psychology, 46, 49-76. Study Mode, LLC (2014). Majortests.com Miller Analogies Test Prep. Retrieved from
http://www.majortests.com/mat/miller-analogies-test-practice.php.
Tonidandel, S., Quiñones, M. A., & Adams, A. A. (2002). Computer-adaptive testing: The impact of test characteristics on perceived performance and test takers’ reactions.
Journal of Applied Psychology, 87, 320-332.
University of Cambridge (2014). Concerto platform for the development of on-line adaptive tests. Retrieved from http://www.psychometrics.cam.ac.uk/newconcerto.
Vandewalle, D. (1997). Development and validation of a work domain goal orientation instrument. Educational and Psychological Measurement, 57, 995-1015.
van Vianen, A. E. M., Taris, R., Scholten, E., & Schinkel, S. (2004). Perceived fairness in personnel selection: Determinants and outcomes in different stages of the assessment procedure. International Journal of Selection and Assessment, 12, 149-159.
von der Embse, N., Barterian, J., & Segool, N. (2013). Test anxiety interventions for children and adolescents: A systematic review of treatment studies from 2000-2010.
Wise, S. L., Plake, B. S., Eastman, L. A., Boettcher, L. L., & Lukin, M. E. (1986). The effects of item feedback and examinee control on test performance and anxiety in a computer-administered test. Computers in Human Behavior, 2, 21-29.
Table 1
Descriptive Statistics and Correlations among Study Variables
Variable M SD 1 2 3 4 5 6
1. General Reasoning 0.13 0.90 -
2. PPGO 4.51 1.24 -0.04 (.81)
3. APGO 3.79 1.43 -0.07 0.39** (.87)
4. Feedback Acceptancea 4.75 1.23 -0.07 0.14* 0.03 (.87)
5. State Test Anxiety 3.29 1.45 -0.21** 0.42** 0.51** 0.09 (.93)
6. Perceived Test Fairness 4.50 1.07 0.06 0.02 -0.13* 0.72** -0.16** (.84)
Table 2
Means and Standard Deviations of Moderator and Outcome Variables by Study Condition
Variable Condition
Controla Textb Graphc Text + Graphd
General Reasoning 0.39 (1.01) 0.09 (0.79) 0.13 (0.94) -0.11 (0.80) State Test Anxiety 3.14 (1.45) 3.46 (1.51) 3.13 (1.43) 3.40 (1.43)
PPGO 4.38 (1.33) 4.34 (1.34) 4.76 (1.15) 4.52 (1.12)
APGO 3.78 (1.47) 3.67 (1.45) 3.88 (1.32) 3.80 (1.45)
Feedback Acceptance NA 4.51 (1.31) 4.77 (1.25) 4.94 (1.09) Perceived Test Fairness 4.32 (1.09) 4.44 (1.10) 4.51 (1.09) 4.70 (1.00)
Table 3
Demographic Variables by Phase
Variable Phase 1 Phase 2
Average age (SD) 38.01 (12.54) 34.55 (11.48)
Gender
Male 140 (47.3%) 196 (54.7%)
Female 155 (52.4%) 162 (45.3%)
Ethnicity
African American 20 (6.8%) 22 (6.1%)
Asian American 15 (5.1%) 42 (11.7%)
Caucasian 245 (82.8%) 271 (75.7%)
Hispanic 11 (3.7%) 11 (3.1%)
Native American 2 (0.7%) 6 (1.7%)
Other 3 (1.0%) 6 (1.7%)
Average hours worked per week (SD) 27.36 (18.51) 25.53 (18.13) Education
Some high school 2 (0.7%) 1 (0.3%)
High school 40 (13.5%) 39 (10.9%)
Some college 103 (34.8%) 117 (32.7%)
College degree 115 (38.9%) 156 (43.6%)
Master’s 30 (10.1%) 42 (11.7%)
Table 4
Regression Analysis Predicting State Test Anxiety from Text Feedback and Test Performance
Variable B SE B β
Text Feedback 0.20 0.18 0.06
Test Performance -0.35 0.10 -0.22** Feedback x Performance 0.09 0.22 0.02
R2 0.05
F 5.66**
Table 5
Regression Analysis Predicting State Test Anxiety from Graphical Feedback and Test Performance
Variable B SE B β
Graphical Feedback -0.23 0.18 -0.07
Test Performance -0.26 0.10 -0.16** Feedback x Performance -0.28 0.19 -0.09
R2 0.06
F 6.61**
Table 6
Regression Analysis Predicting State Test Anxiety from Text and Graphical Feedback and Test Performance
Variable B SE B β
Text+Graph Feedback 0.13 0.18 0.04
Test Performance -0.35 0.10 -0.22**
Feedback x Performance 0.11 0.22 0.03
R2 0.05
F 5.36**
Table 7
Regression Analysis Predicting State Test Anxiety from Text Feedback, Test Performance, and Avoid Performance Goal Orientation
Variable B SE B β
Text Feedback 0.50 0.43 0.15
Test Performance 0.45 0.23 0.28
APGO 0.56 0.06 0.54**
Feedback x Performance -0.69 0.55 -0.19
Feedback x APGO -0.05 0.11 -0.06
Performance x APGO -0.20 0.06 -0.49**
Feedback x Performance x APGO 0.21 0.14 0.22
R2 0.33
F 23.03**
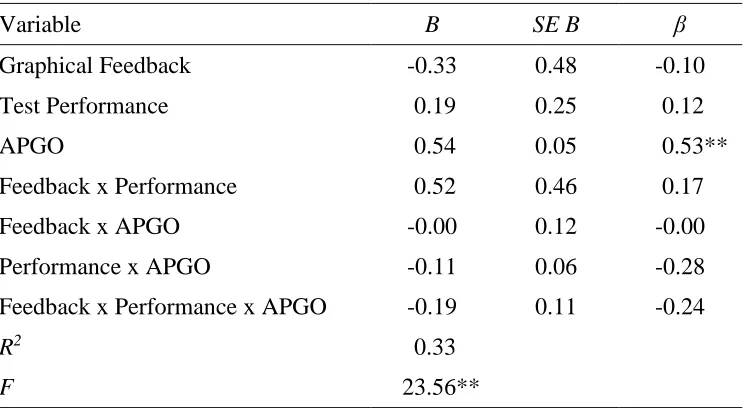
Table 8
Regression Analysis Predicting State Test Anxiety from Graphical Feedback, Test Performance, and Avoid Performance Goal Orientation
Variable B SE B β
Graphical Feedback -0.33 0.48 -0.10
Test Performance 0.19 0.25 0.12
APGO 0.54 0.05 0.53**
Feedback x Performance 0.52 0.46 0.17
Feedback x APGO -0.00 0.12 -0.00
Performance x APGO -0.11 0.06 -0.28
Feedback x Performance x APGO -0.19 0.11 -0.24
R2 0.33
F 23.56**
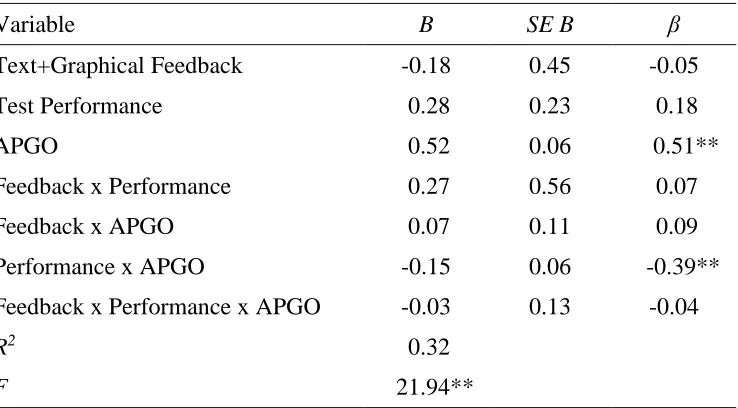
Table 9
Regression Analysis Predicting State Test Anxiety from Text and Graphical Feedback, Test Performance, and Avoid Performance Goal Orientation
Variable B SE B β
Text+Graphical Feedback -0.18 0.45 -0.05
Test Performance 0.28 0.23 0.18
APGO 0.52 0.06 0.51**
Feedback x Performance 0.27 0.56 0.07
Feedback x APGO 0.07 0.11 0.09
Performance x APGO -0.15 0.06 -0.39**
Feedback x Performance x APGO -0.03 0.13 -0.04
R2 0.32
F 21.94**
Table 10
Regression Analysis Predicting State Test Anxiety from Text Feedback, Test Performance, and Prove Performance Goal Orientation
Variable B SE B β
Text Feedback 0.38 0.57 0.11
Test Performance 0.14 0.32 0.09
PPGO 0.50 0.07 0.43**
Feedback x Performance -0.13 0.80 -0.03
Feedback x PPGO -0.02 0.12 -0.03
Performance x PPGO -0.10 0.07 -0.31
Feedback x Performance x PPGO 0.06 0.17 0.08
R2 0.23
F 14.03**
Table 11
Regression Analysis Predicting State Test Anxiety from Graphical Feedback, Test Performance, and Prove Performance Goal Orientation
Variable B SE B β
Graphical Feedback 0.50 0.68 0.15
Test Performance 0.11 0.32 0.07
PPGO 0.54 0.06 0.46**
Feedback x Performance 0.04 0.80 0.01
Feedback x PPGO -0.20 0.14 -0.28
Performance x PPGO -0.08 0.07 -0.24
Feedback x Performance x PPGO -0.05 0.16 -0.08
R2 0.24
F 15.13**
Table 12
Regression Analysis Predicting State Test Anxiety from Text and Graphical Feedback, Test Performance, and Prove Performance Goal Orientation
Variable B SE B β
Text+Graphical Feedback -0.68 0.65 -0.20
Test Performance 0.41 0.33 0.25
PPGO 0.46 0.06 0.39**
Feedback x Performance -1.30 0.72 -0.35
Feedback x PPGO 0.18 0.14 0.25
Performance x PPGO -0.16 0.07 -0.47*
Feedback x Performance x PPGO 0.30 0.15 0.39*
R2 0.23
F 14.32**
Table 13
Regression Analysis Predicting Perceived Test Fairness from Text Feedback and Test Performance
Variable B SE B β
Text Feedback -0.09 0.14 -0.04
Test Performance 0.03 0.07 0.02
Feedback x Performance 0.22 0.17 0.08
R2 0.01
Table 14
Regression Analysis Predicting Perceived Test Fairness from Graphical Feedback and Test Performance
Variable B SE B β
Graphical Feedback 0.04 0.14 0.02
Test Performance 0.11 0.08 0.09
Feedback x Performance -0.15 0.15 -0.07
R2 0.01
Table 15
Regression Analysis Predicting Perceived Test Fairness from Text and Graphical Feedback and Test Performance
Variable B SE B β
Text+Graph Feedback 0.32 0.14 0.13*
Test Performance 0.05 0.07 0.05
Feedback x Performance 0.20 0.16 0.08
R2 0.02
F 2.67*
Figure 1. Three-way interaction between feedback (text and graphical), performance, and prove performance goal orientation (PPGO).
1 1.5 2 2.5 3 3.5 4 4.5 5
Lower PPGO (-1 SD) Higher PPGO (+1 SD)
S tate T est Anx iety No Feedback Higher Performance Lower Performance 1 1.5 2 2.5 3 3.5 4 4.5 5
Lower PPGO (-1 SD) Higher PPGO (+1 SD)
S tate T est Anx iety
Text and Graph Feedback
Higher Performance
Appendix A
Depictions of Feedback Displays
Appendix B
DISSERTATION PROPOSAL:
ABSTRACT
GASPERSON, SEAN MORGAN. The effects of item-by-item feedback during a computer adaptive test. (Under the direction of Lori Foster Thompson.)
The effects of item-by-item feedback during a computer adaptive test
by
Sean Morgan Gasperson
A dissertation submitted to the Graduate Faculty of North Carolina State University
in partial fulfillment of the requirements for the Degree of
Doctor of Philosophy
Psychology
Raleigh, North Carolina 2014
APPROVED BY:
_____________________ _____________________ _____________________ Dr. Adam W. Meade Dr. Mark A. Wilson Dr. S. Bartholomew Craig
_________________________ Dr. Lori Foster Thompson
LIST OF FIGURES ...57 LIST OF TABLES ...58 Introduction ...59 Test Feedback ...59 State Test Anxiety ...62 Perceived Test Fairness...66 Method ...70 Participants ...70 Design ...70 Procedure ...71 Measures ...74 Proposed Analyses ...76 References ...79 Appendix B, Table 1 ...85 Appendix B, Figure 1. Hypothesized interaction between feedback and test performance on
state test anxiety. ...86 Appendix B, Figure 2. Hypothesized three-way interaction between feedback, performance,
and performance goal orientation. PGO = Performance Goal Orientation. Note. This interaction will be tested for two types of PGO (prove and avoid). ...87 Appendix B, Figure 3. Hypothesized interaction between feedback and test performance on
LIST OF FIGURES
Appendix B, Figure 1. Hypothesized interaction between feedback and test performance on state test anxiety. ... 86 Appendix B, Figure 2. Hypothesized three-way interaction between feedback, performance,
and performance goal orientation. ... 87 Appendix B, Figure 3. Hypothesized interaction between feedback and test performance on
perceived test fairness. ... 88 Appendix B, Figure 4. Hypothesized interaction between feedback and feedback acceptance
LIST OF TABLES
Introduction
Many factors can affect test takers in high-stakes testing environments such as pre-employment testing or university entrance exams. Each year, decision makers and
psychometricians spend a substantial amount of money selecting and developing tests for administration to applicants (Harper, 2008). Test design is vital to consider due to the potential ramifications of (a) examinees responding to test characteristics in different ways, and (b) examinees having adverse reactions to aspects of the test. Among the decisions involved in designing a test are whether to give examinees feedback, when to give feedback to them, and how to give feedback to them. These decisions could affect examinees’ anxiety levels during the test as well as how fair they perceive the test to be. However, there is a dearth of literature devoted to this topic, particularly in the context of computer adaptive testing. The purpose of this study is to assess the effect of various modes of item-by-item feedback on examinees’ state test anxiety and perceptions of test fairness during a computer adaptive test in a high-stakes testing situation.
Test Feedback
performance” (p. 255). Giving examinees feedback typically refers to providing them with some sort of report of their performance at the end of the test. However, researchers have explored the extent to which more complex characteristics of the feedback (e.g., content, frequency, mode, and source) affect outcomes such as performance on a particular task or job (for reviews, see Alvero, Bucklin, & Austin, 2008 and Balcazar, Hopkins, & Suarez, 1985).
Two dimensions on which feedback can vary are the timing of the feedback (i.e., when it is administered) and the mode of feedback (i.e., how the feedback is displayed to the test taker). Feedback is typically given at the end of the test or later, though some research has been devoted to assessing the effect of giving feedback after examinees complete each item (e.g., Butler, Karpicke, & Roediger, 2007; Clark, Fox, & Schneider, 1998). This
research, though practical, is lacking in two ways. First, the content of the feedback is limited to whether examinees answered the item correctly or incorrectly. Second, the research has been mainly focused on examinees’ preference for the timing of feedback and how delayed versus immediate feedback affects performance on the task (e.g., Butler et al., 2007). Other outcomes, such as examinees’ test anxiety and perceptions of the test’s fairness, should be explored.
Feedback can also vary by how it is given or displayed to the examinees. In
conducting a literature review on the effect of various forms of feedback, Alvero et al. (2008) identified four primary methods of providing feedback: text, verbal, graphical, and
feedback effects. Text feedback that was accompanied by graphical feedback, however, was effective in 86% of the studies. Thus, research suggests that coupling text feedback with graphical feedback is more effective. Like feedback timing, however, research on feedback mode has primarily focused on performance- and satisfaction-based outcomes.
Computer adaptive testing and item response theory (IRT) provide a valuable
fairness. Furthermore, research has yet to examine whether known text and/or graphical feedback effects extend to tests that provide said feedback on an item-by-item basis. State Test Anxiety
Test anxiety has been operationalized as emotional, physiological, and behavioral responses to the potential consequences of negative outcomes on a test or exam (Zeidner, 1998). Test anxiety is induced when test takers perceive that the demands of the test situation exceed their intellectual, motivational, and/or social capabilities (Sarason & Sarason, 1990). Research on the topic has addressed a variety of concerns, including interventions for test anxiety (e.g., Ergene, 2003), personal and situational predictors of test anxiety (e.g., Putwain, Woods, & Symes, 2010), its relationship with various constructs such as learned helplessness (e.g., Akca, 2011), and perhaps most notably, its relationship with task performance (see Alam, 2013; Cohen, Ben-Zur, & Rosenfield, 2008; In’nami, 2006). Test anxiety can
generally be divided into state test anxiety and trait test anxiety. State test anxiety refers to an anxious, temporary condition specific to a particular testing situation, while trait test anxiety refers to a more stable tendency to have anxiety across any testing situation (Hong, 1998).
item feedback in reducing state test anxiety, some researchers have found that contrary to what was hypothesized, feedback increased state test anxiety (Wise, Plake, Eastman, Boettcher, & Lukin, 1986). Conversely, other researchers have shown that providing feedback to participants has resulted in significant reductions in state test anxiety over time (e.g., Hansen, 1974). Other research has reported no relationship between immediate feedback and test anxiety (Clark et al., 1998; DiBattista & Gosse, 2006). Thus, though researchers have explored the relationship between feedback and state test anxiety, there appears to be little consensus as to what effect, if any, it has. These inconsistencies in research can be evidence of a moderating effect, such that feedback’s effects on state test anxiety may be contingent on a third variable. How well examinees perform on the test could serve as this moderator. High and low performers on tests may react differently to feedback due to the differing amounts of positive reinforcement they receive. Though performance's moderating influence on feedback's effects has not been examined, the effect of providing end-of-exam performance reports on anxiety has. Bradshaw and Gaudry (1968) found that experiencing failure can result in higher state test anxiety, and experiencing success can result in lower state test anxiety. Participants were randomly assigned to fail or succeed on the test, and received performance feedback at the end of testing. Those who received feedback of poor performance reported higher test anxiety, and those who received feedback of high performance reported lower test anxiety. This research, however, did not assess whether higher and lower performers react differently to real-time feedback.
discrepancy (or lack thereof) between their current performance and their desired
performance (Kluger & DeNisi, 1996). For better performers, this discrepancy will be lower. For poorer performers, it will be higher. Furthermore, feedback that gives examinees a more detailed item-by-item account of their performance and how their abilities are being
estimated heightens examinees’ awareness of that discrepancy. The typical alternative, giving examinees their score at the end of the test, does not have the capacity to influence state test anxiety throughout the testing situation because examinees may not be completely certain how many items they answered correctly or incorrectly. Thus, for poorer performers, detailed item-by-item feedback should lead to higher levels of state test anxiety. For better
performers, detailed item-by-item feedback should lead to lower levels of test anxiety. Although some research has been devoted to assessing the main effect of feedback on state test anxiety (e.g., DiBattista & Gosse, 2006; Hansen, 1974), the moderating effect of performance on the relationship between feedback and state test anxiety during a test that provides ongoing item-level feedback throughout the test has not been examined.
Hypothesis 1: Test performance will moderate the effect of item-by-item feedback on
state test anxiety, with feedback reducing anxiety for better performers and increasing anxiety for poorer performers.
The expected effects for Hypothesis 1 are displayed in Figure 1. As prior research has
There may be types of individuals for whom the moderating effect of test
performance is especially likely. In particular, examinees oriented toward performance goals may be particularly sensitive to feedback conveying performance failures and successes. As an overall construct, goal orientation refers to how people react to opportunities to
demonstrate or develop ability (Dweck, 1986). Goal orientation can be divided into learning goal orientation (i.e., seeking to master and acquire new skills) and performance goal orientation (i.e., seeking opportunities to demonstrate or validate one’s competence; Dweck & Leggett, 1988). Vandewalle (1997) further differentiated performance goal orientation into
prove performance goal orientation and avoid performance goal orientation. Prove
performance goal orientation is one’s tendency to seek opportunities that may demonstrate competence, while avoid performance goal orientation is one’s tendency to avoid situations that may disprove competence. In a meta-analysis examining the relationship of goal
orientation dimensions and proximal and distal outcomes, Payne, Youngcourt, and Beaubien (2007) found that individuals with high levels of avoid performance goal orientation and prove performance goal orientation were likely to have high levels of state test anxiety. As item-by-item feedback provides immediate knowledge of results, individuals who are high in performance goal orientation (both avoid and prove) and receive feedback indicating that they are performing poorly on the test should exhibit especially high levels of state test anxiety.
Hypothesis 2: There will be a three-way interaction between feedback, test
performance, and performance goal orientation on state test anxiety, such that
those more oriented toward avoid performance (H2a) and prove performance (H2b) goals.
Figure 2 displays the expected effects. Perceived Test Fairness
Moving beyond state test anxiety, feedback’s influence over other outcome variables is also important to consider. Perceptions of a test’s fairness, in particular, warrants
consideration. Perceptions of test fairness can be understood by examining the organizational justice literature. Organizational justice has been a popular area of research throughout recent years. It refers to “people’s perceptions of fairness in organizations along with their
associated behavioral, cognitive, and emotional reactions” (Greenberg, 2011, p. 271). Three primary types of organizational justice have been identified – distributive justice, procedural justice, and interactional justice (Bierhoff, Cohen, & Greenberg, 1986; Bies & Moag, 1986; Folger & Greenberg, 1985). Procedural justice (i.e., the perceived fairness of the processes that are used when organizational decisions are made; Folger & Greenberg, 1985) is thought to be composed of ten “rules” which, when violated, lead to perceptions of injustice
(Gilliland, 1993; Leventhal, 1980). As pre-employment testing is included in the organizational decision-making process (more specifically, the hiring process), much research about procedural justice focuses on perceptions of test fairness.
higher evaluations of fairness (Lounsbury, Bobrow, & Jensen, 1989). Furthermore, other research has shown a significant effect of feedback on post-feedback fairness perceptions (van Vianen, Taris, Scholten, & Schinkel, 2004). Feedback, when given throughout the test, provides information to examinees regarding how they are performing and how their final scores are calculated. Particular to computer adaptive testing, item-by-item feedback can facilitate examinees’ understanding of how their scores are calculated by providing
information about the scoring process. In essence, rather than simply providing a final score after testing, information such as real-time ability (i.e., theta) estimates, the precision with which the examinees’ ability is being estimated (i.e., standard error of measurement), and the difficulty of the items can be given to the examinee, providing transparency and clarity about the methods of item response theory. This transparency is a defining characteristic of
procedural justice – namely, facilitating examinees’ knowledge about the how the tests are selected, constructed, and used (Gilliland, 1993).