LETTER Earth Planets Space,52, 1095–1100, 2000
A block-fault model for deformation of the Japanese Islands derived from
continuous GPS observation
Manabu Hashimoto1, Shin’ichi Miyazaki2, and David D. Jackson3
1RCEP, Disaster Prevention Research Institute, Kyoto University, Gokasho, Uji, Kyoto 611-0011, Japan 2Geographical Survey Institute, Kitasato 1, Tsukuba, Ibaraki 305-0811, Japan
3Department of Earth and Space Sciences, UCLA, Los Angeles, CA 90095-1567, U.S.A.
(Received February 3, 2000; Revised August 3, 2000; Accepted August 9, 2000)
We interpret the continuous GPS data for the Japanese islands from 1996 to 1999 using the model of Hashimoto and Jackson (1993). In this model crustal deformation is represented by a combination of rigid block motions and deformation due to slip deficits along the fault-bounding blocks. Hashimoto and Jackson used 19 blocks, 104 faults, and geodetic data spanning 100 years. In the present work we assume the same fault and block geometry, and we use only the continuous GPS data. Compared to the previous study, the motions of the major blocks are a bit larger: 107±8 mm/yr for the Pacific plate, 47±2 mm/yr for the Philippine Sea plate, and 24±2 mm/yr for the Izu block, all relative to the Amurian plate. The estimated slip directions on active inland faults are now more consistent with geological estimates. Slip deficit rates exceed 10 mm/yr along the Itoigawa-Shizuoka Tectonic Line, Shinanogawa Seismic Zone, Atotsugawa fault, Hanaori fault, Arima-Takatsuki Tectonic Line, Rokko faults, Median Tectonic Line, and southern boundary of the Beppu-Shimabara graben. Some interplate faults along the Japan and Kurile trenches have slip deficit rates larger than 100 mm/yr, although postseismic deformation from the 1994 Far Off Sanriku earthquake may contaminate these estimates. An interplate fault off Kyushu has a negative slip deficit, possibly due to post-seismic movements from the 1996 events in Hyuganada.
1.
Introduction
Earthquake hazard studies for the Japanese Islands require precise estimates of the slip rates of active faults. In the past these estimates have been made primarily on the basis of geomorphological and geological studies such as excavation and boring around active faults. However, these estimates give average rates for thousands of years or longer, and some processes with a much shorter time scale may affect the earth-quake potential. Therefore a method with higher temporal resolution must be developed.
Geodetic data offer the desired temporal resolution and they may be used in some places where faults are exposed poorly or not at all. Geodetic data have been collected for 100 years in Japan. Furthermore, the recent deployment of continuous GPS observation network by the Geographical Survey Institute of Japan (hereafter GSI) improved the tem-poral resolution of the observed crustal deformations. Thus we can improve the temporal resolution of earthquake po-tential by estimating motions of active inland faults using geodetic data.
Hashimoto and Jackson (1993) used a block and fault model to estimate motions of active inland faults. They es-timated velocities of blocks and slip deficit rates on their bounding faults in and around the Japanese Islands by ana-lyzing triangulation and trilateration data spanning 100 years. In this study, we will analyze continuous GPS data during the
Copy right cThe Society of Geomagnetism and Earth, Planetary and Space Sciences (SGEPSS); The Seismological Society of Japan; The Volcanological Society of Japan; The Geodetic Society of Japan; The Japanese Society for Planetary Sciences.
recent three years with the same block-fault model to show the applicability of their method. Furthermore we compare our results with their previous ones in order to examine the possibility of temporal changes in motions of active faults.
2.
Data and Model
Scholz and Fitch (1969) introduced the concept of ‘virtual slip’, which is equivalent to slip deficit, to explain inter-seismic deformation around the San Andreas Fault. On the other hand, Savage and Burford (1970, 1973) fit a disloca-tion model with a shallow locked zone to trianguladisloca-tion data in California. Savage (1983) first proposed a kinematic model to explain deformations in subduction zones. Matsu’uraet al.(1986) integrated these methods and made them applica-ble to transform faults and divergent plate margins as well as subduction zones. Our model closely resembles that of Matsu’uraet al.
In our model, the observed velocity at any point on a crustal block is represented as the sum of rigid motion of the whole block and elastic deformation due to locking of bounding faults. We refer to the horizontal component of the rigid motion of the whole block as “block velocity”. At each point on the boundary between two blocks, we com-pute the vector difference in block velocities, and resolve this vector into fault parallel (“block slip”) and fault normal (“block convergence”) components. We also allow for aseis-mic slip on each fault, whose parallel and normal components are “surface creep” and “surface convergence”, respectively. The “slip deficit” is then the vector difference between the relative block velocity and the aseismic slip. For practical
1096 M. HASHIMOTOet al.: BLOK-FAULT MODEL FOR THE JAPANESE ISLANDS
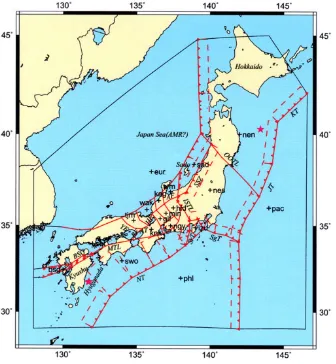
Fig. 1. Block and fault model of the Japanese Islands after Hashimoto and Jackson (1993). Solid red lines denote block boundaries, which coincide with the upper margin of faults. Rectangles with dashed sides are projections of dipping fault planes onto the surface. Triangles show the dip directions of faults. Purely vertical faults are denoted by simple solid lines. Black lines are outer boundaries of the region under consideration. Crosses with abbreviations of name of blocks indicate points where the velocities of blocks are estimated. Green italic characters denote geographical names of regions, islands, trenches, and faults. Abbreviations are as follows: OOTL, the Oga-Ojika Tectonic Line; SSZ, the Shinanogawa Seismic Zone; ISTL, the Itoigawa-Shizuoka Tectonic Line; KT, Kurile trench; JT, Japan trench; SgT, Sagami trough; SrT, Suruga trough; AF, the Atotsugawa fault; HF, the Hanaori fault; AT, the Arima-Takatsuki Tectonic Line; RF, the Rokko faults; YF, the Yamasaki fault; MTL, the Median Tectonic Line; NT, Nankai trough; BSG, the Beppu-Shimabara Graben. Stars are epicenters of the 1994 Far Off Sanriku earthquake and the 1996 events in Hyuganada.
purposes we divide each fault into fairly small rectangular segments, assuming that the block slip, block convergence, surface creep, and surface convergence are all uniform on each segment. The elastic component of deformation is proportional to the slip deficit on each fault segment, so a fully creeping segment generates no elastic deformation. The block velocities and slip deficit rates are estimated from the geodetic data, while the block slip, block convergence, surface creep, and surface convergence are linear functions of the block velocity and slip deficit rate.
Figure 1 shows the block and fault geometry assumed by Hashimoto and Jackson (1993). Solid lines indicate surface traces of boundary faults, dashed rectangles attached to some boundaries show the projection onto the Earth’s surface in case of inclined faults, and triangular ticks denote their dip directions. Like Hashimoto and Jackson we assume that all faults have uniform slip and their upper margins reach the Earth’s surface. Depths of lower margin are assumed to be 30∼40 km for faults along the Sagami, Suruga, and Nankai troughs, 20 km for the others. Hashimoto and Jackson
as-sumed a lower depth of 20 km for the Japan trench to obtain a much betterfit to the century old geodetic data, and here we adopted the same value. Dip angles are assumed to be 10∼30◦ for subduction zones and 70◦ for inland inclined faults. Refer to Hashimoto and Jackson (1993) to see the detailed model configuration.
M. HASHIMOTOet al.: BLOK-FAULT MODEL FOR THE JAPANESE ISLANDS 1097
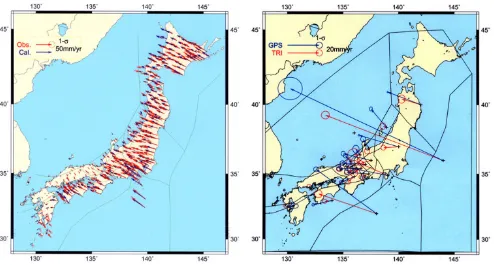
Fig. 2. Observed velocities of continuous GPS sites operated by the Geo-graphical Survey Institute during 1996–1999 (red arrows), and velocities predicted from the present model (blue arrows). Those of about 300 selected sites are plotted. Error ellipses for the observed velocities are 1-σ. The observed velocities have been converted to those referring to the Amurian plate by using relative motion between Amurian and Eurasia plates estimated by Hekiet al.(1999).
They ultimately adopted loose constraints, and we do too. On the other hand, normal components of relative block motions at the surface are prohibited and hence are tightly constrained to zero at vertical faults.
For geodetic data we use the velocity of each continuous GPS observation site of GEONET, operated by GSI, during the period from 1996 to 1999. Following Miyazaki and Heki (2000), we convert site velocities into those relative to the Amurian plate by using the relative motion of the Amurian plate to the Eurasia plate estimated by Heki et al.(1999) (Fig. 2). Hashimoto and Jackson used a different kinematic reference frame based on VLBI site velocities relative to Shanghai, China. Hence, all block velocities were estimated also to be relative to Shanghai. Although they considered Shanghai to be attached to the Eurasian plate, recent space geodetic measurements revealed that Shanghai is moving as a part of another tectonic block, the South China block, by about 12 mm/yr to the east relative to the stable interior of the Eurasian plate (Hekiet al., 1999). The location of the bound-ary between the South China block and the Amurian plate is debated, but the relative velocity of South China is esti-mated to be about 4 mm/yr to the east relative to the Amurian plate (Hekiet al., 1999). Hence, there may be differences of about 4 mm/yr in the eastward components between the resultant block motions and those by Hashimoto and Jackson (1993). Because of the difference in the reference frames, absolute block velocities in the present model are not strictly comparable to those of Hashimoto and Jackson. However, differences in relative motions between blocks (that is, block
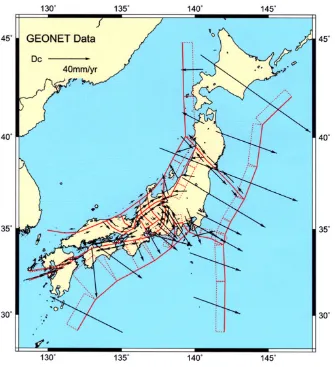
Fig. 3. Inverted block motions by using GPS data (Blue arrows). Red arrows show the block motions derived from triangulation and trilateration data by Hashimoto and Jackson (1993). Error ellipses for both block motions are 1-σ.
slip, block convergence, creep, and slip deficit) are quite in-sensitive to reference frames, and they can be compared di-rectly from one model to the other. Furthermore, differences in block velocities of more than 4 mm/yr are very unlikely to be caused entirely by changes in reference frame, so such differences must come from the geodetic data themselves. Such differences may imply a real change in strain rate be-tween the 100 year and 3 year averages, or they may result from the fact that the denser GPS data detect features of the deformation that were not sampled in the triangulation and trilateration data.
3.
Features of the Derived Results from
Continu-ous GPS Data
Resolution given by the observed data is 41%, which is significantly higher than that in the previous study. It is because the number of data points is larger for GPS and they cover much wider area including isolated islands than the conventional geodetic data.
1098 M. HASHIMOTOet al.: BLOK-FAULT MODEL FOR THE JAPANESE ISLANDS
Fig. 4. Slip deficit rates of block boundary faults derived from GPS data.
are significantly larger than the results in the previous study. That of the Izu block is estimated to be 24±2 mm/yr. The difference between the Izu block and the Philippine Sea plate is larger than that in the previous study, which supports the previous conclusion that the Izu block may not belong to the rigid portion of the Philippine Sea plate.
As mentioned above, the block velocities in the two mod-els are not strictly comparable because they depend on differ-ent reference frames. However, the velocity differences are quite large and they vary considerably from block to block. Therefore we suspect that these differences are not simply attributed to the difference in referring plates. One of the special features obtained in this study is that small blocks aligned from Sado (sad) to northern Kinki (knk) have veloc-ities of several mm/yr in the NNW direction.
As in the previous study, large block slips occur in the NE-SW trending zone from the west coast of northern Honshu to central Kyushu through the Chubu and Kinki districts. However, the magnitude of slip is significantly larger in the present study. Block slips in the central and southern parts of the Itoigawa-Shizuoka Tectonic Line are also significantly larger in this study.
On most faults the block convergence is larger here than in Hashimoto and Jackson (1993). We observe significant block convergence, not seen in the previous study, along the
block boundaries north of Sado Island. The convergence might be simply attributed to the existence of data on Sado Island, where triangulation and trilateration data were not available in the previous study. Tada (1984, 1985) inferred north-south spreading along the Beppu-Shimabara graben, which is considered an east-west trending rift zone in central Kyushu, but Hashimoto and Jackson did not find such rifting. We don’t find it either. However, the present model has one large block, which includes southern Kyushu, south of the Median Tectonic Line. This geometry might prevent rifting in the current model. We must examine its possibility with finer block division in a future model.
Oga-M. HASHIMOTOet al.: BLOK-FAULT MODEL FOR THE JAPANESE ISLANDS 1099
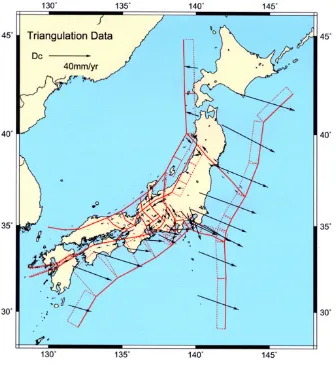
Fig. 5. Slip deficit rates derived from triangulation and trilateration data by Hashimoto and Jackson (1993).
Ojika Tectonic Line in northern Japan, a situation that is not likely to characterize the long-term average motion. Instead, post-seismic deformation due to the 1994 Far Off Sanriku earthquake may still dominate the deformation.
Slip deficit rates along the Japan trench (150±12 mm/yr) and the Kurile trench (136±12 mm/yr) exceed 100 mm/yr, which is significantly larger than that in Hashimoto and Jackson (1993). The southward slip deficit on plate boundary faults along the Nankai trough exceeds that in the previous study. Furthermore, a negative slip deficit, which implies strain release, appears in the plate boundary fault eastward off Kyushu. The negative deficit may be attributed to the postseismic movements due to the Hyuganada earthquakes in late 1996.
A comparison of the observed GPS velocities with those predicted by the present model is shown in Fig. 2. The model explains well the observed velocities in Honshu. However, large discrepancies are recognized in Hokkaido and Kyushu. Notably, the observed velocities are 2 to 3 times larger than predicted in northern Hokkaido. On the contrary, the pre-dicted velocities are larger in southwestern Hokkaido. In southern Kyushu the directions of the predicted velocities differ strongly from the observed.
4.
Possibility of Temporal Variation in Slip Deficit
Rates and Future Problems
Temporal variations of slip deficit would have important consequences for earthquake hazard estimation. At present, most models (including ours) neglect temporal variations in strain rate. However, Hashimoto (2000) and others have pointed out that mechanical interaction between faults causes
fluctuation in strain accumulation. Therefore we must care-fully examine the differences between the previous and present results.
We did not model post-seismic deformations explicitly nor correct the GPS data for their effects. Thus post-seismic de-formation is treated like secular dede-formation in our model, and our modeled deformation rates may therefore differ from the long-term average in some regions. In particular, ob-served velocities from northern Tohoku and southern Kyushu are probably affected by post-seismic deformations. To sep-arate post-seismic effects from secular deformation we must either have a much longer time series, or independent infor-mation on either post-seismic or secular deforinfor-mation.
1100 M. HASHIMOTOet al.: BLOK-FAULT MODEL FOR THE JAPANESE ISLANDS
strain rates are larger than those derived from GPS. Ishikawa and Hashimoto used calculated distances between control points from their adjusted coordinates. On the other hand, Hashimoto and Jackson (1993) used angle change rates in the triangulation network. Since angle changes are insensitive to scale, the coordinates estimated from triangulation data may contain large errors resulting from small errors in the assumed length of a few baselines. We can help to resolve this dilemma in the future by testing the predictions of the present model against the triangulation and trilateration data use in the earlier paper.
We suspect that inappropriate block division may cause some discrepancies between predicted and observed GPS velocities. Hashimoto and Jackson (1993) omitted data from Hokkaido because they suspected contamination by frequent large off-shore earthquakes there. For that reason they did not include faults in Hokkaido in their block model. Hashimoto and Tada (1988) pointed out that Hokkaido could be divided into several tectonic provinces on the basis of strain, which requires block division in Hokkaido. Concerning southern Kyushu, the model with only one block south of the Median Tectonic Line is troublesome. The model fails to explain the Hyuganada earthquakes, which occurred inside the large block. Clearly we must in the future divide this block into at least two parts around Hyuganada.
We use 20 km for the lower depth of plate boundary faults along the Japan trench. Recent studies of continuous GPS data (e.g. Nishimuraet al., 1999; Itoet al., 2000) show that significant slip deficits are distributed in the deeper portion of the interface between the plates. Kawasakiet al.(1998) esti-mated the average recurrence time of strain release, including both seismic and aseismic events, to be about 30 years. Thus the 100-year time span of Hashimoto and Jackson (1993) may cover several seismic cycles, and their estimated strain rates may be significantly lower than the long-term interseis-mic rates. These low strain rates are favorable to smaller faults along the Japan trench. Therefore we must estimate the optimal depth of the lower margin by inverting GPS data with different depths to discuss the interplate coupling along the Japan trench.
The most difficult problem is which faults should be intro-duced to the model. We welcome any proposal on the basis of results of studies such as active faults, crustal structure, and so on.
5.
Summary
We interpret the continuous GPS data for the Japanese Is-lands from 1996 to 1999 using the model of Hashimoto and Jackson (1993). Compared to the previous study, our esti-mated block velocities and slip deficits are generally larger. Slip deficit rates exceed 10 mm/yr along the Itoigawa-Shizuoka Tectonic Line, Shinanogawa Seismic Zone, Atot-sugawa fault, Hanaori fault, Arima-Takatsuki Tectonic Line, Rokko faults, Median Tectonic Line and southern boundary of the Beppu-Shimabara graben. Some interplate faults along the Japan and Kurile trenches slip more than 100 mm/yr, al-though postseismic deformation from the 1994 Far Off San-riku earthquake may contaminate these estimates. The
esti-mated directions of slip on active inland faults are now more consistent with geological estimates. An interplate fault off Kyushu has a negative slip deficit, possibly due to postseis-mic movements from the 1996 events in Hyuganada.
Acknowledgments. We thank Drs. James Savage and Takao Tabei for their critical comments. This study was initiated during MH’s stay in UCLA supported by the Leadership Supporting Fund of DPRI, Kyoto University, in FY1998. This study was also partly sup-ported by the Grand-Aid for Scientific Research (C) No. 10640407. Allfigures were prepared with the Generic Mapping Tools devel-oped by Wessel and Smith (1991).
References
Hashimoto, M., Horizontal strain rates in the Japanese islands during inter-seismic period deduced from geodetic surveys (Part I): Honshu, Shikoku and Kyushu,Zisin,43, 13–26, 1990 (in Japanese with English abstract). Hashimoto, M., Complexity in the recurrence of large earthquakes in south-western Japan: a simulation with an interacting fault system model,Earth Planets Space,52, 2000 (in press).
Hashimoto, M. and D. D. Jackson, Plate tectonics and crustal deformation around the Japanese Islands,J. Geophys. Res.,98, 16149–16166, 1993. Hashimoto, M. and T. Tada, Horizontal crustal movements in Hokkaido and
its tectonic implications,Zisin,41, 29–38, 1988 (in Japanese with English abstract).
Heki, K., S. Miyazaki, H. Takahashi, M. Kasahara, F. Kimata, S. Miura, N. F. Vasilenko, A. Ivashchenko, and K. An, The Amurian plate motion and current plate kinematics in eastern Asia,J. Geophys. Res.,104, 29147–
29155, 1999.
Ishikawa, N. and M. Hashimoto, Average horizontal crustal strain rates in Japan during interseismic period deduced from geodetic surveys (Part 2), Zisin,52, 299–315, 1999 (in Japanese with English abstract).
Ito, T., S. Yoshioka, and S. Miyazaki, Interplate coupling in northeast Japan deduced from inversion analysis of GPS data,Earth Planet. Sci. Lett.,
176, 117–130, 2000.
Kawasaki, I., Y. Asai, and Y. Tamura, Interplate moment release in seis-mic and seismo-geodetic bands and the seismo-geodetic coupling in the Sanriku-Oki region along the Japan trench—A basis of mid-term/long-term prediction—,Zisin,50,Supplement, 293–307, 1998 (in Japanese with English abstract).
Matsu’ura, M., D. D. Jackson, and A. Cheng, Dislocation model for aseismic crustal deformation at Hollister, California,J. Geophys. Res.,91, 12661–
12674, 1986.
Miyazaki, S. and K. Heki, Crustal Velocity Field of Southwest Japan: Sub-duction and Arc-arc Collision,J. Geophys. Res., 2000 (submitted). Nishimura, T., S. Miyazaki, T. Sagiya, T. Tada, S. Miura, T. Hirasawa,
and K. Tanaka, Spatio-temporal distribution of interplate coupling east off Tohoku district—deduced from GPS observation forfive years—, Program and Abstracts, Seismol. Soc. Jpn., 1999, Fall Meeting, B65, 1999 (in Japanese).
Savage, J. C., A dislocation model of strain accumulation and release at a subduction zone,J. Geophys. Res.,88, 4984–4996, 1983.
Savage, J. C. and R. O. Burford, Accumulation of tectonic strain in Califor-nia,Bull. Seismol. Soc. Amer.,60, 1877–1896, 1970.
Savage, J. C. and R. O. Burford, Geodetic determination of relative plate motion in central California,J. Geophys. Res.,78, 832–845, 1973. Scholz, C. H. and T. J. Fitch, Strain accumulation along the San Andreas
fault,J. Geophys. Res.,74, 6649–6666, 1969.
Tada, T., Spreading of the Okinawa trough and its relation to the crustal de-formation in Kyushu,Zisin,37, 407–415, 1984 (in Japanese with English abstract).
Tada, T., Spreading of the Okinawa trough and its relation to the crustal de-formation in Kyushu, 2, Zisin,38, 1–12, 1985 (in Japanese with English abstract).
Wessel, P. and W. H. F. Smith, Free software helps map and display data, EOS Trans. Amer. Geophys. U.,72, 441, 445–446, 1991.