R E S E A R C H
Open Access
Integrative visual analysis of protein sequence
mutations
Nadezhda T Doncheva
1,2*, Karsten Klein
3, John H Morris
2, Michael Wybrow
4, Francisco S Domingues
5,
Mario Albrecht
6,7,8From
3rd IEEE Symposium on Biological Data Visualization
Atlanta, GA, USA. 13-14 October 2013
Abstract
Background:An important aspect of studying the relationship between protein sequence, structure and function is the molecular characterization of the effect of protein mutations. To understand the functional impact of amino acid changes, the multiple biological properties of protein residues have to be considered together.
Results:Here, we present a novel visual approach for analyzing residue mutations. It combines different biological visualizations and integrates them with molecular data derived from external resources. To show various aspects of the biological information on different scales, our approach includes one-dimensional sequence views, three-dimensional protein structure views and two-three-dimensional views of residue interaction networks as well as aggregated views. The views are linked tightly and synchronized to reduce the cognitive load of the user when switching between them. In particular, the protein mutations are mapped onto the views together with further functional and structural information. We also assess the impact of individual amino acid changes by the detailed analysis and visualization of the involved residue interactions. We demonstrate the effectiveness of our approach and the developed software on the data provided for the BioVis 2013 data contest.
Conclusions:Our visual approach and software greatly facilitate the integrative and interactive analysis of protein mutations based on complementary visualizations. The different data views offered to the user are enriched with information about molecular properties of amino acid residues and further biological knowledge.
Introduction
Understanding and predicting the effect of amino acid mutations on the structure and function of a protein is still a challenging problem despite recent advances [1,2]. In the case of multiple sequence changes, it is even more difficult to distinguish the mutations with a significant effect from the ones without. Many approaches that tackle this problem have been presented in the last cou-ple of years as reviewed in [3-8]. Computational methods such as the well-known SIFT tool [9] use evolutionary conservation derived from a multiple sequence alignment to predict that mutations of highly conserved residues have a considerable impact on function. Other methods such as the well-established PolyPhen2 tool [10] combine
sequence features with structural and physico-chemical protein properties to assess the effect of a mutation. A notable disadvantage of most tools is that that they do not provide the user with a fine-grained control over the set of features used for the prediction, and the results are often difficult to interpret. In addition, those tools cannot easily cope with the speed at which new information on sequences, structures, and functions is made publicly available.
Thus, the BioVis contest selected this area of research for the 2013 data challenge. The organizers posed the question how protein function depends on the underlying protein sequence and whether it is possible to predict the effect of sequence changes. They also encouraged the use of visualization and data integration as the key to solving the problem. In particular, given the sequence of a func-tionally defective triosephosphate isomerase mutant
* Correspondence: nadezhda.doncheva@mpi-inf.mpg.de
1Max Planck Institute for Informatics, 66123 Saarbücken, Germany
Full list of author information is available at the end of the article
(dTIM) and its parent, the yeast triosephosphate isomerase (scTIM), the task was to identify the mutations that abol-ish its function.
For our entry to the BioVis 2013 data contest challenge, we focused on improving the integrative visualization of a wide variety of available information on sequences, struc-tures and functions. Our objective was to provide the bio-logical data for a manual visual analysis and interactive exploration by the user in an integrated fashion by making it accessible through a small number of carefully designed, linked views. In this way, the user is able to generate hypotheses based on a specific view (e.g. of the protein structure) in the context of the other linked views and the provided data. As there are many biological aspects of pro-tein sequence mutations that might affect propro-tein structure and function, we developed visualizations that provide dif-ferent levels of detail and enriched them by mapping addi-tional data onto the graphical representations. We aimed at a generic solution that is suitable for a wide range of proteins and will support a comprehensive analysis of the impact of mutations for a large class of sequence changes. This was accomplished by a visual analytics approach inte-grating several software tools into a prototypic implemen-tation freely available at the RINalyzer webpage [11].
As detailed below, we applied our approach to the data provided for the BioVis 2013 data contest. For this proof-of-concept study, we assessed the sequence changes between scTIM and dTIM by different visualizations of the protein structure together with further functional and structural information and by an exploratory analysis based on the complementary network views for both sequences.
Methods
General concept and views
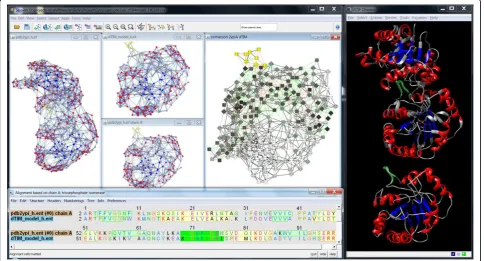
To offer the available information to the user on different levels of abstraction and to support interactive synchro-nized exploration (Figure 1), we have carefully selected suitable visualizations as described in the following:
First, we use the standard representations of the three-dimensional (3D) structure and sequence of proteins as provided by UCSF Chimera [12,13] because sequence changes and their impact on the structure might give valuable insight. UCSF Chimera offers a variety of tools that support the interactive crosstalk between sequences and structures, affording advanced exploration of multi-ple sequence alignments, comparison of structures and incorporation of user-specific data. In particular, the
user can study the amino acid changes between two sequences and their locations on the corresponding pro-tein structures. It is also possible to construct a struc-ture-based sequence alignment from the superposition of two structures. This deep integration of sequences and structures is further complemented by a multitude of molecular graphics features.
Second, we apply the RINerator tool [14] to create a two-dimensional (2D) residue interaction network (RIN) from the protein structure and visualized the RIN with the help of RINalyzer [14] within the Cytoscape plat-form [15]. Such a network representation is very useful to demonstrate the impact of mutations at the detailed residue interaction level by highlighting the changes of local interactions as well as long-range interaction paths, e.g. indirect interactions between residues.
Third, we offer less complex, aggregated overviews that focus on functional or structural subunits like sec-ondary structure elements and illustrate the location and distribution of the mutations on the protein struc-ture. In particular, we utilize the cartoon view as pro-vided by the Pro-origami web service [16]. The main advantage of this view is that it gives a clear depiction of the chain and the secondary structure elements, while it leaves out the exact spatial location and the interrela-tions between those elements, which are provided by the other more detailed views. As the visual mapping from a RIN to the corresponding cartoon might be diffi-cult for the user, a network representation that shows the RIN together with aggregated secondary structure elements can be created as an intermediate visualization. Fourth, we extract additional structural and functional information from external databases and map these data as visual cues onto the visualizations. Functional residue
annotations such as protein domain localization as well as binding and catalytic sites are important for identify-ing mutations that could have a direct impact on the function of the protein because they are in or near such sites. Structural properties of residues such as hydropho-bicity, solvent accessible surface area, and polarity are used to characterize their potential effect on protein structure and function. Last but not least, evolutionary conservation information is crucial for distinguishing between residue changes in conserved (less tolerable of sequence changes) or variable regions.
Finally, the linkage between the different views is main-tained by several mechanisms. Regarding the interactive exploration, we propagate the selection of elements in one view to the others. We synchronize orientation and loca-tion between RINs and structures using a special layout algorithm that we developed for this purpose. In particu-lar, we want to ensure a consistent use of information mapping and similar cues over all views. All of the above is accomplished by adapting and extending our plugins RINalyzer [14] and structureViz [17] to integrate the freely available software tools Cytoscape, UCSF Chimera, and Pro-origami into a prototypic implementation (Figure 2). Download links and further documentation can be found at the RINalyzer webpage [11].
RIN view and layout
The residue interaction networks (RINs) are generated by RINerator from a 3D protein structure as described pre-viously and shown as standard network visualization within Cytoscape using RINalyzer [14,18]. In this visualization, network nodes represent amino acid residues and edges depict non-covalent residue interactions. To transfer the spatial localization information of the mutations from the
structure view to the network view, we replaced the pre-vious force-directed layout algorithm by a more appropriate stress minimization variant (Figure 1 and 3).
The new layout method is distance-based, i.e., allows specifying distances between the residues. During the layout computation, it minimizes the weighted mean square error between the given distances for pairs of residues and the geometric distance in the layout with an emphasis on local accuracy. The layout is initialized using a projection of the 3D coordinates on a 2D plane based on the UCSF Chimera view perspective. To allow for a flexible representation of the residue network and, at the same time, to preserve the user’s spatial orienta-tion using the fixed projecorienta-tion coordinates, we compute the stress as a balanced combination of both and increase the priority for the latter over the course of the optimization. In order to emphasize the secondary structure, the distance error weights are larger for dis-tances between residues within the same secondary structure element. Alternatively, the layout method can prioritize certain distances based on user-defined edge
weights that represent additional structural or functional information.
Aggregated views
The aggregated views are intended to give the user a quick overview on the mutation locations with respect to specific known structural or functional regions. While it would be possible to map additional information directly onto the network representation, the RIN might become quite complex for the user. Thus, we utilize views that aggregate regions based on secondary structures, protein domain information, or functional annotations. These views serve as an intermediate visualization when switching between the 3D structure view and the 2D RIN view.
The simple cartoon view provided by the Pro-origami web service reduces the complex 3D protein structure to the essential secondary and super-secondary structure information and presents it with an easily readable layout (Figure 1). Pro-origami provides SVG images, which are enriched with further information in the form of high-lighted regions of interest such as the localization of
mutated residues. As Pro-origami can decompose proteins into domains, we can also obtain a combined representa-tion of secondary structure and protein domains within the cartoon view.
Comparison view
The representation of protein structures as RINs enables network comparison and alignment to explore the dif-ferences between parent and mutant structures further. Besides the comparison of two networks or structures side-by-side, we provide a comparison network view based on the alignment of the underlying sequences (Figure 4). In this view, each node represents a pair of aligned residues and two nodes are connected if the cor-responding residues have a non-covalent interaction in either of the two compared RINs. We use visual cues to highlight interactions that were gained or lost upon amino acid change, and we score the fraction of such interactions for each residue to quantify the mutational effect on protein structure and function.
Furthermore, to distinguish more or less likely muta-tions, we integrated the amino acid substitution scores
from the Blosum62 matrix [19] in RINalyzer and assigned a score to each mutated residue in the comparison net-work. Each score can be used to highlight sequence changes with a stronger impact on the protein.
Data enrichment
An important component of our visual analytics approach is the mapping of available knowledge onto the visualized sequences and structures. The availability of this information in an easily accessible way while the user works with the different views should facilitate the biolo-gical knowledge discovery considerably. This is accom-plished by importing the relevant data as node attributes in Cytoscape, which automatically associates them with the RIN and the protein structure. An additional benefit of this integration is that it enables the use of the built-in Cytoscape functionality to create filters based on the imported data and to highlight the residue nodes with attribute values within a given range, e.g. with high or low conservation scores (see Figure 5).
Therefore, in addition to the data given in the contest, we generated or retrieved data from multiple external
sources to enrich our visualizations. The following infor-mation is regarded as potentially useful for protein analysis:
• Family conservation. ConSurf-DB [20] provides pre-computed profiles of evolutionary sequence conservation.
•Residue interactions. The RINerator package creates a network of noncovalent residue interactions such as contacts and hydrogen bonds for any 3D protein structure.
•Functional sites. Active and binding site information is retrieved manually from UniProtKB [21].
•Domain annotation. Protein domain information is obtained from the SCOP [22] online resource. •Structural properties. Data for the solvent accessible surface area, secondary structure, hydrophobicity, and other structural properties is retrieved automatically from UCSF Chimera.
Visual cues
The data used to enrich our visualizations is mapped as visual cues like color, shape, or line stroke in the network view and transferred to the other views where possible.
Furthermore, the differences caused by the mutations can be highlighted by such cues in all visualizations.
We decided to control most visual properties via user-adjustable options with reasonable defaults. For example, different node shapes are used to distinguish the mutated residues in both the parent and the defective protein (Figure 3). Additionally, several visual styles are offered that map different functional and structural information on the views so that the user sees the distribution of cor-responding values for the whole protein. Dark colors usually correspond to significant values such as strong hydrophobicity, large solvent accessible surface area or high number of changed residue interactions (Figure 4). For evolutionary conservation, the pink-to-turquoise col-oring as applied by ConSurf-DB is used (Figure 5).
The visual cues are particularly useful for illustrating the changes in residue interactions due to the mutations in the comparison network view generated from the alignment of the respective sequences in UCSF Chi-mera. Residue interactions that are either lost or gained upon mutation are highlighted by differently colored and shaped lines (Figure 4). Residues that cannot be aligned are depicted by nodes with different node borders.
Linkage and coordination of views
To ease the user’s cognitive load when switching between different views and tools, we link them in multiple important ways. For an interactive exploration, we imple-mented a global selection concept, that is, the selection of elements in one view leads to the immediate selection of their corresponding representatives in all other views. Our linkage concept also ensures the consistent use of information mapping and similar cues over all views, par-ticularly, regarding the usage of colors.
Further coordination is achieved due to the synchro-nized orientation and location of the graphical represen-tations in the different views. For instance, the user can freely explore the 3D structure within the UCSF Chi-mera window, e.g. by rotating the protein structure. The network view can then be adjusted according to the new orientation of the rotated structure by applying the 3D-structure based RIN layout described above.
In order to implement the full linkage between Cytos-cape and UCSF Chimera, we made use of their new software versions. We also ported the plugins RINalyzer and structureViz to work with Cytoscape 3, which also allowed us to link them closely. For example, while the direct communication between Cytoscape and UCSF Chimera is handled by structureViz, the structure-based layout algorithm is implemented in RINalyzer and invokes structureViz to retrieve the current spatial coordinates.
Results and discussion
Visual analytics approach
Our visual analytics approach assists the user’s reason-ing about the biological impact of mutations by interac-tive visualizations of sequence and structure information enriched with additional biological knowledge such as evolutionary sequence conservation and functional annotations. To show the different aspects of the data, we combine the well-known 3D structure view and the one-dimensional sequence view with the 2D RIN view. In addition, we create simplified network representa-tions to enable the user to focus on certain biological aspects, e.g. protein domains, secondary structure ele-ments, and functional annotations.
Besides the sequence that is given as input, a variety of information is available that can be used to interpret the functional effects of sequence changes. This includes sequence conservation, which might point to highly con-served regions responsible for some function, protein domain information, functional annotations (e.g. on molecular binding), structural properties such as hydro-phobicity and solvent accessible surface area, and already known mutations and their impact. We incorpo-rate a number of sources for such information in our approach as described above and map the data mainly
as visual cues on top of the graphical representations of the protein structure and the RINs. In addition, we make use of the network representation provided by RINalyzer as well as the Cytoscape analysis capabilities to facilitate data exploration by filtering and combining the available information on individual residues.
Furthermore, to present sequence changes on the struc-ture and residue interaction level simultaneously, we pro-vide both a single cumulative view and two separate views of the parent and the defective mutant side-by-side. While a single view facilitates the identification of changed sites, the dual view solution allows the user to identify the struc-tural impact of the changes, for example, lost residue interactions might alter the protein structure.
A general analysis workflow is presented in Figure 6. Normally, the user starts with one or more experimen-tally determined protein structures and retrieves or gen-erates RINs for them. In case only sequences are available, external tools for predicting the 3D structure could be used instead. External data such as evolution-ary conservation and functional annotations need to be prepared in a format compatible with Cytoscape and the RIN specifications. Then the data is loaded by the user into Cytoscape and UCSF Chimera. Further views such as the secondary structure cartoon, the aggregated sec-ondary structure network or the comparison network can be created from within Cytoscape. The sequences of the structures can be displayed and manipulated from within UCSF Chimera. Functional annotations and evo-lutionary conservation have to be imported manually into Cytoscape as node attributes of the RINs, while structural properties can be retrieved automatically from the protein structures currently opened in UCSF Chi-mera. These data can then be applied to create the visual cues and semi-automatically propagate them to the different views. Finally, by browsing and filtering the data in Cytoscape and UCSF Chimera, the user can identify relevant amino acids, in particular, mutated resi-dues with a potentially strong effect on the protein func-tion. Even if the visual analysis does not immediately reveal the functional consequences of mutations, our software will provide the user at least with very useful biological indications for the molecular analysis and further experiments.
Contest use case
the differences between the sequences in complementary views.
For scTIM, we retrieved the 3D structure from the RCSB Protein Data Bank [23] [PDB:2YPI] and down-loaded the precomputed RIN from the RINdata web ser-vice [14]. Since there is no experimentally resolved protein structure of dTIM, we used the SCWRL Server [24] at BIC-JCSG with default settings and the parent structure as template to generate a three-dimensional model. A RIN for the defective mutant was created from the modeled structure by our RINerator package.
External data such as functional annotations, conser-vation information and structural properties was parsed and imported as attributes in Cytoscape to allow for mapping the data as visual cues on the network and structure views. The UCSF Chimera sequence tool was used to view, align and explore the parent and defective
TIM sequences. Based on the sequence alignment, the nodes representing mutated residues were depicted as diamonds instead of circles (Figure 3). Especially muta-tions of residues buried in the structure or close to the functional sites might have a relatively strong impact on protein stability and function. Different node coloring schemes were prepared to map the different types of structural and functional information. This allowed us to identify relevant mutations with functional effects.
Thus, we could conclude from the visualizations that most mutations are located in more variable regions on the sur-face of the protein. Thus, mutated residues with strong conservation (F11, L13, Q82, I83, I109, K134, K135, L174, A175, D180, A212, N213, V226) might be responsible for the functional deficit of the mutant (Figure 5).
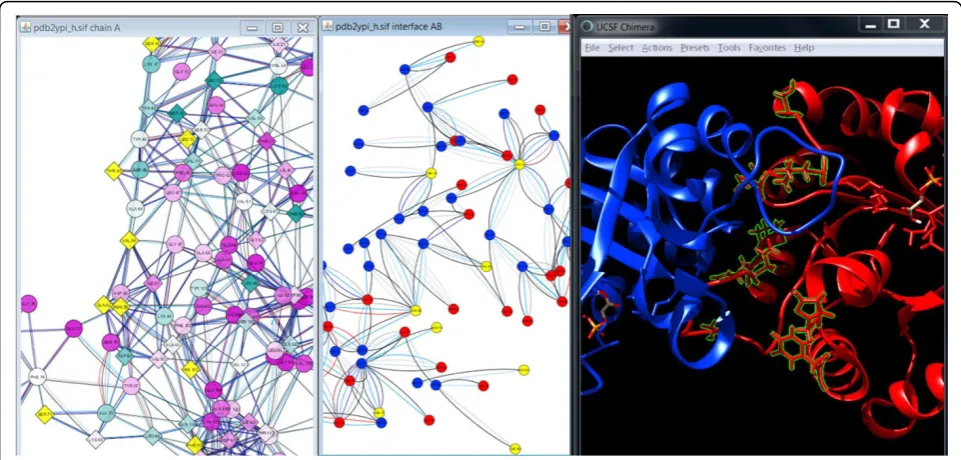
Since scTIM functions as a dimer, another important aspect is the binding interface between the two mono-mers. We used RINalyzer to extract the residue interac-tions of the interface and visualized them in a separate network view. As can be seen in Figure 7, 9 out of the 69 residues are mutated (L13, S16, T45, S71, N78, Q82, V86, H103, F108). These changes might impair the dimer formation and thus affect the function of scTIM. Residue L13 is particularly interesting as it is both con-served and in the dimer interface. A similar analysis can be performed with other functional sites. For instance, we found that none of the residues in the active or sub-strate binding site (N10, K12, H95, E165) are mutated. However, 24 residues possess direct non-covalent inter-actions with functionally important residues and thus could have a severe impact on their function if mutated. This is the case for the residues F11, L13, and C41, and this observation is further strengthened by the fact that the first two of them are conserved as described above.
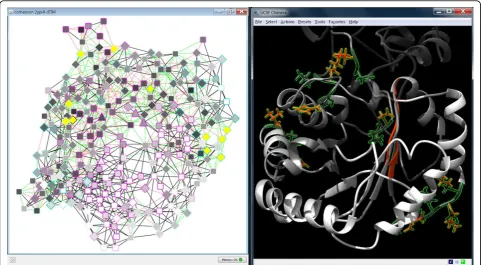
The comparison network view provided further infor-mation about the location and nature of the mutations (Figure 8). From the overall distribution of red and
green edges that indicate changes of non-covalent inter-actions, it is apparent that many mutations lead to a large number of differences primarily on the protein surface. Additionally, the active site residues form differ-ent interactions with their neighbors in the pardiffer-ent com-pared with the mutant structure. Furthermore, there is an insertion (E156 in dTIM) and a deletion (A30 in scTIM) in the dTIM sequence in contrast to the parent sequence according to the sequence alignment in UCSF Chimera. However, they are not close to the active site or the dimer binding interface and thus the functional effect is difficult to judge. Finally, the residue nodes in Figure 8 are colored according to the fraction of interac-tions they gained or lost upon mutation.When combin-ing this information with the conservation scores mapped to the node border colors, particularly interest-ing mutations can be found. Mutations with the largest change of local residue interactions are highlighted in Figure 8 (A30, S31, I32, E34, N35, L68, N78, K89, S100, V154 in scTIM and E156 in dTIM), and the mutated residue with a high conservation score (N78) is especially conspicuous.
By combining the different views and data in an interac-tive fashion, it became possible to pinpoint a number of residue mutations as candidates for having a pronounced effect on the enzymatic activity of dTIM. Further experi-mental validation will be needed to determine which mutations have to be replaced in the mutant by amino Figure 7Visualization of the dimer interface with focus on the mutated residues. The combined visualization of the conservation-colored RIN of chain A of scTIM (left), the residue nodes in the interface between chain A (red) and chain B (blue) of scTIM (middle), and the ribbon representation of scTIM are in the same colors as provided by UCSF Chimera (right). Mutations located in the dimer interface (V86, T45, S71, S16, Q82, N78, L13, H103, F108) are highlighted by yellow colored nodes in the network views and by green boundaries and ball-and-stick
acids from the parent to rescue functionality. Other struc-tural properties such as hydrophobicity, solvent accessible surface area or polarity can also be mapped onto the RIN view to characterize mutations with particular properties. Another strategy described in our previous work [18] would be the application of network topology analysis of the RIN for the detection of important residues.
Conclusions
We presented a novel approach for the integrative visual analysis of protein sequence mutations. We extended sev-eral existing software tools and combined different visuali-zations in such a way that biological information can be exchanged between them and additional external data can be included. We also devised a new layout algorithm for the RINs provided by the RINalyzer app in Cytoscape. Additionally, we created a new aggregation network view, improved and enriched the existing comparison network view, incorporated an interface to the Pro-origami web service, and fully utilized the interface to the UCSF Chi-mera tool through the structureViz app.
In the future, to assess the usefulness and effectiveness of our approach and to improve the current implemen-tation, we intend to collect more user feedback. This will result in a comprehensive evaluation which visual cues are best suited for gaining insight into the impact of mutations, how they should be best mapped onto the sequence, structure, and network representations, and how they should be integrated into the visual layout. Another issue is the aggregation of network regions to reduce the visual complexity as only some of them might be of actual interest to assess the potential impact of mutations. In this way, patterns of mutations with specific functional consequences might become more apparent, in particular, when multiple proteins are analyzed.
We also plan to improve the software integration of the different tools such that our approach can be rea-lized in an automated fashion. This includes better syn-chronization over linked views and automated retrieval of external data.
Competing interests
The authors declare that they have no competing interests.
Authors’contributions
NTD and KK drafted the paper. NTD, KK, MA, and FSD were involved in the design of the project. NTD, KK, JHM, and MW carried out the
implementation. All authors edited, read and approved the manuscript.
Acknowledgements
We gratefully acknowledge the dataset provided by Thomas Magliery and Brandon J. Sullivan at The Ohio State University for the purpose of the BioVis 2013 contest. NTD was partially funded by a Boehringer Ingelheim Fonds travel grant, and her research was also conducted in the context of the DFG-funded Cluster of Excellence for Multimodal Computing and Interaction. KK was financially supported by Australian Research Council Linkage grant H2814 A4421, Tom Sawyer Software and NewtonGreen Technologies, JHM by NIGMS P41-GM103311, MW by the Australian Research Council Discovery Project grant DP110101390, and MA by the projects GANI MED and BioTechMed-Graz.
Declarations
Publication costs were covered by the Resource for Biocomputing, Visualization, and Informatics at the University of California, San Francisco, the School of Information Technologies at The University of Sydney (Tom Sawyer ARC Grant), and the Max Planck Society.
This article has been published as part ofBMC ProceedingsVolume 8 Supplement 2, 2014: Proceedings of the 3rd Annual Symposium on Biological Data Visualization: Data Analysis and Redesign Contests. The full contents of the supplement are available online at http://www. biomedcentral.com/bmcproc/supplements/8/S2
Authors’details
1Max Planck Institute for Informatics, 66123 Saarbücken, Germany.2University
of California, San Francisco, 94143-2240 San Francisco, USA.3The University
of Sydney, 2006 Sydney, Australia.4Monash University, 3145 Melbourne,
Australia.5EURAC research, 39100 Bolzano, Italy.6University Medicine
Greifswald, 17475 Greifswald, Germany.7Graz University of Technology, 8010 Graz, Austria.8BioTechMed-Graz, 8010 Graz, Austria.
Published: 28 August 2014
References
1. Hecht M, Bromberg Y, Rost B:News from the protein mutability landscape.Journal of Molecular Biology2013,425(21):3937-3948. 2. Castellana S, Mazza T:Congruency in the prediction of pathogenic
missense mutations: state-of-the-art web-based tools.Briefings in Bioinformatics2013,14(4):448-459.
3. Thusberg J, Olatubosun A, Vihinen M:Performance of mutation pathogenicity prediction methods on missense variants.Human Mutation
2011,32(4):358-368.
4. Cooper GM, Shendure J:Needles in stacks of needles: finding disease-causal variants in a wealth of genomic data.Nature Reviews Genetics2011,
12(9):628-640.
5. Mah JTL, Low ESH, Lee E:In silico SNP analysis and bioinformatics tools: a review of the state of the art to aid drug discovery.Drug Discovery Today
2011,16(17-18):800-809.
6. Capriotti E, Nehrt NL, Kann MG, Bromberg Y:Bioinformatics for personal genome interpretation.Briefings in Bioinformatics2012,13(4):495-512. 7. Gnad F, Baucom A, Mukhyala K, Manning G, Zhang Z:Assessment of
computational methods for predicting the effects of missense mutations in human cancers.BMC Genomics2013,14(Suppl 3):7.
8. Stefl S, Nishi H, Petukh M, Panchenko AR, Alexov E:Molecular mechanisms of disease-causing missense mutations.Journal of Molecular Biology2013,
425(21):3919-3936.
9. Sim NL, Kumar P, Hu J, Henikoff S, Schneider G, Ng PC:SIFT web server: predicting effects of amino acid substitutions on proteins.Nucleic Acids Research2012,40(W1):452-457.
10. Adzhubei I, Schmidt S, Peshkin L, Ramensky V, Gerasimova A, Bork P, Kondrashov A, Sunyaev S:A method and server for predicting damaging missense mutations.Nature Methods2010,7(4):248-249.
11. RINalyzer Webpage.[http://www.rinalyzer.de].
12. Pettersen EF, Goddard TD, Huang CC, Couch GS, Greenblatt DM, Meng EC, Ferrin TE:UCSF Chimera - a visualization system for exploratory research and analysis.Journal of Computational Chemistry2004,25(13):1605-1612. 13. Meng E, Pettersen E, Couch G, Huang C, Ferrin T:Tools for integrated
sequence-structure analysis with UCSF Chimera.BMC Bioinformatics2006,
7(1):339.
14. Doncheva NT, Klein K, Domingues FS, Albrecht M:Analyzing and visualizing residue networks of protein structures.Trends in Biochemical Sciences2011,36(4):179-182.
15. Shannon P, Markiel A, Ozier O, Baliga NS, Wang JT, Ramage D, Amin N, Schwikowski B, Ideker T:Cytoscape: A software environment for integrated models of biomolecular interaction networks.Genome Research2003,13(11):2498-2504.
16. Stivala A, Wybrow M, Wirth A, Whisstock JC, Stuckey PJ:Automatic generation of protein structure cartoons with Pro-origami.Bioinformatics
2011,27(23):3315-3316.
17. Morris JH, Huang CC, Babbitt PC, Ferrin TE:structureViz: linking Cytoscape and UCSF Chimera.Bioinformatics2007,23(17):2345-2347.
18. Doncheva NT, Assenov Y, Domingues FS, Albrecht M:Topological analysis and interactive visualization of biological networks and protein structures.Nature Protocols2012,7(4):670-685.
19. Henikoff S, Henikoff JG:Amino acid substitution matrices from protein blocks.Proceedings of the National Academy of Sciences1992,
89(22):10915-10919.
20. Goldenberg O, Erez E, Nimrod G, Ben-Tal N:The ConSurf-DB: pre-calculated evolutionary conservation profiles of protein structures.
Nucleic Acids Research2009,37(Suppl 1):323-327.
21. The UniProt Consortium:Activities at the Universal Protein Resource (UniProt).Nucleic Acids Research2014,42(D1):191-198.
22. Murzin AG, Brenner SE, Hubbard T, Chothia C:SCOP: A structural classification of proteins database for the investigation of sequences and structures.Journal of Molecular Biology1995,247(4):536-540. 23. Rose PW, Bi C, Bluhm WF, Christie CH, Dimitropoulos D, Dutta S, Green RK,
Goodsell DS, Prlic’A, Quesada M, Quinn GB, Ramos AG, Westbrook JD, Young J, Zardecki C, Berman HM, Bourne PE:The RCSB Protein Data Bank: new resources for research and education.Nucleic Acids Research2013,
41(D1):475-482.
24. Canutescu AA, Shelenkov AA, Dunbrack RL:A graph-theory algorithm for rapid protein side-chain prediction.Protein Science2003,12(9):2001-2014.
doi:10.1186/1753-6561-8-S2-S2
Cite this article as:Donchevaet al.:Integrative visual analysis of protein sequence mutations.BMC Proceedings20148(Suppl 2):S2.
Submit your next manuscript to BioMed Central and take full advantage of:
• Convenient online submission
• Thorough peer review
• No space constraints or color figure charges
• Immediate publication on acceptance
• Inclusion in PubMed, CAS, Scopus and Google Scholar
• Research which is freely available for redistribution