analysis and multiplex RT-PCR to detect and
differentiate grapevine leafroll-associated virus 3
variant groups I, II, III and VI
Bester
et al.
M E T H O D O L O G Y
Open Access
Real-time RT-PCR high-resolution melting curve
analysis and multiplex RT-PCR to detect and
differentiate grapevine leafroll-associated virus 3
variant groups I, II, III and VI
Rachelle Bester
1, Anna E C Jooste
2, Hans J Maree
1,3and Johan T Burger
1*Abstract
Background:Grapevine leafroll-associated virus 3 (GLRaV-3) is the main contributing agent of leafroll disease worldwide. Four of the six GLRaV-3 variant groups known have been found in South Africa, but their individual contribution to leafroll disease is unknown. In order to study the pathogenesis of leafroll disease, a sensitive and accurate diagnostic assay is required that can detect different variant groups of GLRaV-3.
Methods:In this study, a one-step real-time RT-PCR, followed by high-resolution melting (HRM) curve analysis for the simultaneous detection and identification of GLRaV-3 variants of groups I, II, III and VI, was developed. A melting point confidence interval for each variant group was calculated to include at least 90% of all melting points
observed. A multiplex RT-PCR protocol was developed to these four variant groups in order to assess the efficacy of the real-time RT-PCR HRM assay.
Results:A universal primer set for GLRaV-3 targeting the heat shock protein 70 homologue (Hsp70h) gene of GLRaV-3 was designed that is able to detect GLRaV-3 variant groups I, II, III and VI and differentiate between them with high-resolution melting curve analysis. The real-time RT-PCR HRM and the multiplex RT-PCR were optimized using 121 GLRaV-3 positive samples. Due to a considerable variation in melting profile observed within each GLRaV-3 group, a confidence interval of above 90% was calculated for each variant group, based on the range and distribution of melting points. The intervals of groups I and II could not be distinguished and a 95% joint
confidence interval was calculated for simultaneous detection of group I and II variants. An additional primer pair targeting GLRaV-3 ORF1a was developed that can be used in a subsequent real-time RT-PCR HRM to differentiate between variants of groups I and II. Additionally, the multiplex RT-PCR successfully validated 94.64% of the infections detected with the real-time RT-PCR HRM.
Conclusion:The real-time RT-PCR HRM provides a sensitive, automated and rapid tool to detect and differentiate different variant groups in order to study the epidemiology of leafroll disease.
Keywords:Grapevine leafroll-associated virus 3, GLRaV-3, Real-time RT-PCR, High-resolution melting curve analysis, Multiplex RT-PCR, Molecular variants, Leafroll disease
* Correspondence:[email protected]
1Department of Genetics, Stellenbosch University, Stellenbosch, South Africa
Full list of author information is available at the end of the article
Background
Grapevine leafroll-associated virus 3 (GLRaV-3) is a positive-sense single-stranded RNA virus that is the type member of the genusAmpelovirusin the family Closteroviridae[1]. This virus is phloem-limited and is considered the main contributing agent of leafroll disease worldwide with detrimental effects on both wine and table grapes. Six variant groups of GLRaV-3 have been identified of which four are known to be present in South Africa [2-8]. The genomes of at least one representative isolate of variant groups I, II, III and VI have been sequenced. These are isolates 621, WA-MR, NY-1 and CI-766 (group I) [2-5], 623 and GP18 (group II) [2,6], and PL-20 (group III) [2]. Recently, isolates GH11 and GH30 (group VI), were identified, and showed less than 70% nucleotide identity to other GLRaV-3 variant groups [7]. Limited sequence information for GLRaV-3 variant groups IV and V is available and isolates from these groups are only repre-sented by coat protein gene sequences in the GenBank database [8]. All these genetic variants commonly occur as mixed infections. However, no specific disease symptoms or geographic distribution could so far be assigned to a specific variant group or cluster of variant groups. It is therefore necessary to develop an effective method that can detect all GLRaV-3 variants and differentiate between them. Previously, single-strand conformation polymorphism (SSCP) profiles have been used to investigate the population structure and genetic variability of GLRaV-3 variants [2,9]. Although SSCP analysis is fast and cost effective for variant typing based on sequence hetero-geneity, the technique is not as sensitive as RT-PCR and requires sequencing to verify new variants. Metage-nomic sequencing or next generation sequencing is the most sensitive diagnostic tool available to detect and iden-tify known and novel viruses [10-13]. Next generation sequencing can identify viral pathogens occurring at extremely low titers without the necessity of any prior sequence knowledge. Although this technique is unbiased, it is still too expensive to use for routine diagnostics. Reverse transcription polymerase chain reaction (RT-PCR) is a diagnostic tool capable of detecting virus sequences at low concentrations and can be designed to be genus-, species-, or isolate-specific [14,15]. The design of optimal RT-PCR primers requires accurate sequence information. The recently sequenced GLRaV-3 group VI was found to be less than 70% similar to other GLRaV-3 variant groups and warrants a re-evaluation of existing GLRaV-3 RT-PCR diagnostic primers.
Real-time RT-PCR is another technique that has been successfully utilized to detect various plant viruses, includ-ing GLRaV-3 [16]. It is a rapid, reliable and quantitative detection method that is more sensitive than conventional RT-PCR. It has the potential for multiplexing and is there-fore able to detect several pathogens in the same reaction
[16]. The development of high-resolution melting (HRM) curve analysis, as an extension to real-time RT-PCR, provides a rapid, high-throughput, cost effective and single tube approach to discriminate and genotype strains of bacteria and viruses [17]. The genotyping of variants does not require a labeled probe and sequence variants can be distinguished from each other based on their individual melting temperatures [18]. High-resolution melting (HRM) curve analysis was effectively applied in diagnostics for viruses affecting humans [19] as well as for phytopathogenic bacteria [17].
The aim of this study was to develop a simple and reli-able one-step real-time RT-PCR assay with high-resolution melting (HRM) curve analysis (RT-PCR HRM) for the simultaneous detection and identification of GLRaV-3 variants of groups I, II, III and VI, all four previously detected in South African vineyards. To achieve this, a universal primer set, able to detect and differentiate these variant groups, was designed. A multiplex RT-PCR was also developed to validate the RT-RT-PCR HRM. The application of these protocols will aid in the under-standing of the molecular epidemiology of GLRaV-3 and leafroll disease and assist programmes focused at managing and controlling the spread of GLRaV-3.
Results and discussion
Primer design and evaluation
Therefore, it is likely that the shoulder peaks can be the result of uneven G/C distribution throughout the targeted RNA of groups III and VI [20,21]. The last 126 nucleotides at the 3’end of the 226 bp amplicon for groups III and VI
have an average GC content of 53% and 56% respectively, compared to the 47.5% and 46% for groups I and II.
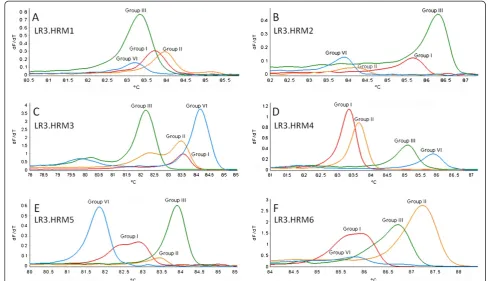
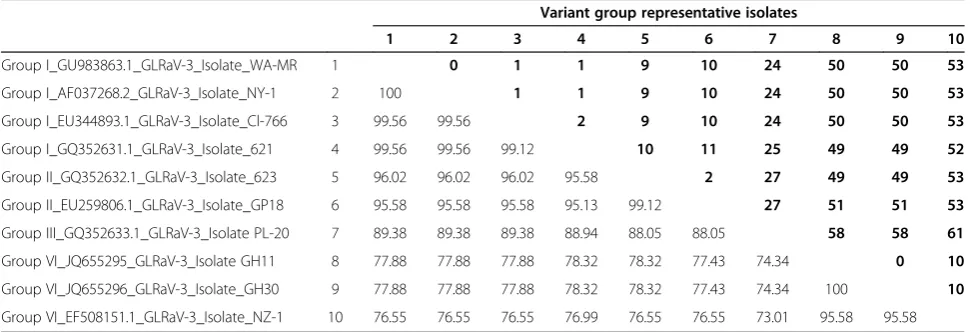
No discriminatory difference could be detected between the average melting points of groups I and II (Table 1). Pairwise nucleotide sequence comparisons showed that there are only up to 11 nucleotide differences between GLRaV-3 group I and group II within the targeted region, whereas the other variant groups had 24-61 nucleotide differences (Table 2). Although primer pair LR3.HRM6 was unable to detect group VI variants, it could efficiently differentiate between group I and II variants (Figure 1F). It produced a single melting peak on a derivative melting curve for both variant groups I and II with average melting points of 85.03°C and 86.41°C, respectively (Table 1). Sequence analysis performed on the Hsp70h gene sequences available on GenBank, spanning the LR3.HRM4 primer pair target region, indicates that the LR3.HRM4 primer pair will be able to detect all variants from groups I, II, III and VI. Unfortunately groups IV and V could not be included in this study as only coat protein sequences of these variant groups are available.
Verification of one-step real-time RT-PCR HRM assay
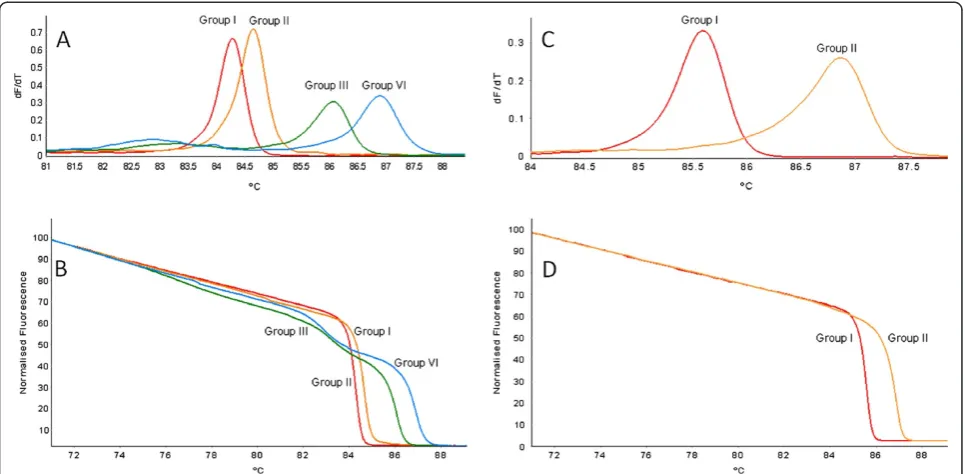
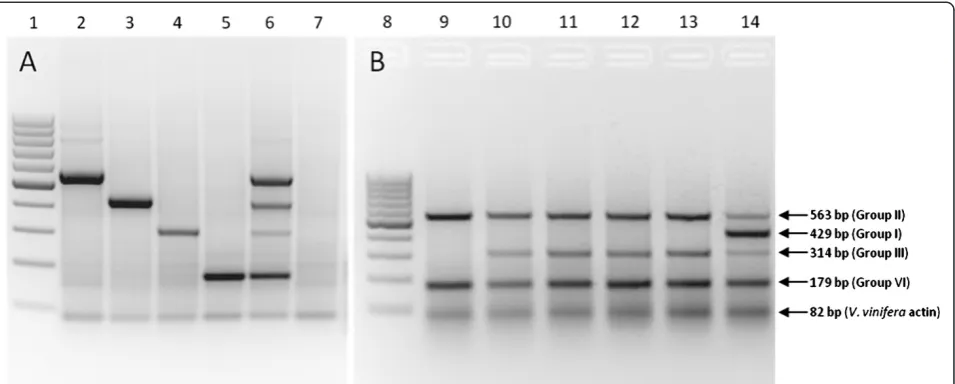
Variant-specific plasmids containing the amplicons from primer pairs LR3.HRM4 and LR3.HRM6 were constructed. The derivative HRM curves (dF/dT) and normalized HRM Figure 1Comparison of primer pairs evaluated for their ability to detect and differentiate between GLRaV-3 variant groups.Derivative HRM curves (dF/dT) obtained using RNA extracted from plants singly infected with only one variant group of GLRaV-3 in the real-time RT-PCR HRM assay.
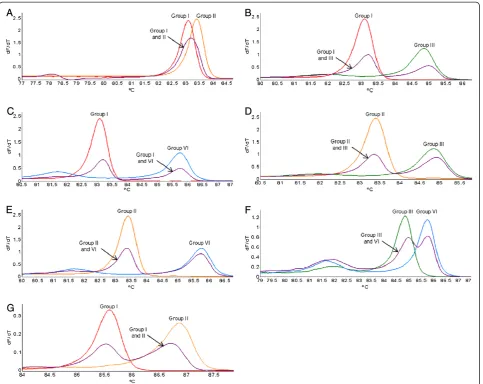
curves generated by using the variant-specific plasmid DNA in the real-time PCR HRM assay (PCR HRM) (Figure 3) verified the melting curves observed when singly infected plant RNA samples were screened (Figure 1D and Figure 1F). Duplex artificially mixed infections between the variant-specific plasmid DNA confirmed that primer pair LR3.HRM4 can differentiate between mixed infections (Figure 4B-F), except for mixed infections of variants from groups I and II (Figure 4A). The duplex artificial mix with the variant-specific plasmid DNA of groups I and II illustrated that a single melting peak is produced on the derivative melting curve (Figure 4A). This melting peak was not distinguishable from either the singly infected group I or II melting peaks, based on the confidence intervals calculated. In order to classify a sample as group I and/or II it was concluded that an additional RT-PCR HRM assay with primer pair LR3.HRM6 is necessary. Primer pair LR3.HRM6 could differentiate between variants of groups I and II based on the duplex artificial mixed infection analysis (Figure 4G).
Real-time RT-PCR and HRM analysis
One hundred and sixty nine grapevine samples were screened with the LR3.HRM4 primer pair of which 48 samples tested negative for GLRaV-3. From the remaining 121 samples positive for GLRaV-3, 35 were positive for group III variants and 87 positive for group VI variants. One hundred and two samples were posi-tive for group I and/or group II variants. These 102 samples were screened with the LR3.HRM6 primer pair to determine their variant status and 14 samples were found to be infected with group I variants and 88 samples infected with group II variants. Of the 121 GLRaV-3 positive samples, 73 samples had multiple infections (Table 3).
In order to use RT-PCR HRM with the LR3.HRM4 primer pair for variant differentiation, a confidence interval for each variant group’s melting point was deter-mined. The sample melting points for groups II, III and VI were not normally distributed (Table 4), resulting in less than 95% of the melting points to fall within the interval ±1.96 standard deviations from the mean. All Table 1 Descriptive statistics of melting points generated by real-time RT-PCR HRM assays with primer pairs LR3.HRM4 and LR3.HRM6
Variant group Number of data pointsa Min Max Mean Temperature range between upper and lower limit
LR3.HRM4
Group I 31 83.20 83.98 83.60 0.78
Group II 203 83.15 84.25 83.77 1.10
Group III 73 84.87 85.70 85.44 0.83
Group VI 142 85.30 86.37 85.97 1.07
LR3.HRM6
Group I 27 84.78 85.42 85.03 0.64
Group II 187 85.95 86.90 86.41 0.95
a
Number of melting point temperatures generated per variant group from the 121 samples. More than one melting point temperature per sample was generated due to mix infections and duplex reactions.
Table 2 Pairwise comparison of LR3.HRM4 amplicon (226 nt segment of Hsp70h) for each variant group
Variant group representative isolates
1 2 3 4 5 6 7 8 9 10
Group I_GU983863.1_GLRaV-3_Isolate_WA-MR 1 0 1 1 9 10 24 50 50 53
Group I_AF037268.2_GLRaV-3_Isolate_NY-1 2 100 1 1 9 10 24 50 50 53
Group I_EU344893.1_GLRaV-3_Isolate_Cl-766 3 99.56 99.56 2 9 10 24 50 50 53
Group I_GQ352631.1_GLRaV-3_Isolate_621 4 99.56 99.56 99.12 10 11 25 49 49 52
Group II_GQ352632.1_GLRaV-3_Isolate_623 5 96.02 96.02 96.02 95.58 2 27 49 49 53
Group II_EU259806.1_GLRaV-3_Isolate_GP18 6 95.58 95.58 95.58 95.13 99.12 27 51 51 53
Group III_GQ352633.1_GLRaV-3_Isolate PL-20 7 89.38 89.38 89.38 88.94 88.05 88.05 58 58 61
Group VI_JQ655295_GLRaV-3_Isolate GH11 8 77.88 77.88 77.88 78.32 78.32 77.43 74.34 0 10
Group VI_JQ655296_GLRaV-3_Isolate_GH30 9 77.88 77.88 77.88 78.32 78.32 77.43 74.34 100 10
Group VI_EF508151.1_GLRaV-3_Isolate_NZ-1 10 76.55 76.55 76.55 76.99 76.55 76.55 73.01 95.58 95.58
RT-PCR HRM reactions were performed in duplicate and yielded consistent melting points per sample, how-ever, significant variation was observed between samples from the same variant group. This can probably be explained by the existence of quasispecies that arose from the high mutation rate of the viral genome [22,23]. An average melting point was therefore not adequate to differentiate GLRaV-3 variant groups. A melting point temperature interval was consequently calculated to include 95% of the melting points observed. The 2.5thand 97.5th percentiles for each variant group (Table 4) were used to calculate the limits of the interval to include 95% of the data. The largest possible interval for each variant group was also determined to include the highest number of melting points for each variant group without over-lapping with the adjacent interval (Table 4). Intervals where all data points (100% confidence) fell within the maximum range, the limits were adjusted to the 2.5thto 97.5th percentile to incorporate a margin of error to ensure accurate classification. The confidence intervals of groups I and II overlapped almost completely and therefore differentiation was not possible. The group I and II intervals could not be separated and a joint interval from 83.22°C to 84.18°C (95% confidence) was calculated for samples from variant groups I and/or II. For groups III and VI the intervals were calculated as 84.57°C to 85.64°C (95.89% confidence) and 85.65°C to 86.37°C (92.96% confidence), respectively.
To differentiate groups I and II, primer pair LR3. HRM6 was used. The melting points of both groups I
and II were also not normally distributed and the confi-dence intervals were calculated using the 2.5thto 97.5th percentile range. The group I interval was calculated from 84.79°C to 85.39°C (95% confidence) and for group II from 86.01°C to 86.78°C (95% confidence).
Outliers were identified within variant groups III and VI for primer pair LR3.HRM4 and within variant group I for primer pair LR3.HRM6 (Table 4). The compara-tively high number of outliers identified within variant group VI resulted in a lower confidence level for this variant group compared to the other groups.
The Rotor-Gene software can perform automated vari-ant classification based on the melting point interval calculated from the derivative melting curve (dF/dT) profile for each sample. Bins were programmed based on the data set for each variant group that consisted of a calculated midpoint with a 95% confidence interval width. This allows the software to automatically classify each melting peak observed according to the bins programmed. To avoid unnecessary peak calling, the temperature threshold can be set at 83°C, because none of the variant groups is expected to have a melting point below 83°C.
SYTO 9 dye which is influenced by inhibitors and salt concentration in the RNA extract.
In this study, preliminary data on the incidence of GLRaV-3 variants in the Western Cape of South Africa were collected using RT-PCR HRM analysis. A previous study, using SSCP, identified variant group II as the most prevalent, with 54% of a sample size of 80 being infected by this variant [24]. In the present study, variant groups II and VI were equally distributed with a 39% infection rate each. Of the 224 infections detected in 121 positive samples, 21% were single variant infections, with half of these classified as group VI. These preliminary data is not necessarily an indication of the distribution of GLRaV-3, since more than halve of the grapevine samples came from only three severely infected vineyards and the rest were from greenhouse isolate collections that decreases the complexity of mix infections. However, it
confirms the presence of four GLRaV-3 variant groups in South Africa and that the technique can successfully be applied to study the distribution of GLRaV-3 variants.
Variant status confirmation using multiplex RT-PCR
inhibitory contaminants [25-27]. One hundred and twenty one GLRaV-3 positive samples were screened using the multiplex RT-PCR protocol. Thirteen of these samples were positive for group I variants, 87 samples positive for group II variants, 32 samples positive for group III samples and 80 samples positive for group VI variants. The multiplex RT-PCR validated 94% of the infections detected by the combined LR3.HRM4 and LR3. HRM6 RT-PCR HRM assays, indicating that the RT-PCR HRM is more sensitive than the multiplex RT-PCR. This is not unexpected, because of the specificity of the
instrument used and the primer target region selected. The multiplex RT-PCR was designed to target the 5’UTR of the GLRaV-3 genome due to the high variability in this region. Insertions and deletions in this region made it an ideal target for the design of variant-specific primers. The 5’UTR is only represented in the genomic RNA whereas the Hsp70h is also represented in sub-genomic RNAs pro-duced during GLRaV-3 replication. This implies an increased number of templates for the 3’half of the gen-ome [3,28], making the Hsp70h region a better-suited tar-get for viral diagnostics by improving sensitivity. Another advantage of the RT-PCR HRM is that it will be possible to identify a new variant group if a distinct melting curve profile is produced. With the multiplex RT-PCR a new variant group will remain undetected or unidentified if the primers are also specific for the new variant.
Conclusion
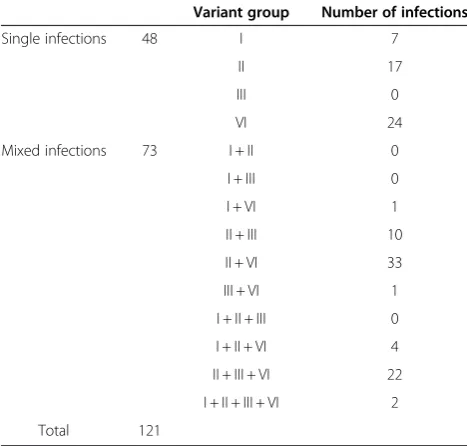
In order to investigate the spread and impact of different GLRaV-3 variants in vineyards, sensitive diagnostic tech-niques are a necessity. Serological tests like ELISA is one of the preferred detection methods for plant viral disease diagnostics due to its simplicity and effectiveness [29]. However, as viral sequences become available, virus-specific primers can be designed to be used in RT-PCR or real-time RT-RT-PCR that is more sensitive than serological tests. In this study, a real-time RT-PCR was designed that is able to detect GLRaV-3 variant groups I, II, III and VI, using a single primer pair tar-geting the Hsp70h gene of GLRaV-3. If HRM curve analysis is added to the real-time RT-PCR, it is possible to differentiate between variant groups based on three melting point intervals. An additional primer pair was Table 3 Analysis of grapevine leafroll-associated virus 3
(GLRaV-3) single and mixed variant group infections Variant group Number of infections
Single infections 48 I 7
II 17
III 0
VI 24
Mixed infections 73 I + II 0
I + III 0
Table 4 Calculation of the melting point confidence interval for each variant group based on real-time RT-PCR HRM curve analysis using LR3.HRM4 or LR3.HRM6 primer pairsa
Variant group
2.5th
percentileb 97.5 th
percentilec Interquartilerange (IQR)
(75%-25%)d
Melting point interval without overlaps
Confidence (%)
LR3.HRM4
Group I 83.22 84.08 0.43 0.00 0.103e 83.20 83.70 67.74
Group II 83.22 84.18 0.45 0.00 0.000 83.15 84.56 100
Group III 84.91 85.65 0.13 6.00 0.000 84.57 85.64 95.89
Group VI 85.35 86.28 0.15 12.00 0.000 85.65 86.37 92.96
LR3.HRM6
Group I 84.79 85.39 0.09 7.00 0.002 84.78 85.69 100
Group II 86.01 86.78 0.42 0.00 0.000 85.70 86.90 100
a
The data generated for each variant group was tested for normality in order to calculate the largest interval with the highest confidence without overlaps between variant groups. These intervals are indicated in bold. Intervals where all data points (100% confidence) fell within the maximum range, the limits were adjusted to the 2.5th
to 97.5th
percentile to incorporate a margin of error to ensure accurate classification.
b
2.5thpercentile is the melting point temperature where 2.5% of data points is less than or equal to that temperature.
c
97.5th
percentile is the melting point temperature where 2.5% of data points is greater than or equal to that temperature.
d
Interquartile range is the interval where the middle 50% of melting point temperatures can be expected.
e
identified that is able to differentiate between variant groups I and II. The RT-PCR HRM assay provides a more sensitive, automated and rapid tool to detect and differ-entiate between different GLRaV-3 variant groups. The multiplex RT-PCR offers an end-point PCR alternative to differentiate between the variant groups present in South African or to be used as a validation method for the RT-PCR HRM. The abovementioned tools will contribute to the understanding of the pathogenesis of leafroll disease and aid epidemiology studies to investigate how these different GLRaV-3 variant groups are spreading.
Materials and methods
Virus source and sample preparation
Plant material from 173 grapevine plants was used to establish and validate the RT-PCR HRM. Forty vines from a study in 2008, where the distribution of GLRaV-3 variants in disease clusters were investigated, were re-collected from a vineyard in the Worcester vine growing region [24]. Ninety grapevine plants were randomly selected during a field survey in 2008 from two severely infected vineyards in the Stellenbosch area and 39 grapevine samples were from a virus isolate collection (Vitis Laboratory, Stellenbosch University, South Africa), maintained in V. vinifera, grown in the greenhouse. An additional GLRaV-3 positive sample for each variant group, singly infected with only that variant (Group I, II, III and VI), were obtained from a virus isolate collection (ARC-Plant Protection Research Institute, Pretoria, South
Africa). Phloem scrapings were prepared from cane ma-terial collected during winter. Total RNA was extracted from 2.5g phloem tissue using an adapted Cetyltri-methylammonium bromide (CTAB) method (2% CTAB, 2.5% PVP-40, 100mM Tris-HCL pH8, 2M NaCl, 25mM EDTA pH8 and 3%β-mercaptoethanol) [30].
Primer design
Conserved regions in the GLRaV-3 genome were used to design primer pairs that are able to detect the four GLRaV-3 variant groups found in South Africa. These conserved regions had to be in close proximity to result in amplicons with lengths of 150-300 base pairs (bp). Representative isolates of GLRaV-3 variant groups with complete genome sequences available [GenBank: GQ35 2631.1, GenBank: EU259806.1, GenBank: GQ352632.1, GenBank: GQ352633.1, GenBank: JQ655295, GenBank: GU983863.1, GenBank: AF037268.2, GenBank: EU34489 3.1] were used to identify the conserved regions by con-structing a multiple sequence alignment using BioEdit 7.0.5.3 [31]. The partial isolate NZ-1 sequence was also included in the multiple sequence alignment [GenBank: EF508151.1]. Six primers pairs were identified targeting ORF1a, ORF1b, ORF4 and ORF6 (Table 5). The six primers pairs were tested on samples singly infected with a specific GLRaV-3 variant group using the real-time RT-PCR to identify which primer can most effectively detect all variants and possibly differentiate between them by using HRM curve analysis.
Figure 5Agarose gel electrophoresis of multiplex RT-PCR amplicons.Visualization of multiplex RT-PCR amplicons separated on a 2% TAE agarose gel with ethidium bromide staining.Figure 5Arepresents grapevine samples singly infected with one GLRaV-3 variant group and
Verification of one-step real-time RT-PCR assay with melting curves generated from plasmid DNA
Real-time RT-PCR amplicons of GLRaV-3 variant groups I, II, III and VI were cloned into a pGEM-T-easy Vector (Promega) and sequenced to obtain variant-specific plasmid DNA. Artificial in vitro mixed infections between the variant-specific plasmid DNA were made to determine whether the chosen primer pair could differentiate between variants if mixed infections would be present in field plants. Duplex infections were made in a 1:3, 1:1 and 3:1 ratio for each combination of two variant groups. Reaction mixtures of all variant-specific plasmid DNA PCR HRM assays contained 1x KAPA Taq Buffer A (KAPA Biosystems), 0.4μM reverse primer (IDT), 0.4μM forward primer (IDT), 0.2 mM dNTP mix (Fermentas) 1
μM SYTO 9 (Invitrogen), 0.04 U/ μl KAPA Taq DNA
polymerase (KAPA Biosystems) and 0.01 ng/μl plasmid DNA. Cycle conditions included an initial denaturation step at 94°C for 5 minutes, followed by 45 cycles of 94°C for 10 seconds, annealing at 55°C for 10 seconds and elongation at 72°C for 20 seconds. Acquisition on the green channel was recorded at the end of the extension step. High-resolution melting curves of PCR amplicons were obtained with temperatures ranging from 70°C to 90°C with a 0.1°C increase in temperature every two seconds.
Real-time RT-PCR and HRM analysis
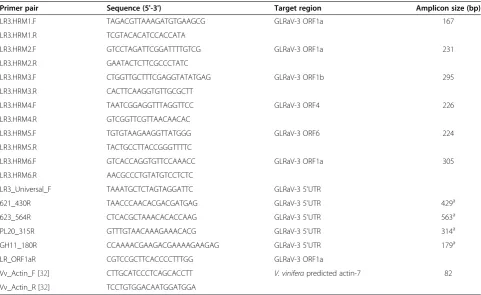
The primer pair that could most effectively detect and differentiate between GLRaV-3 variant groups I, II, III and VI was used to screen the 173 samples to optimize the assay. Each reaction was performed in duplicate using the RT-PCR HRM on a Qiagen Rotor-Gene Q thermal cycler. Reaction mixtures contained 1x KAPA Taq Buffer A (KAPA Biosystems), 0.4μM reverse primer (IDT), 0.4μM forward primer (IDT), 0.2 mM dNTP mix (Fermentas), 1 μM SYTO 9 (Invitrogen), 0.04 U/μl KAPA Taq (KAPA Biosystems), 0.08 U/μl Avian Myelo-blastosis Virus (AMV) reverse transcriptase (Fermentas) and 100 ng RNA. Optimized cycle conditions were a cDNA synthesis step at 48°C for 30 minutes, an initial denaturation step at 94°C for 5 minutes, followed by 45 cycles of 94°C for 10 seconds, annealing at 55°C for 10 seconds and elongation at 72°C for 20 seconds. Acquisition on the green channel was recorded at the end of the extension step. High-resolution melting curves of PCR amplicons were obtained with temperatures ranging from 70°C to 90°C with a 0.1°C increase in temperature every two seconds. HRM curve analysis was performed using the Rotor-Gene software version 1.7. In order to use the RT-PCR HRM to differentiate between variants, a melting point confidence interval had to be determined Table 5 List of primers used with the real-time RT-PCR HRM assay and the end-point multiplex RT-PCR protocol
Primer pair Sequence (5'-3') Target region Amplicon size (bp)
LR3.HRM1.F TAGACGTTAAAGATGTGAAGCG GLRaV-3 ORF1a 167
LR3.HRM1.R TCGTACACATCCACCATA
LR3.HRM2.F GTCCTAGATTCGGATTTTGTCG GLRaV-3 ORF1a 231
LR3.HRM2.R GAATACTCTTCGCCCTATC
LR3.HRM3.F CTGGTTGCTTTCGAGGTATATGAG GLRaV-3 ORF1b 295
LR3.HRM3.R CACTTCAAGGTGTTGCGCTT
LR3.HRM4.F TAATCGGAGGTTTAGGTTCC GLRaV-3 ORF4 226
LR3.HRM4.R GTCGGTTCGTTAACAACAC
LR3.HRM5.F TGTGTAAGAAGGTTATGGG GLRaV-3 ORF6 224
LR3.HRM5.R TACTGCCTTACCGGGTTTTC
LR3.HRM6.F GTCACCAGGTGTTCCAAACC GLRaV-3 ORF1a 305
LR3.HRM6.R AACGCCCTGTATGTCCTCTC
LR3_Universal_F TAAATGCTCTAGTAGGATTC GLRaV-3 5'UTR
621_430R TAACCCAACACGACGATGAG GLRaV-3 5'UTR 429a
623_564R CTCACGCTAAACACACCAAG GLRaV-3 5'UTR 563a
PL20_315R GTTTGTAACAAAGAAACACG GLRaV-3 5'UTR 314a
GH11_180R CCAAAACGAAGACGAAAAGAAGAG GLRaV-3 5'UTR 179a
LR_ORF1aR CGTCCGCTTCACCCCTTTGG GLRaV-3 ORF1a
Vv_Actin_F [32] CTTGCATCCCTCAGCACCTT V. viniferapredicted actin-7 82
Vv_Actin_R [32] TCCTGTGGACAATGGATGGA
a
for each variant group. The data generated for each vari-ant group were tested for normality using the Shapiro-Wilk algorithm and descriptive statistics were calculated using the SPSS statistics software package 19 (IBM).
Variant status conformation using multiplex RT-PCR
Variant-specific RT-PCR reverse primers (Table 5) targeting the 5’UTR of the GLRaV-3 variant groups I, II, III and VI were designed to be used in a single reaction with one forward primer. This multiplex RT-PCR was designed to validate the HRM analysis and assign each sample to a specific variant group. A primer pair targeting the V. vinifera actin gene was also included in the multiplex RT-PCR to act as an RNA specific internal control. A two-step RT-PCR multiplex protocol was used and approxi-mately 1000-1500 ng of total RNA was denatured at 65°C for 5 minutes with 2μM of LR_ORF1aR primer (IDT) and 2 μM of Vv_Actin_R (IDT) [32] (Table 5) and incubated for 2 minutes on ice (5 μl final volume). The RNA was reverse-transcribed by incubation at 48°C for 1 h in a reaction mixture (10 μl final volume) containing 1x Avian Myeloblastosis Virus (AMV) reverse transcriptase buffer (Fermentas), 1 mM dNTP mix (Fermentas), 1U/μl Ribolock (Fermentas) and 0.5 U/μl AMV reverse tran-scriptase (Fermentas). A 2.5 μl aliquot of cDNA was subjected to PCR in a 25 μl reaction mixture containing 1x KAPA Taq buffer B (KAPA Biosystems), 0.4 mM dNTP mix (Fermentas), 0.4 μM LR_universal_F primer (IDT), 0.28 μM Vv_Actin F (IDT) [32], 0.28 μM Vv_Actin R (IDT) [32], 0.4μM of each variant-specific reverse primer (IDT) (Table 5), 0.5μg/μl Bovine Serum Albumin (BSA)
(Roche) and 0.08 U/μl KAPA Taq DNA polymerase
(KAPA Biosystems). Cycle conditions included an initial denaturation step at 94°C for 5 minutes, followed by 35 cycles of 94°C for 30 seconds, annealing at 58°C for 20 seconds and elongation at 72°C for 40 seconds. Final extension was at 72°C for 7 minutes. Amplicons were visualized on an ethidium bromide-stained 2% TAE-agarose gel (2 M Tris, 1M glacial acetic acid, 0.05 M Na2EDTA, pH 8).
Competing interest
The authors declare that they have no competing interests.
Authors’contributions
RB contributed to the design of the study, primer design for the RT-PCR HRM assay, sample collection, RNA extractions, optimization of the RT-PCR HRM assay, screening of samples, statistical analysis, designing the multiplex RT-PCR, validation of RT-PCR HRM assay with multiplex RT-PCR and drafting the manuscript. AECJ designed primers for the RT-PCR HRM assay, supplied single variant infected GLRaV-3 source plants, contributed to the design of the study, sample collection, RNA extractions, optimization of RT-PCR HRM assay and drafting of the manuscript. HJM contributed to the design of the study, primer design, sample collection, statistical analysis, designing the multiplex RT-PCR protocol and drafting of the manuscript. JTB contributed to the design of the study, data analysis and drafting the manuscript. All authors read and approved the final manuscript.
Acknowledgements
The financial assistance of the National Research Foundation (NRF) towards this research is hereby acknowledged. Opinions expressed and conclusions arrived at, are those of the author and are not necessarily to be attributed to the NRF. The authors thank Winetech for research funding, Yolandi Espach for her contribution to the sample preparation, Theo Pepler for his assistance in the statistical analysis of data and Dr. Dirk Stephan for critical reading of this manuscript.
Author details
1Department of Genetics, Stellenbosch University, Stellenbosch, South Africa.
2
Plant Protection Research Institute, Agricultural Research Council, Pretoria, South Africa.3Biotechnology Platform, Agricultural Research Council Infruitec-Nietvoorbij, Stellenbosch, South Africa.
Received: 19 June 2012 Accepted: 18 September 2012 Published: 27 September 2012
References
1. Martelli GP, Agranovsky AA, Bar-Joseph M, Boscia D, Candresse T, Coutts RHA, Dolja VV, Falk BW, Gonsalves D, Jelkmann W, Karasev AV, Minafra A, Namba S, Vetten HJ, Wisler GC, Yoshikawa N:The family Closteroviridae revised.Arch Virol2002,147(10):2039–2044.
2. Jooste AEC, Maree HJ, Bellstedt DU, Goszczynski DE, Pietersen G, Burger JT: Three genetic grapevine leafroll-associated virus 3 variants identified from South African vineyards show high variability in their 5’UTR.Arch Virol2010,155:1997–2006.
3. Jarugula S, Gowda S, Dawson WO, Naidu RA:3'-coterminal subgenomic RNAs and putative cis-acting elements of Grapevine leafroll-associated virus 3 reveals 'unique' features of gene expression strategy in the genus Ampelovirus.Virol J2010,7(180):1–14.
4. Ling K-S, Zhu H-Y, Gonsalves D:Complete nucleotide sequence and genome organization of Grapevine leafroll-associated virus 3, type member of the genus Ampelovirus.J Gen Virol2004,85:2099–2102. 5. Engel EA, Girardi C, Escobar PF, Arredondo V, Dominguez C, Perez-Acle
T, Valenzuela PD:Genome analysis and detection of a Chilean isolate of Grapevine leafroll associated virus-3.Virus Genes2008,
37(1):110–118.
6. Maree HJ, Freeborough M-J, Burger JT:Complete nucleotide sequence of a South African isolate of grapevine leafroll-associated virus 3 reveals a 5’UTR of 737 nucleotides.Arch Virol2008,153:755–757.
7. Bester R, Maree HJ, Burger JT:Complete nucleotide sequence of a new strain of grapevine leafroll-associated virus 3 in South Africa.Arch Virol
2012,157(9):1815–1819.
8. Gouveia P, Santos MT, Eiras-Dias JE, Nolasco G:Five phylogenetic groups identified in the coat protein gene of grapevine leafroll-associated virus 3 obtained from Portuguese grapevine varieties.Arch Virol2010,156 (3):413–420.
9. Turturo C, Salderelli P, Yafeng D, Digiaro M, Minafra A, Savino V, Martelli GP: Genetic variability and population structure of grapevine leafroll-associated virus 3 isolates.J Gen Virol2005,86:217–224.
10. Adams IP, Glover RH, Monger WA, Mumford R, Jackeviciene E, Navalinskiene M, Samuitiene M, Boonham N:Next-generation sequencing and metagenomic analysis: a universal diagnostic tool in plant virology.Mol Plant Path2009,10(4):537–545.
11. Kreuze JF, Perez A, Untiveros M, Quispe D, Fuentes S, Barker I, Simon R: Complete viral genome sequence and discovery of novel viruses by deep sequencing of small RNAs: A generic method for diagnosis, discovery and sequencing of viruses.Virology2009,388(1):1–7. 12. Al Rwahnih M, Daubert S, Golino D, Rowhani A:Deep sequencing analysis
of RNAs from a grapevine showing Syrah decline symptoms reveals a multiple virus infection that includes a novel virus.Virology2009,387 (2):395–401.
13. Coetzee B, Freeborough M-J, Maree HJ, Celton J, Rees DJG, Burger JT:Deep sequencing analysis of viruses infecting grapevines: virome of a vineyard.Virology2010,400(2):157–163.
14. Charles JG, Cohen D, Walker JTS, Forgie SA, Bell VA, Breen KC:A review of Grapevine Leafroll associated Virus type 3 (GLRaV-3) for the New Zealand wine industry. Report to New Zealand Winegrowers.
15. Ward E, Foster SJ, Fraaije BA, McCartney HA:Plant pathogen diagnostics: immunological and nucleic acid-based approaches.Ann Appl Biol2004, 145:1–16.
16. Osman F, Leutenegger C, Colino D, Rowhani A:Real-time RT-PCR (TaqManW) assays for the detection of grapevine leafroll associated viruses 1–5 and 9.J Virol Methods2007,141:22–29.
17. Gori A, Cerboneschi M, Tegli S:High-resolution melting analysis as a powerful tool to discriminate and genotype pseudomonas savastanoi pathovars and strains.PLoS One2012,7(1):1–13.
18. Reed GH, Kent JO, Wittwer CT:High-resolution DNA melting analysis for simple and efficient molecular diagnostics.Pharmacogenomics2007,8 (6):597–608.
19. Toi CS, Dwyer DE:Differentiation between vaccine and wild-type varicella-zoster virus genotypes by high-resolution melting analysis of single nucleotide polymorphisms.J Clin Virol2008,43:18–24. 20. Dujic T, Ostanek B, Marc J, Causevic A, Minar B:Optimization of
high-resolution melting analysis simultaneous genotyping of two 11β -hydoxysteroid dehydrogenase type 1 gene polymorphisms.Genet Test Mol Bioma2011,15(1–2):43–49.
21. Jeffery N, Gasser RB, Steer PA, Noormohammadi AH:Classification of
mycoplasma synoviaestrains using single-strand conformation polymorphism and high-resolution melting-curve analysis of thevlhA gene single-copy region.Microbiology2007,2007(153):2679–2688. 22. Holland J, Spindler K, Horodyski F, Grabau E, Nichol S, VandePol S:Rapid
evolution of RNA genomes.Science1982,215:1577–1585. 23. Vignuzzi M, Stone JK, Arnold JJ, Cameron CE, Andino R:Quasispecies
diversity determines pathogenesis through cooperative interactions in a viral population.Nature2006,439:344–348.
24. Jooste AEC, Pietersen G, Burger JT:Distribution of grapevine leafroll associated virus-3 variants in South African vineyards.Eur J Plant Pathol
2011,131:371–381.
25. Nagai M, Yoshida A, Sato N:Additive effects of bovine serum albumin, dithiothreitol, and glycerol on PCR.Biochem Mol Biol Int1998,44(1):157– 163.
26. Kreader CA:Relief of amplification inhibition in PCR with bovine serum albumin or T4 gene 32 protein.Appl Environ Microbiol1996,62(3):1102– 1106.
27. Ralser M, Querfurth R, Warnatz HJ, Lehrach H, Yaspo ML, Krobitsch S:An efficient and economic enhancer mix for PCR.Biochem Biophys Res Commun2006,347:747–751.
28. Maree HJ, Gardner HFJ, Freeborough M-J, Burger JT:Mapping of the 5’ terminal nucleotides of Grapevine leafroll-associated virus 3 sgRNAs.
Virus Res2010,151:252–255.
29. Ling KS, Zhu HY, Petrovic N, Gonsalves D:Comparative Effectiveness of ELISA and RT-PCR for Detecting Grapevine Leafroll-Associated Closterovirus-3 in Field Samples.Am J Enol Viticult2001,52(1):21–27. 30. White EJ, Venter M, Hiten NF, Burger JT:Modified
Cetyltrimethylammonium bromide method improves robustness and versatility: the benchmark for plant RNA extraction.Biotechnol J2008,3 (11):1424–1428.
31. Hall TA:BioEdit: a user-friendly biological sequence alignment editor and analysis program for Windows 95/98/NT.Nucleic Acids Symp Ser1999, 41:95–98.
32. Reid KE, Olsson N, Schlosser J, Peng F, Lund ST:An optimized grapevine RNA isolation procedure and statistical determination of reference genes for real-time RT-PCR during berry development.BMC Plant Biol2006,6 (27):1–11.
doi:10.1186/1743-422X-9-219
Cite this article as:Besteret al.:Real-time RT-PCR high-resolution melting curve analysis and multiplex RT-PCR to detect and differentiate grapevine leafroll-associated virus 3 variant groups I, II, III and VI.
Virology Journal20129:219.
Submit your next manuscript to BioMed Central and take full advantage of:
• Convenient online submission
• Thorough peer review
• No space constraints or color figure charges
• Immediate publication on acceptance
• Inclusion in PubMed, CAS, Scopus and Google Scholar
• Research which is freely available for redistribution