Detection and Separation of Speech Event Using Audio
and Video Information Fusion and Its Application
to Robust Speech Interface
Futoshi Asano,1Kiyoshi Yamamoto,2Isao Hara,1Jun Ogata,1Takashi Yoshimura,1
Yoichi Motomura,1Naoyuki Ichimura,1Hideki Asoh1
1Information Technology Research Institute, National Institute of Advanced Industrial Science and Technology, Tsukuba 305-8568, Japan
Emails:[email protected],[email protected],[email protected],[email protected], [email protected],[email protected],[email protected]
2Department of Computer Science,Tsukuba University, Tsukuba 305-8573, Japan Email:[email protected]
Received 11 November 2003; Revised 3 February 2004; Recommended for Publication by Chin-Hui Lee
A method of detecting speech events in a multiple-sound-source condition using audio and video information is proposed. For detecting speech events, sound localization using a microphone array and human tracking by stereo vision is combined by a Bayesian network. From the inference results of the Bayesian network, information on the time and location of speech events can be known. The information on the detected speech events is then utilized in the robust speech interface. A maximum likelihood adaptive beamformer is employed as a preprocessor of the speech recognizer to separate the speech signal from environmental noise. The coefficients of the beamformer are kept updated based on the information of the speech events. The information on the speech events is also used by the speech recognizer for extracting the speech segment.
Keywords and phrases:information fusion, sound localization, human tracking, adaptive beamformer, speech recognition.
1. INTRODUCTION
Detection of speech events is an important issue in auto-matic speech recognition (ASR) in a real environment with background noise and interferences. Also, the detection of the presence or absence of the target speech signal is often important for noise reduction such as adaptive beamformer
(see, e.g., [1]) or spectral subtraction (see, e.g., [2]), which
can be used as a preprocessor of ASR. In the maximum likeli-hood (ML) adaptive beamformer employed in this paper, the spatial correlation of the noise must be estimated during the absence of the target signal as described later in this paper. In the spectral subtraction, the spectrum of the noise must be estimated in a way similar to that of the ML beamformer.
When environmental noise is nonspeech signals, a voice activity detector (VAD) can be used as a target speech
de-tector (see, e.g., [3]). In environments such as offices and
homes, however, not only the target but also interference from sources such as a TV or a radio can be speech signals. In such cases, the detection of the target speech cannot be accomplished only by using sound information, and fusion with the information from other modalities such as vision is necessary.
Chaodhury et al. [4] proposed a speech event detector
using audio and video information. In their paper, an envi-ronment in which a dialog existed between multiple speakers
and a Smart Kiosk terminal [5] was considered. The speech
events which were addressed only to the terminal were de-tected by using a dynamic Bayesian network based on the video information of face and the power level of sound. Thus, the main focus of that paper was detection of the attention of speakers to the terminal. In this system, therefore, it was assumed that only a single sound event occurs at a single moment. Also, information on the location of the target and other sound sources in the audio and video information was not utilized.
The main focus of this paper is the detection of speech events under the circumstance in which multiple sound events occur at the same time (e.g., speaking in the presence of TV sound). The location and time information obtained from audio and video observation is fused by a Bayesian net-work so that the time and location of the speech event can be
estimated [6,7].
70 68 66 64 62 60 58 56 54
−50 0 50
Angle (deg)
Le
ve
l
(d
B
)
(a) (b)
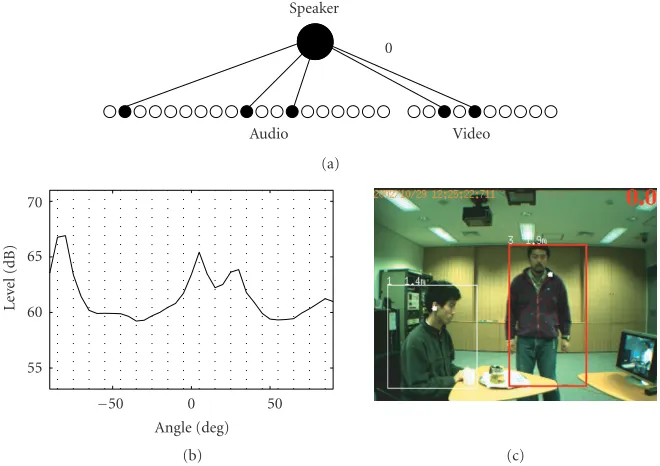
Figure1: Example of (a) the audio information (spatial spectrum) and (b) the video information (human tracking).
spoken in environmental noise and interferences are robustly recognized. In this system, an ML adaptive beamformer is employed as a preprocessor of ASR to separate speech signals
from environmental noise. The beamformer coefficients are
updated based on the information on the speech events. The information on the speech events is also utilized in ASR for
the segmentation of speech [8].
This paper is organized as follows. InSection 2,
meth-ods of extracting time and location information from the
au-dio and video observation are briefly reviewed. InSection 3,
a speech event detector based on information fusion is
de-veloped. In Section 4, a speech interface is constructed. In
Section 5, the performance of the entire system is evaluated in a real environment.
2. FEATURE EXTRACTION FROM AUDIO AND VIDEO INFORMATION
In this section, the methods of sound localization and hu-man tracking employed in this paper are briefly reviewed to facilitate the understanding of the following sections.
2.1. Sound localization
For sound localization, the MUSIC method [9] extended to
a broadband signal with eigenvalue weighting [6] is used.
We denote the input vector asx(ω,t) = [X1(ω,t),. . .,
XM(ω,t)]T, whereXm(ω,t) denotes the short-time Fourier
transform of the input signal to themth microphone. From
this input vector, the spatial correlation is estimated as
R(ω)=Ex(ω,t)xH(ω,t). (1)
Using the eigenvectors ofR(ω) corresponding to the smallest
M−Neigenvalues,{eN+1,. . .,eM}, the MUSIC spatial
spec-trum estimator is defined as
P(θ,ω)= g(θ,ω)
2
M
m=N+1eHmg(θ,ω)
2, (2)
whereMandNdenote the number of microphones and the
number of sound sources, respectively. The symbol g(θ,ω)
denotes the location vector of the virtual source in the
arbi-trary directionθ. The elements of the location vector are the
transfer functions of thedirectpath from the virtual source
to the microphones. To estimate the final spatial spectrum
for the broadband input, (2) is averaged over the frequency
of interest as
¯
P(θ)= ωh
ω=ωl ¯
λ(ω)P(θ,ω), (3)
where ¯λis the eigenvalue weight [6] defined as
¯
λ= N
n=1
λn. (4)
The symbolλnis thenth eigenvalue ofR(ω). The
eigenval-ues are assumed to be sorted in descending order. By doing this, the frequency bins in which the power of the directional
signal is dominant have larger weights. The range [ωl,ωh]
de-notes the frequency range of interest.
Figure 1ashows an example of the spatial spectrum
esti-mated by (3). From the peaks of this spectrum, the location
(direction) of the sound sources can be estimated.
2.2. Human tracking by vision
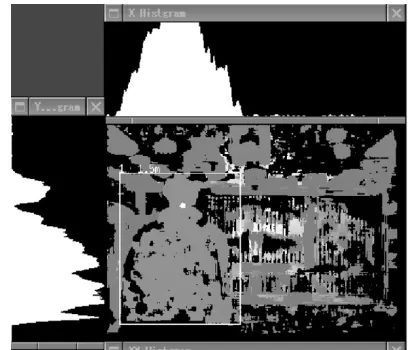
Figure2: Example of the background subtraction for human track-ing.
information fusion framework, any method which gives the position (pixels) of humans in the observed image can be used. In this paper, humans in a scene are detected by back-ground subtraction based on the range image obtained by
a stereo camera (see, e.g., [10]) for the sake of simplicity.
Figure 2 shows the process of the background subtraction. The main panel shows an example of the subtracted range
image (difference between the current input range image and
the pre-recorded background range image). The upper and
left panels show histograms of the difference in a vertical and
a horizontal slice, respectively. Regions in which the value of
the histogram of the difference is above a certain threshold
are recognized as foreground objects (humans).
3. AUDIO-VIDEO INFORMATION FUSION
In this section, the audio and video information is fused to detect the speech events.
3.1. Basic concept
As described in the previous section, the location and time of the audio events (emission of sound from sound sources) can be estimated by examining the audio infor-mation (spatial spectrum). Using this audio inforinfor-mation, “virtual audio sensors” which observe a certain region of the entire observation space and detect audio events are formed.
Also, the location and time of the video events (existence of humans) can be estimated from human tracking using vi-sion. In the same way as in the case of audio sensors, virtual video sensors which detect the video events in a certain re-gion of the video observation space are formed.
By combining the information of the audio and video events detected by these virtual audio and video sensors, the co-occurrence of audio and video events within a certain re-gion can also be estimated. This co-occurrence of audio and video events is detected as “speech events.”
A1 · · · ANa−1 ANa V1 · · · VNa−1 VNa
S
Audio Video
Figure3: Bayesian network for fusing audio and video information.
3.2. Bayesian network used for information fusion
In this paper, a Bayesian network (see, e.g., [11]) is used to
detect the co-occurrence of the audio and video events. The Bayesian network is a way of modeling a joint probability dis-tribution of multiple random variables and is considered to
be a powerful tool for information fusion [12].
Figure 3 shows the topology of the Bayesian network
used in this paper. The network has Na audio nodes,
{A1,. . .,ANa}, and Nv video nodes,{V1,. . .,VNv}, as input nodes. These nodes correspond to the virtual audio and video sensors described in the previous subsection. The
in-put nodes have the states of {0, 1}according to the
occur-rence of the corresponding audio/video events.
On the other hand, the output node Shas the
follow-ing Ns + 1 states: S = {S1,. . .,SNs, NoEvent}. The state
{S1,. . .,SNs} corresponds to the speaker’s position (angle):
{S1,. . .,SNs} = {−30◦,. . ., +30◦}. For example, when S =
−30◦, the speaker is located in the direction of 30◦and is
speaking. WhenS=NoEvent, there are no speech events.
3.3. Feature vector
Figure 4shows an example of the state of the Bayesian net-work and the corresponding audio and video information.
Regarding the audio information, the spatial spectrum (Figure 4b) is divided into the Na(= 19) regions (−90◦–
+90◦, every 10◦). The vertical lines in this panel indicate the
divided regions, which correspond to the virtual audio sen-sors and are assigned to the 19 audio nodes of the Bayesian network. In each region, the peak in the spatial spectrum is detected. According to the peak detection, the state of the
corresponding node is set at {0, 1}(“1” corresponds to the
peak being detected). Hereafter, the vector containing the
state of the audio input node,a(t)= {A1(t),. . .,ANa(t)}, is
referred to as the audio feature vector, in whichAi(t) denotes
the state of theith node at timet. Figures5aand5bshow
an example of the audio information (running spatial spec-trum) and the corresponding feature vector, respectively. The
vertical slice inFigure 5bcorresponds to a single feature
vec-tor,a(t).
In the same way as in the case of audio information, the
video observation space is divided into Nv(= 10) regions
(1–320 pixels, every 32 pixels), and these regions are assigned to the video input nodes. In each region, the existence of a human is examined by using a human tracker, and the video
feature vectorv(t)= {V1(t),. . .,VNv(t)}is formed. Figures
5c and 5d show the video information (results of human
tracking) and the corresponding video feature vector v(t),
Audio Video 0
Speaker
(a) 70
65
60
55
−50 0 50
Angle (deg)
Le
ve
l
(d
B
)
(b) (c)
Figure4: Example of a state of the Bayesian network and the corresponding audio and video information. (a) Bayesian network state; (b) sound localization; and (c) human tracking.
3.4. Inference of the Bayesian network
Next, a method of estimating the state of the output node
S, given the observation (audio and video feature vectors), is
described. The state ofScan be determined by estimating the
conditional probability ofS,P(S|A1,. . .,ANa,V1,. . .,VNv).
In this paper, it is assumed that the values of allAiand
Vj are conditionally independent, given the value ofS. In
general, audio and visual observations are strongly correlated through a common cause which is described by the value of
S. However, whenSis fixed to a certain value (state), the
dis-tributions of audio and visual observations become nearly
independent because the effect of the common cause is
re-moved from the distribution and only independent noisy fluctuation of observations remains.
Based on this assumption, the conditional
probabil-ity distributionP(S|A1,. . .,ANa,V1,. . .,VNv) can be factored
into the product of the local conditional probabilitiesP(Ai|S)
andP(Vj|S):
PS|A1,. . .,ANa,V1,. . .,VNv
= 1
ZP(S)
Na
i=1 PAi|S
Nv
j=1 PVj|S
, (5)
where
Z= SP(S)
Na
i=1 PAi|S
Nv
j=1 PVj|S
dS. (6)
The state ofSis estimated by evaluating (5) with the
observa-tions,a(t) andv(t), and the previously estimated conditional
probabilities, P(Ai|S) andP(Vj|S). In this paper, the prior
distribution ofS,P(S), is assumed to be uniform.
3.5. Learning of the Bayesian network
The conditional probabilities, P(Ai|S) andP(Vj|S), can be
estimated from training samples prior to the actual opera-tion. Since the process of estimating these conditional
prob-abilities is supervised learning, the state ofSis given as a
su-pervisor for each set of observations,a(t) andv(t).
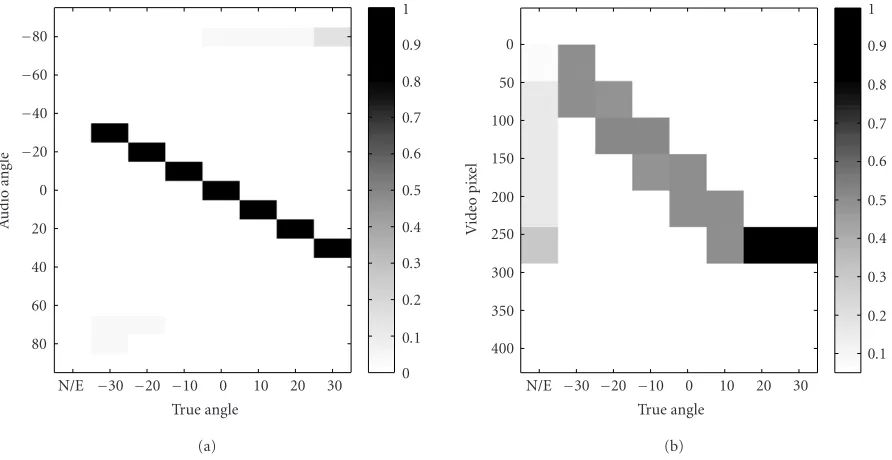
The table describing P(Ai|S) and P(Vj|S) is termed
conditional probability table (CPT), and it functions as the provider of the correspondence between the audio and the video observation spaces. This correspondence can also be obtained by precise calibration. The advantage of obtain-ing this correspondence by learnobtain-ing with real data is to reflect fluctuations of the observation. By doing this, a more robust estimation can be expected.
In this paper, speech data spoken by a single speaker in an ordinary meeting room were used as training samples.
The location of the speaker was varied between −30◦and
+30◦every 5◦. In each sample, the speaker spoke
intermit-tently for 30 seconds. There were no significant noise sources in the meeting room, but there was ordinary background noise such as that from an air conditioner and a PC fan. For these samples, the speech events were detected by a human operator, and the time and the location of the speech events were used as a supervisor for training CPT.
80
Figure5: Audio and video information and the corresponding feature vectors. (a) Running spatial spectrum (audio information); (b) audio feature vector corresponding to (a); (c) human tracking; (d) video feature vector corresponding to (c). A vertical slice of (a) and of (c) corresponding to Figures1aand1b, respectively.
4. SPEECH INTERFACE SYSTEM
Based on the speech event detector developed in the previous sections, the speech interface is constructed in this section.
4.1. Overview of the system
Figure 7 shows a block diagram of the entire system. The input signal is observed using a microphone array and the
spatial spectrum as depicted inFigure 1ais estimated in the
sound localization module. On the other hand, in the human
tracking module, the tracking results as depicted inFigure 1b
are obtained. Using these data, feature vectors,a(t) andv(t),
depicted inFigure 5are formed.
These feature vectors are then fed to the information fu-sion module. Using the feature vectors and the previously ob-tained CPTs, the location and the time of the speech event are estimated.
−80
Figure6: CPTs obtained from the training samples. “N/E” indicates the state “NoEvent.” (a) CPT for audio; (b) CPT for video.
Vision
Figure7: Block diagram of the proposed audio-video information fusion system.
module. In the sound separation module, the target speech is separated from the environmental noise and interferences
by using the ML adaptive beamformer [1]. Based on the
in-formation on the speech events, the inin-formation of the ML
beamformer is updated. As described in detail inSection 4.2,
the location of the target speaker is updated when the speech event occurs. On the other hand, when there are no speech events, the spatial information of noise is updated. Using
the updated beamformer coefficients, the input signal is
pro-cessed.
In the speech recognition module, based on the speech event information, the segments corresponding to the speech events are extracted from the noise-reduced signal sent from the sound separation module and are recognized. The noise-reduced signal is also used for the adaptation of the acous-tic model of the speech recognition in the model adaptation module. In this module, the acoustic model is updated so that it matches the residual noise of the sound separation.
Human
Figure8: Block diagram of the ML beamformer.
4.2. ML beamformer
In the ML adaptive beamformer, the source spectrum is esti-mated as
y(ω,t)=wH(ω)x(ω,t), (7)
where the beamformer coefficient vector is defined as
w(ω)= K−1(ω)ˆg(ω) ˆ
gH(ω)K−1(ω)ˆg(ω). (8)
The matrixK(ω) is the noise spatial correlation observed in
theabsenceof the target speech. The vector ˆg(ω) is the lo-cation vector of the target speech source which can be
esti-mated in thepresenceof the target speech.
Figure 8 is a block diagram of updating of the
beam-former coefficients in the ML adaptive beamformer. Based
Table1: Parameters of the speech recognizer.
Feature parameter MFCC (26 dimensions)
Analysis frame length 25 ms
Analysis frame shift 10 ms
Number of phones 43
Number of mixtures 16/state
Vocabulary size 492
spatial correlationK(ω) is updated in the absence of the
tar-get speech. In the presence of the tartar-get speech, on the other
hand, the location vector for the target ˆg(ω) is updated using
the estimated location of the speech event.
The noise correlationK(ω) used in the ML beamformer
can be approximated by using the observed correlation
ma-trix, R(ω), in which both the target and the noise coexist
in the speech segments. In this case, detection of the target speech is not necessary. The beamformer using the observed
correlation matrix, R(ω), is termed the minimum variance
(MV) beamformer [1]. However, the performance of the
noise reduction of the ML beamformer is much better than
that of the MV beamformer ifK(ω) can be estimated
sepa-rately [13]. In this paper, therefore, the ML beamformer was
employed despite the cost of detecting the speech events.
4.3. Speech recognition and model adaptation
As a speech recognizer, HTK Ver.3.2 [14] was used. As the
initial acoustic model, context-independent phone HMMs
available in the Japanese dictation software [15] was used.
The parameters of the speech recognizer are summarized in Table 1.
At the output of the sound separation module, the signal-to-noise ratio (SNR) is improved by the adaptive beam-former. However, less-directional noise, such as room rever-beration in particular, cannot be removed perfectly. There-fore, adaptation of the acoustic model of the speech recog-nizer to residual noise is required. In this paper, model adap-tation is executed simultaneously as a background process of the speech recognition and the acoustic model is kept up-dated. As a method of adaptation, a combination of MLLR
[16] and MAP [17], in which MLLR-transformed means and
variances were used as the priors for the MAP estimation,
was employed [18]. Since online adaptation is assumed in
this system, correctly labeled data for the adaptation are not available. In this paper, an unsupervised adaptation, in which the phonetic labels for parameter estimation were automat-ically generated using an initial recognizer, was employed
[19].
5. EXPERIMENT
5.1. Condition
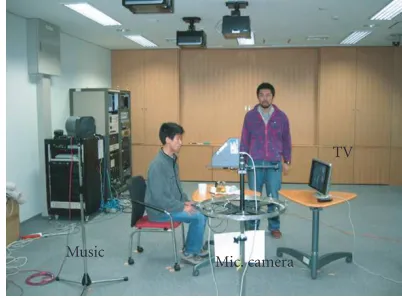
The experiments were conducted in a medium-sized meeting room with a reverberation time of 0.5 second. The setting of
the experiments is shown inFigure 9. The microphone array
used in the experiments was of a circular shape with a
diame-TV
Music
Mic. camera
Figure9: Setting of experiments.
ter of 0.5 m and had 8 microphones. The sampling frequency was 16 kHz. As a camera, Digiclops (Pointgray Research) was employed.
5.2. Experiment 1
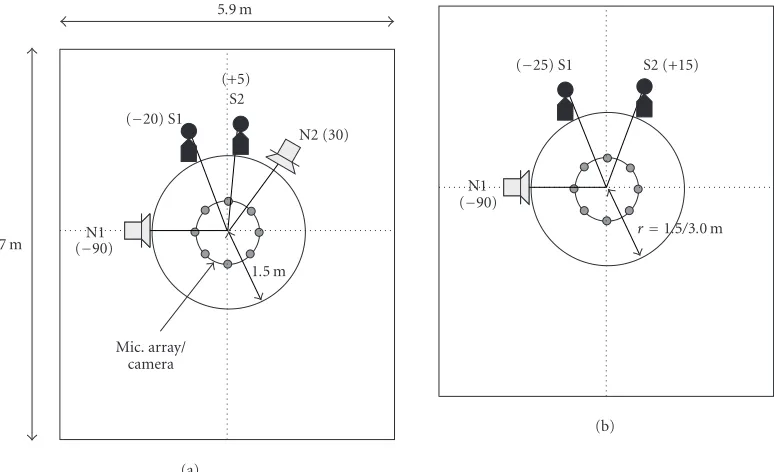
In experiment 1, the proposed speech event detection sys-tem was tested under a realistic scenario. The configuration of sound sources, humans, and microphone array/camera is
shown inFigure 10a. The audio/video information and the
feature vectors shown inFigure 5correspond to this scenario.
As noise sources, a TV and a loud speaker were employed. As
shown inFigure 9, speaker #1 sat in front of the table during
the entire observation and spoke a short sentence at around
t = 15 seconds as depicted in Figure 5. Speaker #2 walked
into the observation space at aroundt=20 seconds, spoke a
short sentence at aroundt=25 seconds, then walked out.
Figure 11apresents the results of inference, which show the detected speech events in the time-direction plane.
Com-paring this with Figure 11b, which shows the true speech
events, it can be seen that the speech events were detected fairly correctly.
Using the information on the detected speech events, the ML beamformer was updated at every time block (every 1 second) and the microphone-array input was processed. The
input/output waveform is shown inFigure 12. InFigure 12b,
bars indicating the detected and the true speech events are
also shown. The segment in which the probability ofS
be-ing in the state of{−30,. . ., +30}is over 0.7 is shown as the
detected speech segment. From these data, it can be seen that the speech signal which was almost buried by the interference was recovered by the ML beamforming.
5.3. Experiment 2
In experiment 2, a quantitative evaluation was conducted us-ing detection rate and the score of ASR. The configuration of
sound sources and humans is shown inFigure 10b. Speakers
#1 and #2 spoke Japanese words alternatively without chang-ing their position. The number of words in the test set was
Nw = 492. The level of the noise was adjusted so that the
5.9 m
(+5) S2
N2 (30) (−20) S1
N1 (−90)
Mic. array/ camera 8.7 m
1.5 m
(a)
S2 (+15) (−25) S1
N1 (−90)
r=1.5/3.0 m
(b)
Figure10: Sound source configuration in (a) Experiment 1 and (b) Experiment 2. The numbers in parentheses indicate angles. S1 and S2 denote humans (speech), N1 denotes loudspeaker (music), and N2 denotes TV (speech + music).
30 20 10 0 −10 −20 −30 N/E
5 10 15 20 25 30 35 Time index
Tr
u
e
an
gl
e
0.9 0.8 0.7 0.6 0.5 0.4 0.3 0.2 0.1 0
(a)
30
20
10
0
−10
−20
−30
5 10 15 20 25 30 35 Time index
An
gl
e
(b)
Figure11: Detected and true speech events. (a) Inference results, (b) true speech segment.
Table 2shows the detection rateRd, the fitting rateRf,
and the coverageRcdefined as
Rd=
No. of correctly detected speech/nonspeech segments
Total no. of segments ,
Rf =
No. of correctly detected speech segments inNd
No. of detected speech segmentsNd
,
Rc=
No. of correctly detected speech segments inNs
No. of speech segmentsNs
.
(9)
In this table, “margin” indicates the additional speech seg-ment attached before and after the detected speech segseg-ment so that a portion of speech with low power such as conso-nants at the beginning or the end of words could be included.
The length of each margin is A: 0 second, B: 0.5 second and
C: 1.0 second. From this table, it can be seen that there is a
trade-offbetweenRd,Rf, andRc. When the margin increases,
the probability of a low-power speech segment at the begning or the end of words being included increases. This is
1 0.8 0.6 0.4 0.2 0 −0.2 −0.4 −0.6 −0.8
0 5 10 15 20 25 30 35
Time (s) True
(a)
1 0.8 0.6 0.4 0.2 0 −0.2 −0.4 −0.6
0 5 10 15 20 25 30 35
Time (s) Estimated
True
(b)
Figure12: Input/separated waveform. The bars indicate the true and the detected speech events. (a) Input, (b) separated.
Table2: Detection rate.
Margin Rd(%) Rf(%) Rc(%)
A (0 s) 85.7 81.0 82.2
B (0.5 s) 74.5 60.3 98.8
C (1.0 s) 53.4 44.4 99.8
When a margin of 0.5 second was employed, almost all the speech segments (98.8%) were covered by the detection. On the other hand, an increase of the margin also results in more nonspeech segments being included. This can be seen in the
decrease ofRdandRf with the increase of the margin.
How-ever, once a portion of speech is not detected and is dis-carded, there is no chance of recovering it in the later stage
of processing. Therefore, the coverageRcis considered to be
more important. In the following speech recognition test, the
margin of B (0.5 second), which exhibited anRcof close to
100% with a smaller decrease ofRdandRf, was employed.
In the speech recognition test, two cases, in which the
ranges of sound sources werer =1.5 m andr =3.0 m, were
tested. The word error rate (WER), defined as
WER=100×Subs. + Dels. + Ins.
Nw
, (10)
where Subs. is the number of substitution errors, Dels. is the number of deletion errors, Ins. is the number of insertion
er-rors, andNw(=492) is the total number of words in the test
set, is shown inTable 3. In this table, the abbreviations used
are as follows: Det.: extraction of speech segments based on the speech event detection, Sep: sound separation, and Adp.: acoustic model adaptation. For example, when only Det. is “on,” the extraction of speech based on speech event detec-tion was employed and sound separadetec-tion and acoustic model adaptation were not conducted.
Table3: Word error rate.
Condition Processing WER
Det. Sep. Adp. r=1.5 m r=3.0 m
A On 70.3% 90.4%
B On On 20.3% 45.7%
C On 74.0% 136.0%
D On On On 8.9% 19.9%
FromTable 3, it can be seen that by employing front-end processing, that is, speech segment extraction and sound
sep-aration, a WER around 20% was achieved whenr =1.5 m as
indicated in condition B. On the other hand, in condition C in which speech segment extraction was not conducted, continuous speech recognition was employed. In this case, it
can be seen that WER is over 100% when r = 3.0 m, and
that many insertion errors occurred. In case D in which all three types of processing were employed, a WER of less than
10% was achieved whenr=1.5 m, which is considered to be
within a practical range.
6. DISCUSSION
6.1. Necessity of audio and video information fusion
In this section, a brief discussion is presented on the necessity of audio and video information fusion based on the experi-mental results.
In Experiment 1 shown in Section 5.2, the noise from
N2 included a speech signal as well as a music signal. In the conventional approach using only audio information such as VAD, the noise from N2 would also have been detected as target speech and would have caused a serious degradation in ASR performance for the real target speech from S1 and
not detected by the proposed method. This is the effect of combining the audio and video information.
On the other hand, in signal separation, it is possible to use only video information (human tracking results) for steering the beamformer so that it tracks humans. When using only video information, information on the pres-ence/absence of the target speech is not available. Thus, in this case, a beamformer which can be used without infor-mation on the presence/absence of the target (e.g., the MV
beamformer [1]) must be used. However, the performance
of the ML beamformer is higher than that of the MV beam-former, if the information on presence/absence of the target
is given (see, e.g., [13], in which the ML beamformer is
de-noted as the MV beamformer designed withK(ω)).
There-fore, the information on the presence/absence of the target obtained from the audio and video information plays an im-portant role in the signal separation.
The information on the presence/absence of the target also plays an important role in speech recognition. As
indi-cated in Table 3, even when signal separation is employed,
WER was more than 70% (condition C). WER reached
around 20% (r = 1.5 m) only when signal separation was
combined with segmentation based on information on the presence/absence of the target (condition B).
6.2. Accuracy of estimation
In the proposed method, various types of estimation such as sound localization, human tracking, and the Bayesian net-work are included. In this section, we discuss the accuracy of
each estimation and its effect over the entire performance of
the system.
In sound localization, the number of sources,N, is
re-quired as indicated in (2). In the experiment shown in
Section 5, the value of N was fixed toN = 3. Obviously, this was not always correct. For example, when the target
speech was absent in Experiment 1, N = 2. However, the
effect of an incorrect number of sources was small in the
cases tested in this paper. In the MUSIC estimator described inSection 2.1,Npeaks are always generated whereNis the
number of sources specified in (2). Since the MUSIC
estima-tor employs principal component analysis (PCA),N
princi-pal components (the components with large power) are ex-tracted from the sound field and the peaks corresponding to them are generated. When the actual number of sources is
smaller thanNin (2), the MUSIC estimator may yield ghost
peaks such as those corresponding to wall reflections. For
ex-ample, the active nodes in 80◦inFigure 5bare considered to
be wall reflections of noise source N1. By combining the au-dio and video information, these ghost peaks were not de-tected as target speech. However, when the location of the ghost coincides with the human position, this will be de-tected as a target speech event. Several methods of
estimat-ing the number of sourcesNhave been proposed by the
au-thors of [20] and other researchers (see, e.g., [21]). However,
most of these methods are based on the eigenvalue analysis
of the spatial correlationR(ω), and the discrimination of the
real sound sources and the virtual sound sources generated
by reflections is difficult in these methods. Other
informa-tion such as range informainforma-tion (e.g., comparison of range estimated by audio information and video information) may improve the performance in these critical situations.
In human tracking using video information, the position of a human subject on a video screen is not only a func-tion of the direcfunc-tion of the human but also a funcfunc-tion of the range. Therefore, the mapping between the audio coordinate
and the video coordinate shown inFigure 6will change as a
function of range. For the range tested in this paper, that is,
r =1.5−3.0 m, the effect of range was small and the mapping
shown inFigure 6was valid in these ranges. This is
consid-ered to be due to the fact that a relatively wide video region (32 pixels) is assigned to each node of the Bayesian network. However, in the preliminary test, it was observed that the
de-tection sometimes failed whenr < 1.0 m and the image of
the human subject covered a large part of the video screen.
In this case, the CPTs shown inFigure 6were no longer valid.
In the close range, in particular, a different approach such as
use of the mouth motion detector (MMD) or a combination
of MMD and the audio information would be effective [4].
In connection with the above issue, the audio and the video region assigned to the nodes of the Bayesian network should be optimized in future studies. Improvement of the basic resolution of the sound localization and human track-ing is beyond the scope of this study. However, the optimiza-tion of the region for extracting the feature vector from the audio and the video information may improve detection per-formance in a critical situation such as when the target source and the noise source are close. In the example shown in Ex-periment 1, the angle between the target source S2 and the
noise source N2 was around 25◦. This was the most critical
condition of the cases tested in this paper, and S2 was well discriminated from N2. The limitation of the proposed ap-proach should be investigated in a more critical situation in future studies.
Finally, room dependency of the detection is discussed.
The CPTs shown in Figure 6 were obtained with data
ob-tained in the room depicted inFigure 9. The same room was
used for the experiments described inSection 5. Therefore,
there is no mismatch between the environment for learn-ing and the operation. Currently, the proposed method has been realized as a real-time system and has been tested in our demonstration room, which has a similar reverberation
time (0.4–0.5 second) but has a completely different
config-uration. A similar performance has been obtained without
changing the CPTs [22]. This is because the CPTs shown
in Figure 6mainly describe the mapping between the au-dio and video coordinates, and this mapping will not dra-matically change in rooms with similar or less reverberation time. However, for rooms with longer reverberation time, the variance of the sound localization will increase, and this
will affect the CPTs. Also, under different lighting
condi-tions, the accuracy of the human tracker may change, and
this may affect the CPTs. Currently, it takes 10–15 minutes to
7. CONCLUSION
In this paper, a method of detecting speech events in a multiple-sound-source condition based on the fusion of au-dio and video information was proposed. As a result of the inference of the Bayesian network which was employed to fuse the information, the time and the location of the speech events can be estimated. The results of the experiment in a real environment showed that speech events were correctly detected by the proposed method in the presence of environ-mental noise and interference.
The information on the detected speech events was then utilized in the robust speech interface. By combining the proposed speech event detector with sound separation, speech recognition, and acoustic model adaptation, the sys-tem achieved a WER of approximately 10–20% in a noisy en-vironment.
As a tool for fusing the audio and video information, a Bayesian network was used. In this paper, the main function of the Bayesian network is to establish the correspondence of the audio coordinate (in angles) and the video coordinate (in pixels) with the ambiguity in the estimation being taken into account.
In a future study, more information sources should be included to achieve greater robust speech event detection. In this paper, any sound coming from humans was detected as a speech event. This can be avoided by employing additional
information such as a mouth motion detector [4,23] or VAD.
In the Bayesian network, adding other information sources is realized simply by adding other input nodes. This is consid-ered to be a great advantage of using a Bayesian network.
ACKNOWLEDGMENT
A part of this work was supported by KAKENHI 14208033.
REFERENCES
[1] D. Johnson and D. Dudgeon,Array Signal Processing: Concepts and Techniques, Prentice Hall, Englewood Cliffs, NJ, USA, 1993.
[2] J. Lim, Ed., Speech Enhancement, Prentice Hall, Englewood Cliffs, NJ, USA, 1983.
[3] V. Gilg, C. Beaugeant, M. Schoenle, and B. Andrassy, “Methodology for the design of a robust voice activity detec-tory for speech enhancement,” inProc. International Work-shop on Acoustic Echo and Noise Control, pp. 131–134, Kyoto, Japan, September 2003.
[4] T. Chaodhury, J. Rehg, V. Pavlovic, and A. Pentland, “Boosted learning in dynamic Bayesian networks for multimodal detec-tion,” inProc. International Conference on Information Fusion, vol. 1, pp. 550–556, Annapolis, Md, USA, July 2002. [5] A. Christian and B. Avery, “Digital smart kiosk project,” in
ACM’s Special Interest Group on Computer-Human Interaction, pp. 155–162, Los Angeles, Calif, USA, April 1998.
[6] F. Asano, Y. Motomura, H. Asoh, T. Yoshimura, N. Ichimura, and S. Nakamura, “Fusion of audio and video information for detecting speech events,” inProc. International Conference on Information Fusion, vol. 1, pp. 386–393, Cairns, Queensland, Australia, July 2003.
[7] F. Asano, Y. Motomura, H. Asoh, et al., “Detection and sepa-ration of speech segment using audio and video information fusion,” inProc. European Conference on Speech
Communi-cation and Technology, pp. 2257–2260, Geneva, Switzerland, September 2003.
[8] T. Yoshimura, F. Asano, Y. Motomura, et al., “Detection of speech events in real environments through fusion of audio and video information using Bayesian networks,” inProc. In-ternational Workshop on Acoustic Echo and Noise Control, pp. 319–322, Kyoto, Japan, September 2003.
[9] R. O. Schmidt, “Multiple emitter location and signal parame-ter estimation,” IEEE Transactions on Antennas and Propaga-tion, vol. AP-34, no. 3, pp. 276–280, 1986.
[10] C. Eveland, K. Konolige, and R. C. Bolles, “Background mod-eling for segmentation of video-rate stereo sequences,” in Proc. IEEE Computer Society Conference on Computer Vision and Pattern Recognition, pp. 266–271, Santa Barbara, Calif, USA, June 1998.
[11] F. Jensen, Bayesian Networks and Decision Graphs, Springer, New York, NY, USA, 2001.
[12] ISIF, Ed., Proc. 5th International Conference on Information Fusion, ISIF, Annapolis, Md, USA, 2002.
[13] F. Asano, S. Hayamizu, T. Yamada, and S. Nakamura, “Speech enhancement based on the subspace method,” IEEE Transac-tions on Speech and Audio Processing, vol. 8, no. 5, pp. 497–507, 2000.
[14] S. Young, G. Evermann, D. Kershaw, et al., The HTK Book, Version 3.2, Cambridge University Engineering Department, Cambridge, UK, 2002.
[15] K. Itou, K. Shikano, T. Kawahara, et al., “Ipa japanese dic-tation free software project,” inProc. International Conference on Language Resources and Evaluation, pp. 1343–1349, Athens, Greece, May 2000.
[16] C. Leggetter and P. Woodland, “Maximum likelihood linear regression for speaker adaptation of continuous density hid-den Markov models,” Computer Speech & Language, vol. 9, no. 2, pp. 171–185, 1995.
[17] J. Gauvain and C. Lee, “Maximum a posteriori estimation for multivariate Gaussian mixture observations of Markov chains,” IEEE Transactions on Speech and Audio Processing, vol. 2, no. 2, pp. 291–298, 1994.
[18] E. Thelen, X. Aubert, and P. Beyerlein, “Speaker adaptation in the Philips system for large vocabulary continuous speech recognition,” inProc. IEEE International Conference on Acous-tics, Speech, and Signal Processing, vol. 2, pp. 1035–1038, Mu-nich, Germany, April 1997.
[19] J. Ogata and Y. Ariki, “Unsupervised acoustic model adapta-tion based on phoneme error minimizaadapta-tion,” inProc. Inter-national Conference on Spoken Language Processing, vol. II, pp. 1429–1432, Denver, Colo, USA, September 2002.
[20] K. Yamamoto, F. Asano, W. Rooijen, T. Yamada, and N. Kitawaki, “Estimation of the number of sound sources using support vector machines and its application to sound source separation,” inProc. IEEE International Conference on Acoustics, Speech, and Signal Processing, vol. V, pp. 485–488, Hong Kong, China, April 2003.
[21] M. Wax and T. Kailath, “Detection of signals by information theoretic criteria,”IEEE Trans. Acoust., Speech, Signal Process-ing, vol. 33, no. 2, pp. 387–392, 1985.
[22] K. Yamamoto, N. Kitawaki, F. Asano, I. Hara, J. Ogata, M. Goto, H. Furukawa, and T. Kamashima, “Real-time im-plementation and evaluation of speech event detection and separation based on the fusion of audio and video informa-tion,” inProc. of GSPx, Santa Clara, Calif, USA, September 2004.
Futoshi Asanoreceived the B.S. degree in electrical engineering, and the M.S. and Ph.D. degrees in electrical and commu-nication engineering from Tohoku Uni-versity, Sendai, Japan, in 1986, 1988, and 1991, respectively. From 1991 to 1995, he was a Research Associate at Research Insti-tute of Electrical Communication (RIEC) in Tohoku University. From 1993 to 1994, he was a Visiting Researcher at The
Ap-plied Research Laboratory (ARL) in Pennsylvania State Univer-sity. From 1995 to 2001, he was with the Electrotechnical Lab-oratory, Tsukuba, Japan. Currently, he is a Group Leader in the National Institute of Advanced Industrial Science and Technology, Tsukuba, Japan. His research interests include array signal process-ing, adaptive signal processprocess-ing, statistical signal processprocess-ing, and speech recognition.
Kiyoshi Yamamoto received the B.E. and M.E. degrees from the University of Tsukuba, Tsukuba, Japan, in 2001 and 2003, respectively. Presently, he is a candidate for the Ph.D. degree in the Graduate School of Systems and Information Engineering, University of Tsukuba. His research inter-ests include array signal processing and sound source separation. He is a Member of the Acoustical Society of Japan (ASJ).
Isao Harais a Senior Researcher at the Na-tional Institute of Advanced Industrial Sci-ence and Technology (AIST), Japan. His in-terests include humanoid robot, multiagent system, and robot control. He received his B.S., M.S., and Ph.D. in electrical engineer-ing from Kyushu University.
Jun Ogatais a Research Scientist at the Na-tional Institute of Advanced Industrial Sci-ence and Technology, Japan. His research interests include speech recognition and understanding, and spoken dialogue sys-tem. He received his B.S., M.E., and Ph.D. from the Ryukoku University, Japan.
Takashi Yoshimurareceived the B.E. degree in electrical and electronic engineering and the M.E. degree in information processing from Tokyo Institute of Technology, Tokyo, Japan, in 1989, and 1991, respectively. From 1991 to 2001, he was a Researcher at Ma-chine Understanding Division, the Elec-trotechnical Laboratory, Tsukuba, Japan. Since 2001, he has been with National In-stitute of Advanced Industrial Science and
Technology (AIST), Tsukuba, Japan, and is currently a Researcher of Media Interaction Group, Information Technology Research In-stitute. His main areas of research interests are voice activity de-tection, speech processing, and multimodal signal processing. He is a Member of the Acoustic Society of Japan and the Institute of Electronics, Information and Communication Engineers.
Yoichi Motomura is working at the Na-tional Institute of Advanced Industrial Sci-ence and Technology Digital Human Re-search Center as a Senior ReRe-search Scientist. He joined the Electrotechnical Laboratory in 1993. He was working on statistical learn-ing algorithms, probabilistic models, and their applications to intelligent robots. He developed Bayesian network software that constructs models from data and executes
approximate probabilistic reasoning. In 1999, he was invited to the University of Amsterdam, where he worked for robot localization using probabilistic prediction methods. His current research inter-ests include applying Bayesian networks for user modeling, mod-eling of human behaviors in living rooms for accident prediction, adaptive and interactive systems in cars, and probabilistic reason-ing algorithms.
Naoyuki Ichimurareceived the B.E. degree in communication engineering in 1989 and the M.S. and Ph.D. degrees in electronic engineering in 1991 and 1996, all from the University of Electro-Communications, Tokyo, Japan. He is a Senior Research Sci-entist at the National Institute of Advanced Industrial Science and Technology (AIST), Tsukuba, Japan. He was a Visiting Scholar of the Computer Science Department at
Columbia University from 2002 to 2004. His current research inter-ests are computer vision, computer graphics, and time series anal-ysis. He is a Member of IEEE, the Institute of Electronics, Informa-tion and CommunicaInforma-tion Engineers (IEICE), the Society of Instru-ment and Control Engineers (SICE), and the Information Process-ing Society of Japan (IPSJ).
Hideki Asohreceived his B.Eng. degree in mathematical engineering and M.Eng. de-gree in information engineering from the University of Tokyo, in 1981 and 1983, re-spectively. In April, 1983, he joined the Electrotechnical Laboratory as a Researcher. From 1990 to 1991, he stayed at the Ger-man National Research Center for Informa-tion Technology as a Visiting Research Sci-entist. Since April 2001, he is a Senior