Proceedings
Rheumatoid arthritis-associated gene-gene interaction
network for rheumatoid arthritis candidate genes
Chien-Hsun Huang
1, Lei Cong
1, Jun Xie
2, Bo Qiao
1, Shaw-Hwa Lo*
1and Tian Zheng*
1Addresses:1Department of Statistics, Columbia University, 1255 Amsterdam Avenue, 10thFloor, MC44690, New York, New York 10027, USA and2Department of Statistics, 250 North University Street, Purdue University, West Lafayette, Indiana 47907, USA
E-mail: Chien-Hsun Huang - ch2526@columbia.edu; Lei Cong - congl@stat.columbia.edu; Jun Xie - junxie@stat.purdue.edu; Bo Qiao - bq2108@columbia.edu; Shaw-Hwa Lo* - slo@stat.columbia.edu; Tian Zheng* - tzheng@stat.columbia.edu *Corresponding author
fromGenetic Analysis Workshop 16 St Louis, MO, USA 17-20 September 2009
Published: 15 December 2009
BMC Proceedings2009,3(Suppl 7):S75 doi: 10.1186/1753-6561-3-S7-S75
This article is available from: http://www.biomedcentral.com/1753-6561/3/S7/S75
©2009 Huang et al; licensee BioMed Central Ltd.
This is an open access article distributed under the terms of the Creative Commons Attribution License (http://creativecommons.org/licenses/by/2.0), which permits unrestricted use, distribution, and reproduction in any medium, provided the original work is properly cited.
Abstract
Rheumatoid arthritis (RA, MIM 180300) is a chronic and complex autoimmune disease. Using the North American Rheumatoid Arthritis Consortium (NARAC) data set provided in Genetic Analysis Workshop 16 (GAW16), we used the genotype-trait distortion (GTD) scores and proposed analysis procedures to capture the gene-gene interaction effects of multiple susceptibility gene regions on RA. In this paper, we focused on 27 RA candidate gene regions (531 SNPs) based on a literature search. Statistical significance was evaluated using 1000 permutations. HLADRB1
was found to have strong marginal association with RA. We identified 14 significant interactions (p< 0.01), which were aggregated into an association network among 12 selected candidate genes
PADI4, FCGR3, TNFRSF1B, ITGAV, BTLA, SLC22A4, IL3, VEGF, TNF, NFKBIL1, TRAF1-C5, and MIF. Based on our and other contributors’findings during the GAW16 conference, we further studied 24 candidate regions with 336 SNPs. We found 23 significant interactions (p-value < 0.01), nine interactions in addition to our initial findings, and the association network was extended to include candidate genesHLA-A,HLA-B,HLA-C,CTLA4, andIL6. As we will discuss in this paper, the reported possible interactions between genes may suggest potential biological activities of RA.
Background
Rheumatoid arthritis (RA) is a common inflammatory disorder with complex etiology. Although the causes of RA are still unclear, it is believed to be attributed to both genetic and environmental factors. During the last few decades, many new genetic regions have been identified
to associate with RA. Remmers et al. [1] showed that
STAT4was an important genetic marker for both RA and systemic lupus erythematosus susceptibility. Kurreeman et al. [2] applied the candidate gene approach to the
TRAF1-C5 region and found a polymorphism that increased the susceptibility and severity of RA. Plenge
et al. [3] studied 14 candidate genes and found significant associations between RA and PTPN22,
CTLA4, and PADI4. Although many genes have shown suggestive connections with RA, only HLADRB1 and
PTPN22have been confirmed to increase the genetic risk of developing RA [4]. An explanation for the large number of identified genes might lie in the existence of gene-gene interactions, which, while helpful in identify-ing and compilidentify-ing genes, also made the analysis much more complicated.
The traditional approaches used in association studies analyze markers marginally one at a time. As a result, valuable information on the interactions of genes was lost. Zheng et al. [5] proposed an association measure, the genotype-trait distortion (GTD), for evaluating association information on unphased multilocus geno-types from case-control data. GTD was shown to be able to capture interactions between markers that were associated with the disease [5].
Many current association studies are based on dense single-nucleotide polymorphism (SNP) data, with multi-ple SNPs corresponding to one gene. SNP-based meth-ods are used to identify and replicate the most significant SNP. Without considering the dependence and func-tional relevance among SNPs within the same gene, most SNP-based association analysis may lead to false-negative results. As marker density increases, one could consider a gene-based analysis that offers a number of advantages, for instance, taking into account possible multiple disease-associated functional variants within a gene and overcoming the dependence among SNPs due to close proximity. In this study, we used the GTD score and applied a gene-based analysis on two sets of RA candidate genes from the North American Rheumatoid Arthritis Consortium (NARAC) data as part of Problem 1 of the Genetic Analysis Workshop 16 (GAW16).
Methods
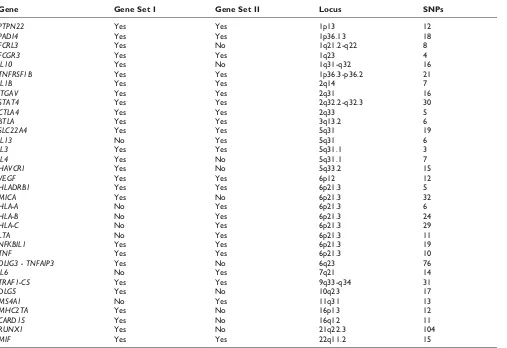
Gene Set IThe Illumina data set of GAW16 Problem 1 consists of 545,080 SNPs genotyped on 868 RA cases and 1194 unaffected controls from NARAC. In our study, 531 SNPs from 27 candidate gene regions were considered (Table 1). The SNPs numbers and locations were identified by using the SNP mapping information from the National Cancer Institute’s Cancer Genetic Markers of Susceptibility (CGEMS) initiative [6]. We included all related SNPs within each gene in the analysis. These 27 candidate genes were selected based on our search of the RA literatures. Among these 27 candidate genes,
HLADRB1 and PTPN22 have been widely studied and confirmed to be associated with RA risk. Some of the
candidate genes (PADI4, FCRL3, FCGR3, TNFRSF1B,
STAT4, CTLA4, IL4, HAVCR1, TNF, MICA, NFKBIL1,
OLIG3-TNFAIP3, TRAF1-C5, MHC2TA, and MIF) have been replicated in different populations. A few candidate genes (IL10, BTLA, IL1B, ITGAV, SLC22A4, IL3, VEGF, and RUNX1) showed positive association in individual studies but have not been replicated in other indepen-dent data sets. In addition, we also included DLG5and
CARD15because they were found to be associated with several autoimmune diseases. SNPs with missing data were imputed by fastPhase [7].
Gene Set II
After the gene × gene interaction group discussion during the GAW16 conference, 24 candidate genes were selected for further analysis based on the contributors’ findings (Table 1), 17 of which were considered in our original analysis (Gene Set I). The seven added genes are IL13,
HLA-A,HLA-B,HLA-C,LTA,IL6, andMS4A1, which were identified in other contributors’studies. In other words, we applied our method to re-analyze the same RA data with different candidate genes from Gene Set I.
Methods
Given k SNP makers, there are 3k possible unphased genotypes. We can use the following GTD statistic defined on the sum of squared difference between genotypes’ relative frequency among the cases and controls to measure the joint effects of these kSNPs on the disease status, i.e.,
The statistic ν and its variations have been applied successfully in a number of studies [5,8-10]. Specifically, GTD was applied to a candidate gene study of RA during GAW15 [10] and identified significant higher-order interactions that were missed by other methods such as the multifactor dimensionality reduction (MDR) [10-12].
To identify significant interactions, we applied 1000 permutations of the case-control outcomes as in Lo et al. [13]. Based on ν, we applied the following gene-based analysis procedures developed by Lo et al. [13] to analyze our data sets:
2. We randomly permuted the labels of case (Y= 1) and control (Y= 0) and repeated Step 1 on the permuted data while the original dependence among SNPs in each gene were retained.
3. To find the pair-wise interaction among thelgenes, we examined l × (l-1)/2 gene pairs. We first calculated the interaction genotype statistics vi jd e form× (m-1)/2 SNP pairs (k= 2) and defined the SNP-wise interaction as the ratio of incremental interaction versus the maximum of the two marginal effects as in Eq. (2) where“∨“stands for maximum of the two values.
r i j vid je vid v je
vid v je
d e
( , )= − ∨
∨ (2)
Second, we defined the interaction between genesiandj
as the average of all SNP-wise ratios in Eq. (3). The ratio is termed as the “mean interaction ratio,” Mean-ratio, or
R statistic. In addition, we also defined the gene-level “average maximum marginal,”orM, as in Eq. (4).
R e r id je
m j d mi
mim j
ij= =
∑ =
∑ 1 ( , )
1 (3)
M e vid v je
m j d mi
mim j
ij=
∨ = ∑ =
∑ 1( )
1 (4)
4. Applying the calculation outlined in Step 3 on the permuted data sets, we obtained a set ofl× (l-1)/2 values {(Mij( )p ,Rijp);1≤ < ≤i j l} for each permutation p. The
Mean-ratio curve method of the following was applied to identify significant gene-pairs. All 1000 ×l× (l-1)/2 points were put on the (M, R) plane and separated into 100 bins according to theMvalues. Each bin had 10 ×l× (l-1)/2 points. For each bin, we identified the 99 percentile of the
R statistics (R*) that fell within this bin. By fitting a smoothing spline between the mid-values of each bin (M*) and R*, we constructed the 99% R threshold curve conditioning on M. We identified gene-pairs with observed R statistics above the threshold curve as significant.
Table 1: RA candidate genes
Gene Gene Set I Gene Set II Locus SNPs
PTPN22 Yes Yes 1p13 12
PADI4 Yes Yes 1p36.13 18
FCRL3 Yes No 1q21.2-q22 8
FCGR3 Yes Yes 1q23 4
IL10 Yes No 1q31-q32 16
TNFRSF1B Yes Yes 1p36.3-p36.2 21
IL1B Yes Yes 2q14 7
ITGAV Yes Yes 2q31 16
STAT4 Yes Yes 2q32.2-q32.3 30
CTLA4 Yes Yes 2q33 5
BTLA Yes Yes 3q13.2 6
SLC22A4 Yes Yes 5q31 19
IL13 No Yes 5q31 6
IL3 Yes Yes 5q31.1 3
IL4 Yes No 5q31.1 7
HAVCR1 Yes No 5q33.2 15
VEGF Yes Yes 6p12 12
HLADRB1 Yes Yes 6p21.3 5
MICA Yes No 6p21.3 32
HLA-A No Yes 6p21.3 6
HLA-B No Yes 6p21.3 24
HLA-C No Yes 6p21.3 29
LTA No Yes 6p21.3 11
NFKBIL1 Yes Yes 6p21.3 19
TNF Yes Yes 6p21.3 10
OLIG3 - TNFAIP3 Yes No 6q23 76
IL6 No Yes 7q21 14
TRAF1-C5 Yes Yes 9q33-q34 31
DLG5 Yes No 10q23 17
MS4A1 No Yes 11q31 13
MHC2TA Yes No 16p13 12
CARD15 Yes No 16q12 11
RUNX1 Yes No 21q22.3 104
5. In addition to the mean ratio R, we used another measure of interaction, theQuantile-ratiostatistic. TheQ
statistic is calculated as the 90thor 95th-quantile of the SNP-wise ratios formed by the mimj SNP pairs. Sig-nificantQijvalues were identified by thecurvemethod.
6. An alternative way to evaluate the statistical signifi-cance is theRankmethod. Similar to Step 4, we have 10 ×
l× (l-1)/2 points in each bin. The values ofRin each bin are ranked from 1 to 10 ×l× (l-1)/2. For each gene pair, the observed Rvalue received such a rank valueT, and the R value from permutation p received a rank value
T(p). Thep-value of the gene-pair is then the proportion of T(p) ≥ T. In this study a significance level of 0.01 is used. The same procedure can also be applied to theQ
statistics calculated in Step 5.
Results
From the average maximum marginal statistics, we observed that all HLADRB1-related gene pairs have the strongest M values. We applied both Mean-ratio and
Quantile-ratio methods to capture the interactions. Thirteen interactions are significant at (p< 0.01) by the
Rankmethod. Seven interactions were identified by the quantile method at 90thand 95thlevel. One interaction (ITGAV and VEGF) was identified by the 90th-Quantile Rank method. The Curve method identified 10 interac-tions, all of which were overlapping with that of theRank
method. Table 2 shows the detailed selection results. In
Figure 1, we reported the 14 significant gene-gene interactions from Gene Set I (3.51 significant interac-tions expected by chance) using red lines.
For Gene Set II (2.76 significant interactions expected by chance), in addition to the interactions identified for Gene Set I (Table 2), another seven interactions were found to be significant by the Mean-ratio Rank method and two additional interactions were found significant by the Curve method. Figure 1 displays the extended networks with these interactions. As seen in Figure 1,
MIFseems to be a“hub”in the association network with nine significant interactions. In addition,IL3,VEGF, and
HLA-B also have at least five significant interactions.
Morand et al. [14] suggested that MIF is a pivotal mediator of RA. In addition, it has been implicated in many roles such as leukocyte recruitment, activation, and the production of pro-inflammatory cytokines. All of the roles contributed to the pathology of RA and showed the importance of MIF. Many interactions identified in our study have been previously discussed in the literature. It has been demonstrated that serum and synovial fluid levels of MIF were well correlated with the VEGF levels in patients with RA [15]. Nakahara et al. [16] indicated that IL-6 blockade directly suppressed VEGF production in synovial fibroblasts and may consequently reduce serum VEGF
levels in patients with RA. Kiriakidis et al. [17] also showed that VEGF production in human macrophages
Table 2: Selected interactions by different proposed procedures (p-value < 0.01)
Curve method Rank method
Mean Ratio 90% Quantile 95% Quantile Mean Ratio 90% Quantile 95% Quantile
IL3 BTLA IL3 BTLA IL3 BTLA IL3 BTLA IL3 MIFa IL3 BTLA
IL3 MIF IL3 MIF IL3 MIF IL3 MIF IL3 PADI4 IL3 MIF
IL3 PADI4 IL3 PADI4 IL3 PADI4 IL3 PADI4 IL3 TRAF1-C5a IL3 PADI4
IL3 SLC22A4 IL3 TRAF1-C5 IL3 TRAF1-C5 IL3 SLC22A4 ITGAV VEGF MIF BTLA
IL3 TNFRSF1B MIF BTLA MIF BTLA IL3 TNFRSF1B MIF BTLAa MIF FCGR3A
IL3 TRAF1-C5 MIF FCGR3A IL3 TRAF1-C5 MIF FCGR3Aa MIF TRAF1-C5
MIF BTLA MIF TRAF1-C5 MIF BTLA MIF TRAF1-C5a
MIF FCGR3A FCGR3A MIF FCGR3A
MIF ITGAV TRAF1-C5a MIF HLA-Ba
MIF TRAF1-C5 MIF ITGAV
MIF CTLA4a MIF TNFRSF1Ba
MIF TRAF1-C5 MIF VEGF NFKBIL1 HLA-Ba NFKBIL1 VEGF NFKBIL1 TNF VEGF IL6a VEGF HLA-Ba HLA-A HLA-Ba HLA-B HLA-Ca
a
was NF-B-dependent, which agreed with our finding of interaction between VEGF and NFKBIL1. VEGF may be directly involved in the activation of RA monocytes and synoviocytes, producing TNF and IL-6 via a receptor-coupling event [18]. As noted in Yoo et al. [18], this may imply a direct interaction between VEGF
and IL-6 or an indirect interaction between VEGF and
TNF via NFKBIL1, also found in our results. Onodera et al. [19] demonstrated that MIF enhanced NFKB binding activities of the nuclear extracts from RA synovial fibroblasts. The NFKBIL1, a divergent member of I--B proteins that is an inhibitor for NFKB complex, may have potential interaction between MIF
and NFKBIL1. In Figure 1, we showed that the indirect connection between MIF and NFKBIL1 via VEGF. Furthermore, the relation between TNF and NFKB-dependent signaling pathway of RA patients was discussed by Youn et al. [20].
Conclusion
In this paper, many relevant candidate regions reported in the literature were chosen for a more detailed analysis. We applied a recently developed method by Lo et al. [13] to identify potential gene-gene interactions that are associated with the susceptibility of RA. First, we found a strong marginal signal betweenHLADRB1 and RA. In addition, the Rank and the Curve methods based on 1000 permutations identified a number of gene-pairs that are significantly associated with RA, many of which
were previously reported in the literature. The associa-tion network constructed in our paper may offer additional evidence and insight on gene-gene interac-tions in the development of RA. Additional experiments and independent data are required to confirm our findings.
List of abbreviations used
CGEMS: Cancer Genetic Markers of Susceptibility; GAW16: Genetic Analysis Workshop 16; GTD: Geno-type-trait distortion; NARAC: North American Rheuma-toid Arthritis Consortium; RA: RheumaRheuma-toid arthritis; SNP: Single-nucleotide polymorphism.
Competing interests
The authors declare that they have no competing interests.
Authors
’
contributions
SL and TZ conceived and designed the research. C-HH, BQ, and LC carried out the data analysis and computa-tion. C-HH, JX, S-HL, and TZ analyzed the results and prepared the manuscript. All authors read and approved the final manuscript.
Acknowledgements
The Genetic Analysis Workshops are supported by NIH grant R01 GM031575 from the National Institute of General Medical Sciences. The CGEMS SNPs mapping information were requested and accessed with Data Access Committee of the National Cancer Institute permission and Figure 1
accessed via the protected portal at http://cgems.cancer.gov/data/. This research was supported by NIH grant R01 GM070789 and NSF grant DMS 0714669.
This article has been published as part of BMC Proceedings Volume 3 Supplement 7, 2009: Genetic Analysis Workshop 16. The full contents of the supplement are available online at http://www.biomedcentral.com/ 1753-6561/3?issue=S7.
References
1. Remmers EF, Plenge RM, Lee AT, Graham RR, Hom G, Behrens TW, de Bakker PI, Le JM, Lee HS, Batliwalla F, Li W, Masters SL, Booty MG, Carulli JP, Padyukov L, Alfredsson L, Klareskog L, Chen WV, Amos CI, Criswell LA, Seldin MF, Kastner DL and Gregersen PK:STAT4 and the risk of rheumatoid arthritis and systemic lupus erythematosus. N Engl J Med 2007, 357:977–986.
2. Kurreeman FA, Padyuko v L, Marque s RB, Schrodi S J, Seddighzadeh M, Stoeken-Rijsbergen G, Helm-van Mil van der AH, Allaart CF, Verduyn W, Houwing-Duistermaat J, Alfredsson L, Begovich AB, Klareskog L, Huizinga TW and Toes RE:A candidate gene approach identifies the TRAF1/C5 region as a risk factor for rheumatoid arthritis.PLoS Med2007,4:e278. 3. Plenge RM, Padyukov L, Remmers EF, Purcell S, Lee AT, Karlson EW,
Wolfe F, Kastner DL, Alfredsson L, Altshuler D, Gregersen PK, Klareskog L and Rioux JD:Replication of putative candidate-gene associations with rheumatoid arthritis in >4,000 samples from North America and Sweden: association of susceptibility with PTPN22, CTLA4, and PADI4. Am J Hum Genet2005,77:1044–1060.
4. Bowes J and Barton A:Recent advances in the genetics of RA susceptibility.Rheumatology2008,47:399–402.
5. Zheng T, Wang H and Lo SH: Backward genotype-trait association (BGTA)-based dissection of complex traits in case-control designs.Hum Hered2006,62:196–212.
6. Meza JE, Brzovic PS, King MC and Klevit RE: Mapping the functional domains of BRCA1 interaction of the ring finger domains of BRCA1 and BARD1. J Biol Chem 1999, 274:5659–5665.
7. Scheet P and Stephens M:A fast and flexible statistical model for large-scale population genotype data: applications to inferring missing genotypes and haplotypic phase.Am J Hum Genet2006,78:629–644.
8. Lo SH and Zheng T: Backward haplotype transmission association (BHTA) algorithm - a fast multiple-marker screening method.Hum Hered2002,53:197–215.
9. Lo SH and Zheng T: A demonstration and findings of a statistical approach through reanalysis of inflammatory b o we l d i s e a s e d a t a . P r o c N a t l A c a d S c i U S A 2 0 04 , 101:10386–10391.
10. Ding Y, Cong L, Ionita-Laza I, Lo SH and Zheng T:Constructing gene association networks for rheumatoid arthritis using the backward genotype-trait association (BGTA) algorithm. BMC Proc2007,1(suppl 1):S13.
11. Ling M, Li X, Yang K, Cui J, Fang B, Guo X and Rotter JI: Evaluating gene × gene and gene × smoking interaction in rheumatoid arthritis using candidate genes in GAW15.BMC Proc2007,1(suppl 1):S17.
12. Ritchie MD, Bartlett J, Bush WS, Edwards TL, Motsinger AA and Torstenson ES: Exploring epistasis in candidate genes for rheumatoid arthritis.BMC Proc2007,1(suppl 1):S70.
13. Lo SH, Chernoff H, Cong L, Ding Y and Zheng T: Discovering interaction among BRCA1 and other candidate genes associated with sporadic breast cancer. Proc Natl Acad Sci USA2008,105:12387–12392.
14. Morand EF, Leech M and Bernhagen J:MIF: a new cytokine link between rheumatoid arthritis and atherosclerosis. Nat Rev Drug Discov2006,5:399–410.
15. Kim HR, Park MK, Cho ML, Yoon CH, Lee SH, Park SH, Leng L, Bucala R, Kang I, Choe J and Kim HY: Macrophage migration inhibitory factor upregulates angiogenic factors and corre-lates with clinical measures in rheumatoid arthritis. J Rheumatol2007,34:927–936.
16. Nakahara H, Song J, Sugimoto M, Hagihara K, Kishimoto T, Yoshizaki K and Nishimoto N: Anti-interleukin-6 receptor antibody therapy reduces vascular endothelial growth factor
production in rheumatoid arthritis. Arthritis Rheum 2003, 48:1521–1529.
17. Kiriakidis S, Andreakos E, Monaco C, Foxwell B, Feldmann M and Paleolog E:VEGF expression in human macrophages is NF-kB-dependent: studies using adenoviruses expressing the endogenous NF-kB inhibitor IkBa and a kinase defective form of the IkB kinase 2.J Cell Sci2003,116:665–674. 18. Yoo SA, Bae DG, Ryoo JW, Kim HR, Park GS, Cho CS, Chae CB and
Kim WU: Arginine-rich anti-vascular endothelial growth factor (Anti-VEGF) hexapeptide inhibits collagen-induced arthritis and VEGF-stimulated productions of TNF-a and IL-6 by human monocytes.J Immunol2005,174:5846–5855. 19. Onodera S, Nishihira J, Koyama Y, Majima T, Aoki Y, Ichiyama H,
Ishibashi T and Minami A: Macrophage migration inhibitory factor up-regulates the expression of interleukin-8 messen-ger RNA in synovial fibroblasts of rheumatoid arthritis patients: common transcriptional regulatory mechanism between interleukin-8 and interleukin-1b.Arthritis Rheum2004, 50:1437–1447.
20. Youn J, Kim HY, Park JH, Hwang SH, Lee SY, Cho CS and Lee SK: Regulation of TNF-alpha-mediated hyperplasia through TNF receptors, TRAFs, and NF-kB in synoviocytes obtained from patients with rheumatoid arthritis. Immunol Lett2002, 83:85–93.
Publish with BioMed Central and every scientist can read your work free of charge
"BioMed Central will be the most significant development for disseminating the results of biomedical researc h in our lifetime."
Sir Paul Nurse, Cancer Research UK
Your research papers will be:
available free of charge to the entire biomedical community peer reviewed and published immediately upon acceptance cited in PubMed and archived on PubMed Central yours — you keep the copyright