R E S E A R C H
Open Access
A multisource fusion framework driven by
user-defined knowledge for egocentric
activity recognition
Haibin Yu
1, Wenyan Jia
2, Zhen Li
3, Feixiang Gong
4, Ding Yuan
5, Hong Zhang
5and Mingui Sun
6*Abstract
Recently, egocentric activity recognition has attracted considerable attention in the pattern recognition and artificial intelligence communities because of its widespread applicability to human systems, including the evaluation of dietary and physical activity and the monitoring of patients and older adults. In this paper, we present a knowledge-driven multisource fusion framework for the recognition of egocentric activities in daily living (ADL). This framework employs Dezert–Smarandache theory across three information sources: the wearer’s knowledge, images acquired by a wearable camera, and sensor data from wearable inertial measurement units and GPS. A simple likelihood table is designed to provide routine ADL information for each individual. A well-trained convolutional neural network is then used to produce a set of textual tags that, along with routine information and other sensor data, are used to recognize ADLs based on information theory-based statistics and a support vector machine. Our experiments show that the proposed method accurately recognizes 15 predefined ADL classes, including a variety of sedentary activities that have previously been difficult to recognize. When applied to real-life data recorded using a self-constructed wearable device, our method outperforms previous approaches, and an average accuracy of 85.4% is achieved for the 15 ADLs.
Keywords:Egocentric activity recognition, Activity of daily living, Multisource fusion, Knowledge-driven model, Dezert–Smarandache theory
1 Introduction
In recent years, a variety of camera-based smart wear-able devices have emerged in addition to smart watches and wristbands, such as Google Glass, Microsoft Sense-Cam, and Narrative. These wearables usually contain not only a camera, but also other sensors such as inertial measurement units (IMUs), global positioning system (GPS), temperature sensors, light sensors, barometers, and physiological sensors. These sensors automatically collect video/image, motion/orientation, environmental, and health data. Because these data are collected from the viewpoint of the wearer, they are called egocentric or first-person data. Tools for the automatic analysis and interpretation of egocentric data have been developed and applied to healthcare [1,2], rehabilitation [3], smart homes/offices [4], sports [5], and security monitoring
[6]. Egocentric activity recognition has now become a major topic of research in the fields of pattern recogni-tion and artificial intelligence [7,8].
Traditional methods of egocentric activity recognition often utilize motion sensor data from the IMU only and process these data using conventional classification tech-niques [9]. However, the performance of motion-based methods depends on the location of the IMU sensor on the body, and the classification accuracy tends to be lower when used to distinguish more complex activities in daily living (ADL), especially for certain sedentary activities. A wearable camera can provide more ADL in-formation than motion sensors alone. Therefore, vision-based activity recognition using a wearable camera has become the focus of research in the field of egocentric activity recognition [10,11].
In recent years, with the continuous development of the deep learning framework, the accuracy of image/video recognition has been improved greatly, and numerous vision-based activity recognition methods, such as deep * Correspondence:[email protected]
6Department of Neurological Surgery, University of Pittsburgh, Pittsburgh, USA
Full list of author information is available at the end of the article
learning, have emerged [12–14]. It has been reported that deep learning achieved a performance improvement of roughly 10% over the traditional trajectory tracking methods [14]. Although there has been significant pro-gress in egocentric ADL recognition, the performance of vision-based methods is still subject to a number of con-straints, such as the location of the wearable camera on the human body, image quality, variations in lighting con-ditions, occlusion, and illumination. In practical applica-tions, no single sensor can be applied for all possible conditions. A common practice to avoid the risk of mis-recognition by a single sensor is to fuse multiple recog-nition results for the same target from different sensors. Therefore, efforts have been made to combine vision and other sensor data for egocentric ADL recog-nition. For example, egocentric video and IMU data captured synchronously by Google Glass were used to recognize a number of ADL events [15]. Multiple streams of data were processed using convolutional neural networks (CNNs) and long- and short-term memory (LSTM), and the results were fused by max-imum pooling. The average accuracy for 20 distinct ADLs reached 80.5%, whereas using individual video and sensor data only yielded accuracies of 75% and 49.5%, respectively. In [16], the dense trajectories of egocentric videos and temporally enhanced trajectory-like features of sensor data were extracted separately and then fused using the multimodal Fisher vector ap-proach. The average recognition accuracy after fusion was 83.7%, compared to 78.4% for video-only and 69.0% for sensor-only data. These results show that, for egocentric ADL recognition, it is beneficial to integrate IMU sensors and cameras at both the hardware and algorithm levels.
Some commonly used multisource fusion methods include Bayesian reasoning, fuzzy-set reasoning, expert systems, and evidence theory composed of Dempster– Shafer evidence theory (DST) [17] and
Dezert–Smaran-dache theory (DSmT) [18]. Among these methods, DST and DSmT have a simple form of reasoning and can rep-resent imprecise and uncertain information using basic belief assignment functions, thus mimicking human thinking in uncertainty reasoning. By generalizing the discernment framework and proportionally redistribut-ing the conflictredistribut-ing beliefs, DSmT usually outperforms DST when dealing with multisource fusion cases with conflicting evidence sources.
In egocentric ADL recognition using evidence theory, an activity model is often required to convert the activity data or features from different sources to the basic belief assignment (BBA). Generally, activity models can be di-vided into two types: data-driven and knowledge-driven [19]. Most ADLs have certain regularities because they occur at a relatively fixed time and place, and interact
with a fixed combination of objects. As a result, abun-dant information about when, where, and how ADLs occur can be used to establish a knowledge base. There-fore, for ADL recognition, the knowledge-driven model is more intuitive and potentially powerful. Although no special knowledge-driven model for egocentric ADL re-cognition currently exists, some knowledge-driven models have been established in fields such as ADL recognition in smart homes, e.g., descriptive logic model [20], event calculus model [21], and activity ontology model [22]. Although these models offer semantic clarity and logical simplicity, they are usually complex. Users must contact the developers to convert their own daily routines into model parameters. Considering that this kind of model is best created by the wearers themselves, the current methods for knowledge representation re-quire substantial simplification to improve their usability and adaptability for egocentric ADL recognition.
In this study, we propose a new knowledge-driven mul-tisource fusion framework for egocentric ADL recognition and apply it to egocentric image sequences and other sen-sor data captured by a self-developed chest-worn device (eButton) [23] for diet and physical activity assessment. The main contributions of this study are as follows:
(1) A knowledge-driven multisource fusion framework based on DSmT is established for the fusion of prior knowledge, vision-based results, and sensor-based results. This framework enables the accurate recog-nition of up to 15 kinds of ADLs, including a variety of sedentary activities that are hard to recognize using traditional motion-based methods, e.g., com-puter use, meetings, reading, telephone use, wat-ching television, and writing.
(2) The proposed knowledge-driven ADL model can be established by the device user. Previously, users were required to consult with an expert who could represent the user’s life experience quantitatively using certain index values. Our framework simpli-fies this process significantly, allowing individuals to express their ADL routines using a set of simple association tables.
(3) A novel activity recognition algorithm based on egocentric images is proposed. With the help of
“bags of tags”determined by CNN-based automatic image annotation, the complex image classification task is reduced to a text classification problem. Furthermore, the entropy-based term frequency-inverse document frequency (TF-IDF) algorithm is used to perform feature extraction and ADL recognition.
detail in Section 2. A series of experimental results de-monstrating the performance of the proposed frame-work are presented in Section 3. The comparison with existing methods is shown in Section 4. Finally, we con-clude this paper in Section 5 by summarizing our approach and results and discussing some directions for future research.
2 Methods
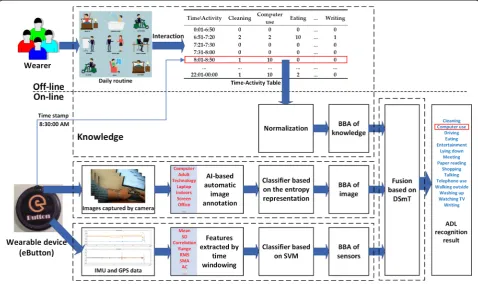
Our multisource ADL recognition method is illustrated in Fig. 1. Conceptually, it consists of four main compo-nents: (1) basic information about the ADL routines of an individual (the user of the wearable device) is acquired using a “condition–activity” association table, (2) a CNN-based automatic image annotation pre-classi-fies the textual results using an entropy representation, (3) a set of motion and GPS data is processed and pre-classified using a support vector machine (SVM), and (4) a final classification is performed analytically by fusing the pre-classified results represented in terms of BBAs based on the DSmT framework.
2.1 BBA of user knowledge
It is widely accepted that “the person who knows you the best is yourself,”although this is not universally true (e.g., a doctor may know better regarding illnesses). Nevertheless, people know their own lifestyle and ADL
routines far better than other people or a computer. Therefore, we develop a knowledge-driven ADL model that can be established by the user of a wearable device. Previously, such a model would require the person to consult an expert who represents the user’s life experi-ence quantitatively using certain index values [20–22]. In our framework, we simplify this process significantly to allow individuals to express their ADL routines using a set of simple association tables.
Let us consider rsources of information ɛ1,ɛ2, …, ɛr. As each source may contain multiple information en-tities, each sourceɛiis represented as a vector. With this definition, we represent pairwise relationships (ɛi, ɛj) from the r sources as a rectangular matrix. The matrix entry in row ɛi and columnɛjexpresses the strength (a positive number) of the relation between these two ele-ments. As the relationship between the two elements is not commutative, i.e., A leads to B does not imply B leads toA, the relationship matrix for (ɛi,ɛj) is generally asymmetric. As an important special case, (ɛi,ɛj) fori=j represents the relationships among the elements of ɛi. According to Zintik and Zupan [24], all (ɛi, ɛj) can be tiled into a large, sparse global matrix.
As our knowledge-driven model runs under the frame-work of the Dezert–Smarandache theory, all activity-re-lated conditions (e.g., time, place, order of occurrence) must be specified through the construction of numerical
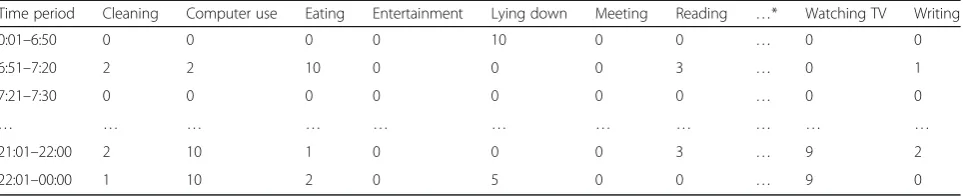
BBAs. Thus, if we view the ADLs and the conditions as different information sources, we can use the above the-oretical framework to represent ADLs in relationships with certain conditions, including their time, place, and order of occurrence, and then fill the pairwise matrices (or tables) numerically. In our application, we require a simple and intuitive form that can be used by individ-uals. Therefore, we design each matrix as an association table containing integer values from 0 (impossible) to 10 (assured). For example, to represent one’s ADLs at dif-ferent clock times, a hypothetical individual’s time–activ-ity table is presented in Table1. In this table, the wearer can adjust the time period according to his/her daily routine, especially activities with relatively clear start times, such as getting up, starting work, leaving work, and sleeping. Multiple time–activity tables may be re-quired for weekdays and weekends/holidays (see the ex-amples in Appendixes 1 and 2). Similarly, a location–
activity table and an activity transition table (i.e., a table specifying the previous activity and the current activity) can be designed to further enrich the knowledge-driven model. Our experiments indicate that such tables can be completed quickly with little training.
Considering that the BBA value for each activity should be between 0 and 1 (see Section 2.4), we apply row-wise normalization according to the sum of all inte-ger values in that row. For the example in Table2, if the clock time is 21:18:00, the corresponding BBA is con-structed by dividing all integer values in the “21:01– 22:00”row by the sum of these values.
2.2 BBA of images
In our case, activity recognition from egocentric images must be performed indirectly, because the person wear-ing the camera is unlikely to appear in the images. We perform the recognition task using the concept of a
combination of objects (CoO) [25, 26]. For example, “computer use” is likely to have a CoO consisting of a computer, monitor, screen, keyboard, and table. When this CoO is fully or partially observed, the underlying ac-tivity can be guessed with a certain degree of confidence. In this study, the two main steps for ADL recognition using the CoO concept are (1) extraction of CoO and (2) construction of an ADL classifier. These steps are de-tailed below.
2.2.1 Semantic feature extraction by CNN
In this study, we are mainly concerned with whether ADL-related objects are present in the input image, ra-ther than their order of presentation (although the order may also carry some information). Ignoring the order, we perform the CoO detection task in two steps. In the first step, all objects in the input image are detected and represented in the form of a textual list. This is essen-tially a process of automatic image annotation. In the second step, we check whether there is a CoO corre-sponding to a particular ADL in the list.
Recently, with the continuous development of the deep learning framework, automatic image annotation can produce impressive image annotation results with the aid of well-trained CNNs. A CNN is a class of deep, feed-forward artificial neural networks that generally in-clude a convolutional layer, a pooling layer, and a fully connected layer. Some well-known pre-trained CNNs in-clude AlexNet [27], VGGNet [28], and ClarifaiNet [29,
30] which are pre-trained using a large image database such as ImageNet [31]. The typical process of automatic image classification and annotation using the pre-trained CNN is shown in Fig. 2 (considering the VGG-16 net-work in VGGNet as an example). The output of the automatic image annotation is a series of textual tags, which can be defined as “bag of tags” (BoTs). As the Table 1Sample time–activity table
Time period Cleaning Computer use Eating Entertainment Lying down Meeting Reading …* Watching TV Writing
0:01–6:50 0 0 0 0 10 0 0 … 0 0
*Six columns (indicated by“…”) are omitted in the table, namely“shopping,” “talking,” “telephone use,” “transportation,” “walking outside,”and“washing up”
Table 2BBA values of the user-provided knowledge of ADLs, based on Table1and a time stamp of 21:18:00
Time period Cleaning Computer use Eating Entertainment Lying down Meeting Reading …* Watching TV Writing
21:01–22:00 0.0488 0.2439 0.0244 0 0 0 0.0732 … 0.2195 0.0488
BoTs are extracted from a specific image, it can be regarded as the high-level semantic feature of the image.
After comparison, we find that the textual tags ex-tracted by ClarifaiNet are more consistent with the ob-jects in the images of our egocentric dataset. Therefore, we use ClarifaiNet and adopt a process exemplified in Fig.2to obtain the BoTs of each frame in the egocentric image sequence, i.e.,
BoTsi¼CNNClarifaiNetð Þ ¼Ii T1i;Ti2;…;TiL
ð1Þ
where Ii is the ith frame in the image sequence,T is the extracted tag, and Lis the number of tags extracted from one frame of the image (when using ClarifaiNet, the default value of L is 20). An example of BoTs is shown in Table3, and the images corresponding to these BoTs are shown in Fig.3.
2.2.2 BBA construction from BoTs
As mentioned above, CNN-produced BoTs can be regarded as a high-level semantic feature from the spe-cific egocentric image. Hence, it can be used in the clas-sification of the ADL corresponding to the image. For example, the tags in Table 3 correspond to two ADLs, “computer use” and “eating.” We can select certain key-words to represent these activities, e.g., “computer use” can be represented by the set {“computer,” “technology,”
“laptop,” “keyboard,” “internet”} and “eating” corre-sponds to the set {“food,” “meat,” “cooking,” “plate”}. Table 3 also indicates that both sets contain some less general or non-distinctive tags such as “no person,” “people,”and“indoors.”Moreover, there may be substan-tial differences among the tags extracted from the same activity class because of different image contexts and ac-quisition parameters (e.g., distance, view angle). Therefore, the classification accuracy depends on selecting tags that not only describe the target activity within a class, but also distinguish activities across classes.
With the BoTs constructed in this way, ADL recognition from egocentric images becomes a semantic textual classi-fication task. We approach this task using the vector space model [32] to represent BoTs and establish a text classi-fier. First, we compute the term frequency-inverse docu-ment frequency (TF-IDF) measure, which is widely used for weighting textual features, given by [33]
tfi;jidfi¼Pni;j knk;j
log j jD
j:ti∈dj;dj∈D
þ1 ð2Þ
wheretfi, jandni, jdenote the term frequency and
num-ber of occurrences of ti in document dj, respectively; ∑knk, j is the sum of the occurrences of all terms in
documentdj (i.e., the total number of terms); idfi is the
inverse document frequency (a measure of whether the
Fig. 2The typical process of automatic image classification and annotation using pre-trained CNN
Table 3BoTs produced by ClarifaiNet for the egocentric images in Fig.3
Image no.
BoTs
1 2 3 4 5 6 7 …
a Computer Technology Business Laptop People Indoors Keyboard …
b Computer Technology Keyboard Internet Laptop Business Electronics …
c Room No person Table Business Computer Indoors Office …
d Computer Technology Laptop Internet No person Business Keyboard …
e Food People Knife Indoors Meat Restaurant Cooking
f Food No person Meat Fish Dinner Meal Plate …
g Food Indoors People Knife Sugar Fruit Cooking …
term is common or rare across all documents) of term
ti; |{j:ti∈dj, dj∈D}| is the number of documents
con-taining term ti in document set D; and |D| is the
num-ber of documents in D. Note that (2) does not apply to the case where the document set contains different types of documents, i.e., it cannot be used directly to classify a BoT set containing different ADLs. To apply TF-IDF to document sets containing multiple types of documents, a number of modified algorithms have been developed, in-cluding bidirectional normalization for the term frequency [34], constraints imposed by the mutual information [35], and the application of information entropy [36]. The entropy-based TF-IDF generally provides better classifica-tion because the statistical features of the terms among different types of documents can be well-represented by the information entropy. We modify the entropy approach by adding an inter-class entropy factore1i,kand an
intra-class entropy factore2ito (2). This allows the BoT
classi-fier to“compact” the intra-class activities while “ separat-ing”inter-class activities, as described below.
Assuming that the total number of the ADLs to be classified isK, the corresponding egocentric image set is A= {A1,A2, …,AK}. For thekth activityAk∈A, the total number of images is |Ak| and all BoTs extracted from each image in Ak constitute the BoT subset BAk ¼ fB1;
BA. For any tag Ti∈T, its inter-class entropy factor for BAk, callede1i,k, can be defined as
where the double equation signs denote “whether the two operands are equal,”resulting in a binary output for the bracketed variable. Using (4), CðBAk;TiÞ can be describe the distribution of tag Ti in BAk, which cor-responds to the particular activity Ak. Moreover, the more uniform the distribution of Ti in BAk, the lar-ger the value of e1i, k and, consequently, the greater the contribution of the Ti to the classification of ac-tivity Ak. Similarly, in (6), e2i is used to describe the distribution of tag Ti across the BoT subsets in BA, which corresponds to all different activities. When e2i reaches its maximum, however, the Ti are
uniformly distributed among the BoT subsets in BA, which means that Ti has no ability to distinguish dif-ferent activities. Therefore, the value of e2i is in-versely proportional to its contribution to the classification, which is the opposite of e1i, k. Balan-cing these two effects, the entropy-based TF-IDF is given by
tfi;kidfie1i;kR eð Þ ¼2i tfi;kidfie1i;k
1− e2i
log2Kþλ
ð9Þ
where R(e2i) = 1−e2i/(log2K+λ) is used to remap e2i
so that its value is proportional to the contribution in the classification. The parameter λ is an empirically determined small positive constant that guarantees
R(e2i) > 0.
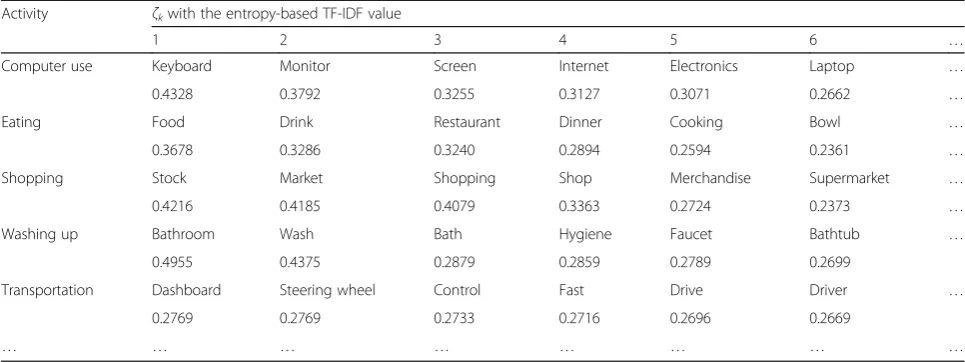
Using (9), the BoT classifier can be obtained by appl-ying a suitable training procedure. Specifically, the entropy-based TF-IDF weight of each tag in the sample BoT set is calculated, and the M tags with the highest weight values are extracted from BAk to form the class center vector ζk corresponding to activity Ak. All class center vectors constitute the BoT classifier, given by
ClassifierB¼fζ1;ζ2;…;ζk;…;ζKg: ð10Þ
An example of the BoT classifier is presented in Table4.
When using the classifier defined in (10), the cosine similarity between the input BoT and the center vec-tor of each class (i.e., ζk) can be calculated, and the class whose center is closest to the input is assigned as the classification result. In addition, as the cosine similarity is between 0 and 1, it can be directly used
to form the BBA for images; an example of this can be seen in the third row (BBA of image) of Table 6.
2.3 BBA of IMU and GPS sensors
For IMU sensors, the output data are multiple 1-D waveforms that can be processed using traditional pat-tern recognition methods [9]. First, the data are divided into non-overlapping segments, and the structural and statistical features of each segment are extracted. These features are used to train a classifier. The training ends when a certain stopping criterion is met.
IMU sensors include an accelerometer and a gyro-scope, each producing three traces of signals in the x-, y-, and z-axes. These signals are divided into 3-s segments without overlapping. To synchronize them with the corresponding images, each segment is cen-tered around the time stamp in the image data. The features extracted in each segment include the mean, standard deviation, correlation, signal range (differ-ence between maximum and minimum), root mean square, signal magnitude area [37], autoregressive coefficients (calculated up to the sixth order), and the binned distribution (selected to be 10) [38]. These features are combined with the GPS velocity and coordinates (if unavailable, the most recent GPS data are used) to form 127-dimentional feature vec-tors that are fed into a multiclass SVM for training and classification.
Support vector machine (SVM) [39] is a supervised machine learning method widely used in classification and regression analysis. SVM can improve the generalization ability of a learning machine by minimiz-ing the structural risk; hence, it can also yield reason-ably good statistical rules for a relatively small sample Table 4Example of the BoT classifier
Activity ζkwith the entropy-based TF-IDF value
1 2 3 4 5 6 …
Computer use Keyboard Monitor Screen Internet Electronics Laptop …
0.4328 0.3792 0.3255 0.3127 0.3071 0.2662 …
Eating Food Drink Restaurant Dinner Cooking Bowl …
0.3678 0.3286 0.3240 0.2894 0.2594 0.2361 …
Shopping Stock Market Shopping Shop Merchandise Supermarket …
0.4216 0.4185 0.4079 0.3363 0.2724 0.2373 …
Washing up Bathroom Wash Bath Hygiene Faucet Bathtub …
0.4955 0.4375 0.2879 0.2859 0.2789 0.2699
Transportation Dashboard Steering wheel Control Fast Drive Driver …
0.2769 0.2769 0.2733 0.2716 0.2696 0.2669
size. The dual objective function of SVM can be given by the Lagrangian multiplier method as shown below
max
where x is the input data,y is the category to which x
belongs, w is the vector perpendicular to the classifica-tion hyperplane,bis the intercept, andαis the Lagrange multiplier.
After solving (11) using the quadratic programming algorithm and introducing the kernel function κ(x1,x2) = (〈x1,x2〉+ 1)2 to map the data to the high-dimensional space, SVM can perform a nonlinear classification accor-ding to the following binary prediction:
gSVMð Þ ¼x signwTxþb
Commonly used kernel functions include polynomial kernel and radial basis function.
The SVM is fundamentally a two-class classifier; however, it can be extended to multiclass problems by using one-against-one or one-against-all voting schemes. In addition, the basic SVM classifier can only output the clas-sification label rather than the probability or possibility for evidence fusion. To solve this problem, the “libsvm” [40] toolkit, which converts the output of the standard SVM to a posterior probability using a sigmoid-fitting method [41], is utilized. An example is provided in the fourth row (BBA of sensors) of Table6.
2.4 Hierarchical fusion of knowledge, image, and sensor data by DSmT
In DSmT, the discernment frameworkΘ= {θ1,θ2, …,θn} is extended from the power set 2Θ in Dempster–Shafer theory to the hyper-power set. The hyper-power set, de-noted by DΘ, admits the intersections of elements on the basis of the power set. For example, if there are two elements in the discernment frameworkΘ= {θ1,θ2}, the power set is 2Θ= {∅,θ1,θ2,θ1∪θ2} and the hyper-power set is DΘ= {∅,θ1,θ2,θ1∪θ2,θ1∩θ2}. The BBA defined on the hyper-power setDΘis
m Xð Þi :DΘ→½0;1; Xi∈DΘ
The combination rule is the core of evidence theory. It combines the BBAs of different sources within the same discernment framework to produce a new belief assign-ment as the output. In the DSmT framework, the most
widely used combination rule is the Proportional Con-flict Redistribution (PCR) rule. There are six PCR rules (PCR1–PCR6), defined in [18]. Their differences are mainly in the method of proportional redistribution of the conflicting beliefs. Among these rules, PCR5 is widely used to combine two sources and PCR6 is usually applied to more than two sources. In particular, PCR6 is the same as PCR5 when there are exactly two sources. If s represents the number of sources, the PCR5/PCR6 combination rule fors= 2 is
mPCR1X⊕25=PCR6ð Þ ¼A used for evidence fusion for the focal elementAin dis-cernment framework DΘ. The PCR6 combination rule fors> 2 is
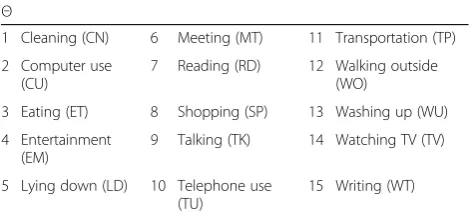
In the proposed approach, when DSmT is used for ADL recognition, the discernment framework contains 15 ADLs, as detailed in Eq. (16) and Table5.
Θ¼fA1;A2;…;A15g ¼
f“cleaning;”“computer use;”“eating;”“entertainment;” “lying down;”“meeting;”“reading;”“shopping;”“talking;” “telephone use;”“transportation;”“walking outside;” “washing up;”“watching TV;”“writing”g
ð16Þ
in the data fusion process. An example of the fusion re-sult from three sources using (15) is presented in Table6. In this example, the BBAs of knowledge, image, and sen-sor data are derived from the time–activity table, cosine similarity between current BoT and class center, and posterior probability of the support vector machine classifier’s output, respectively.
In our case, the information sources differ greatly in the signal type and processing algorithm, e.g., the image source provides a specific combination of ob-jects, whereas the sensor source provides the motion status of the person wearing the device. Hence, the corresponding recognition results are often different. This can be observed in Table 6. For the same activ-ity, the recognition results from the image and sensor sources are “entertainment” and “watching TV,” re-spectively. In fact, “entertainment” (specifically “play-ing poker” in this case) and “watching TV” are both sedentary activities, and it is difficult to distinguish them using motion sensors (both the IMU and GPS sensors). Therefore, the recognition result from the image source should be more reliable. However, after fusion, the final recognition result is “watching TV” because the belief value of “entertainment” assigned by the BBA of the sensors is very low.
Based on previous research [15, 16] and our own study (described in Section 3), most ADLs achieve sig-nificantly higher accuracy when using vision-based data than with motion sensor-based data. Thus, in
many cases, if the three sources of information are fused directly, the accuracy of the output is often af-fected by the low specificity of the motion sensors. However, we still need to use motion sensors to identify ADLs that have significant motion signatures, such as “cleaning,” “walking outside,”and“lying down.”Therefore, considering the reliability of each information source, we consider user knowledge and image sources to be high-priority data and the motion sensor source to be low-priority data, i.e., we supplement the sensor informa-tion only when the fusion of user knowledge and image sources leads to a conflict.
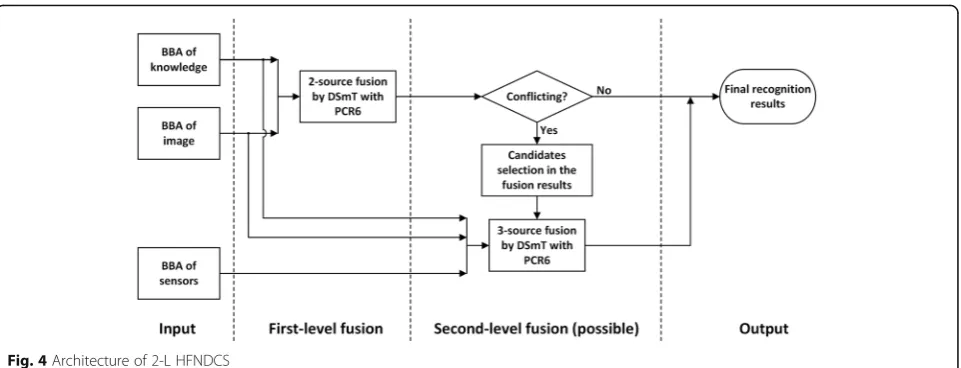
We implement the source-priority concept using a two-level hierarchical fusion network with descend-ing candidate sets (2-L HFNDCS, see Fig. 4), similar to the implementation strategy proposed in [42, 43]. When the two-source fusion between the knowledge and image-based methods provides a conflicting re-sult, motion sensor data are added to the pool of evidence for a second-level three-source fusion. In-stead of considering all activities, only the candidate activities identified by two-source fusion are used as the input for the three-source fusion. The initial number of candidate activities is given in advance, and this number can be adjusted according to subse-quent test results. The output of the final fusion is the activity with the highest belief among the candi-date activities. The 2-L HFNDCS algorithm can be described as follows.
Table 6Example of three-source fusion using the PCR6 rule
CN CU ET EM LD MT RD SP TK TU TP WO WU TV WT
BBA of knowledge 0.1860 0.0233 0.2326 0.1163 0 0 0.0233 0 0.1163 0.1860 0 0.0698 0.0233 0.0233 0
BBA of image 0.0401 0.0260 0 0.4452 0 0.1526 0.0610 0 0.0939 0.1505 0 0 0 0 0.0308
BBA of sensors 0.0041 0.0303 0.0078 0.0558 0.0338 0.0076 0.0077 0.0229 0.1781 0.0264 0.0101 0.0174 0.0178 0.5602 0.0200
Fusion result 0.0565 0.0057 0.0754 0.2561 0.0031 0.0427 0.0103 0.0015 0.1017 0.0960 0.0003 0.0106 0.0022 0.3341 0.0037
Conditions: the time stamp of the camera is 17:30:57 on Thursday. The captured image can be seen in Fig.6(d), and the ground truth is“entertainment”
Italics represent the maximum value of the BBA for all activities of the same information source, and the corresponding activity is the recognition result of that information source
Table 5The description of the discernment framework defined in Eq. (16)
Θ
1 Cleaning (CN) 6 Meeting (MT) 11 Transportation (TP)
2 Computer use (CU)
7 Reading (RD) 12 Walking outside (WO)
3 Eating (ET) 8 Shopping (SP) 13 Washing up (WU)
4 Entertainment (EM)
9 Talking (TK) 14 Watching TV (TV)
5 Lying down (LD) 10 Telephone use (TU)
15 Writing (WT)
Algorithm of 2-L HFNDCS
Input: BBA of knowledge (BBA_k), BBA of vision (BBA_v), BBA of sensors (BBA_s), Number of candidates (Nc)
Output: Activity recognition result (Ax)
(1) Compute Fu1 = PCR6(BBA_k, BBA_v) by two-source PCR6 combination rule in (14)
(2) Let Max_pos(.) denote the position of the maximum in a matrix (3) If Max_pos(Fu1) = = Max_pos(BBA_v) //no conflicts (4) Ax = Max_pos(Fu1)
(5) Else
(6) Sort Fu1, obtain the positions of the first Nc maximums, i.e., Max_pos(Fu1, Nc)
(7) Compute Fu2 = PCR6(BBA_k,BBA_v,BBA_s) using three-source PCR6 combination rule in (15)
3 Experimental results
3.1 Experimental setup and data acquisition
Previously, our laboratory developed eButton (Fig. 5), a disk-like wearable device the size of an Oreo cookie that can be used to study human diet, physical activity, and sedentary behavior [23]. The eButton is equipped with a camera, IMU, and other sensors that are not used for the current study, such as those for measuring the temperature, lighting, and atmospheric pressure. The resolution of the camera is 1280 × 720 pixels. To save power, the camera acquires one image every 4 s. The built-in IMU contains a three-axis accelerometer and a three-axis gyroscope with a sampling frequency of 90 Hz. The GPS data are acquired from the wearer’s mobile phone at 1-s intervals and synchronized with the eBut-ton data using time stamps.
Two volunteers with regular daily routines and rela-tively invariant living environments were selected for our experiments. After signing a consent form ap-proved by the Institutional Review Board, they were asked to fill out the time–activity table described above. Their time–activity tables are provided in Appendixes1
and2. The volunteers then wore the eButton for a rela-tively long time (approximately 10 h per day for about 3 months). To form a gold standard for performance comparison, the resulting egocentric data were manu-ally reviewed and annotated. For regular daily routines, the environment and motion patterns corresponding to certain activities were very similar. In contrast, the fre-quency and duration vary widely among less regular ac-tivities, resulting in a large imbalance among the number of samples corresponding to different activities. To reduce this data imbalance, a key frame extraction method was used [44,45]. As the two eButton wearers each participated in the study for about 3 months, we had sufficient data to form two independent datasets (one for training and one for testing). We combined these data to form an egocentric activity dataset, called the eButton activity dataset [47].
In the eButton activity dataset, each wearer (referred to as W1 and W2) has a separate set of time–activity ta-bles, a training set, and a test set. Although the training set and the test set do not overlap, they both have the same structure: a subset of egocentric images, a subset Fig. 4Architecture of 2-L HFNDCS
of motion sensor data, and a GPS data file. In the subset of egocentric images, each activity to be recognized cor-responds to an image sequence. Each frame in the image sequence was extracted by the key frame extraction method [44, 45]. The number of key frames corre-sponding to different activities is listed in Table 7, and some sample frames are shown in Fig.6. The file name of each key frame includes the specific time stamp. In the motion sensor subset, there is a one-to-one corres-pondence between the motion sensor data and the
images in the image subset, i.e., each image corre-sponds to a motion sensor data file. The motion sensor files contain all raw sensor data (three-axis acceleration and three-axis gyroscope) from within a 3-s window centered around the stamp time of the image. There is also a one-to-one correspondence between the GPS data and the image subset. The GPS data (including time, coordinates, velocity, etc.) are synchronized with the time stamp of an image and recorded in one row of the GPS data file.
Table 7Numbers of key frames in the image subset
Set CN CU ET EM LD MT RD SP TK TU TP* WO WU TV** WT
Training set W1 127 139 115 117 153 99 146 170 79 106 185 101 102 84 97
W2 123 119 149 105 120 84 112 107 80 95 106 97 113 – 108
Test set W1 113 139 155 59 178 92 101 149 70 99 184 146 90 70 125
W2 120 95 159 87 197 95 91 91 42 98 128 98 95 – 109
*Transportation method differs between the two wearers; W1 drives and W2 uses the bus **W2 does not watch TV
Fig. 6The sample image of each activity in the training set. Imagesathroughocorrespond to“cleaning,” “computer use,” “eating,”
3.2 Experimental results
All data were analyzed using Matlab 8.6 on a PC running Windows 10 Pro. To facilitate the performance evaluation and comparison, theF1measure [46], which is commonly used in the field of pattern recognition, was selected as the criterion for evaluating different classification methods. F1 is defined as
F1¼2PR=ðPþRÞ
P¼TP=ðTPþFPÞ; R¼TP=ðTPþFNÞ ð17Þ
where P is precision and R is recall. TP, FP, and FN
represent the number of true samples, false positive samples, and false negative samples, respectively, derived from the confusion matrix. F1 is also called the harmonic mean of recall and precision.
3.2.1 ADL recognition results using images
Bag of tags (BoTs) were extracted from all key frames in both the training and test sets using the ClarifaiNet with
the“General”model [30]. In the process of obtaining the entropy-based TF-IDF classifier for the training set, the positive constantλused to remap itemR(e2i) was empir-ically selected to be 0.01 and the number of tags wasM = 20. The confusion matrices and F1 measures of the recognition results are presented in Figs. 7 and 10, respectively.
The results in Figs. 7 and 10 indicate that the image-based method achieves fairly high recognition ac-curacy for ADLs with different environments and com-bination of objects (CoOs). In contrast, when the classifier is used to distinguish among activities with similar environments and CoOs, the recognition results are less accurate. Specifically, the following situations are notable: (1) The environments and CoOs of different ac-tivities are almost identical. For example, there is no es-sential difference between “reading” and “writing,” except for the presence of a pen. If this key object is not correctly recognized, it is very difficult to distinguish these two activities. (2) Although the objects in use are Fig. 7Confusion matrices for the image-based method as applied toawearer 1 andbwearer 2
not the same, the BoTs extracted from these objects are very similar. For example, the BoTs extracted from “computer use” and “telephone use” are very similar, as both contain tags such as “screen,” “electronics,” and “information,” making it hard to distinguish whether the wearer is using a computer or a telephone. (3) There are overlaps among some activities. For example, overlaps occur among “meeting,” “computer use,” and “talking,” because meetings usually include operating a computer and talking, resulting in errors in some short-term rec-ognition results. Nevertheless, there are usually differ-ences in the duration of these competing activities; for example, computers and telephones are generally not used at the same time, and many meetings have a rela-tively fixed schedule. Additionally, there are some differ-ences among the motion status of activities with similar BoTs, which can be reflected by IMU and GPS sensor data. Therefore, the accuracy of ADL recognition can be further improved by fusing the knowledge and recogni-tion results from the sensors.
3.2.2 ADL recognition results using motion sensors
For the SVM classifier in the sensor-based method, the size of the time window for feature extraction is 3 s; the features extracted from this time window constitute a 127-dimentional vector, as described in Section 2.4. In training the classifier, the SVM uses a radial basis func-tion as the kernel. For the training samples of W1 and W2, the cost and gamma parameters (c, g) were deter-mined using cross-validation to be (16, 0.33) and (5.29, 0.57), respectively. The F1 measure of the sensor-based method when applied to the test datasets of the two wearers is plotted in Fig.10.
As mentioned above, motion sensors usually offer bet-ter discrimination between activities with a clearly differ-ent motion status. As seen in Fig. 10, the motion sensor-based method achieves better recognition accur-acy for activities such as“cleaning,” “lying down,” “trans-portation,” and “walking outside.” For sedentary activities such as “reading,” “telephone use,” “watching TV,” and “writing,”the discrimination is relatively poor. Therefore, the recognition results from the sensor-based method are not suitable for direct fusion with the know-ledge and image-based recognition results; they can only be used as auxiliary evidence in the 2-L HFNDCS algorithm.
3.2.3 Fusion of three data sources using 2-L HFNDCS After obtaining the BBAs of the image and motion sensor-based methods, the 2-L HFNDCS algorithm was applied to fuse this with the knowledge BBA. Analysis of the confusion matrices from the image-based method (Fig. 7) indicates that the most confusing activities are sedentary activities, and no more than three other
activities are frequently confused with each individual sedentary activity. Therefore, in the implementation of 2-L HFNDCS, the number of candidate activities for the second-level fusion was set to Nc = 3. The confusion matrix of the recognition results after fusion using 2-L HFNDCS is presented in Fig. 8. The F1measure of the fusion results for the three sources is illustrated in Fig.10.
3.2.4 Fusion results of the image-based method and the sensor-based method using simplified 2-L HFNDCS
To verify the effect of prior knowledge, the BBA of the knowledge data was removed so that only the image-based results and the sensor-based results were fused. The fusion process still tries to adopt the 2-L HFNDCS algorithm, but the first fusion layer is no longer needed because there is no knowledge BBA. Thus, the algorithm can be simplified. Considering the reliability difference between the image-based and sensor-based results, the process of candidate selection is retained in the second layer and candidate activities are directly selected from the image-based results (note that Nc = 3). The simplified 2-L HFNDCS without knowledge BBA is illustrated in Fig. 9. The F1 measure of the fusion results for the image-based method and the sensor-based method is also illustrated in Fig. 10.
Comparing Figs. 7 and 8, it is clear that the recogni-tion accuracy of confusing activities such as “entertain-ment,” “meeting,” “reading,” and “talking” is greatly improved when the time–activity table is added. More-over, after fusion, the recognition accuracy for some sed-entary activities that cannot be adequately distinguish by the image-based method, such as “computer use,” “ tele-phone use,” “reading,” and“writing,”is also improved to a certain extent. In addition, as seen from Fig. 10, the image-based recognition accuracy of activities that are closely related to the motion status, such as “cleaning,” “lying down,”and“walking outside,”is also improved by the fusion with sensor-based results.
4 Comparison and discussion
multistream long and short-term memory. The recognition results are then fused by means of maximum pooling. In the method of [16], the dense trajectories of egocentric video and the temporally enhanced trajectory-like features of sensor data are extracted separately. The recognition
results are then fused by a multimodal Fisher vector. As the dataset presented in [16] is openly available ( http://people.-sutd.edu.sg/~1000892/dataset), we can compare the results given by the proposed method with those of previous methods based on the same open datasets.
Fig. 9Architecture of the simplified 2-L HFNDCS
a
b
4.1 Performance comparison on their respective datasets
The proposed method was applied to the eButton data-sets (described in Section 3.1), and the other two methods were applied to the dataset described in [16]. Although they were applied to different datasets, all three methods fused the vision and motion sensor data. As a result, the recognition accuracy can be compared for different information sources. The comparison re-sults are presented in Table9, where the average accur-acy is reported over all activities and wearers.
4.2 Discussion of the comparison on the respective datasets
In Table 9, the vision-based accuracy of all three methods is similar. However, there are greater differ-ences in the sensor-based accuracy of the proposed and existing methods, because the eButton dataset contains more sedentary activities that are difficult to distinguish using motion sensors alone, such as “entertainment,” “meeting,” and “watching TV.” Nevertheless, the accur-acy of the proposed method using the fused data is higher than that of the two existing methods, mainly be-cause our framework introduces user knowledge into the recognition process.
4.3 Performance comparison on the same dataset
As the methods proposed in [15, 16] use egocentric video, the vision data are taken from the egocentric video in the open multimode dataset. However, the vision-based method proposed in this paper uses an ego-centric image sequence, so it cannot use this open data-set directly. To enable the proposed method to be applied to the dataset in [16], we must convert the ego-centric video to an egoego-centric image sequence. Each video and its corresponding motion sensor data are 15-s long, and the sampling rate of the motion sensor is 10 Hz. Thus, we can use the same sampling rate to convert the video to an image sequence and form a one-to-one correspondence between the images and the motion sen-sor data. After conversion, the egocentric image set has 20 (activities) × 10 (videos/activity) × (150 frames/video) = 30,000 frames. After extracting 20% of the key frames (6000 frames) using the key frame extraction method, two non-overlapping datasets (training set and test set)
were generated (see Table 10). We define this converted dataset asM-20.
Note that the methods proposed in [15, 16] do not use a prior knowledge model, and so their data (in-cluding the converted dataset M-20) do not contain any prior knowledge, i.e., there is no corresponding time–activity table. Therefore, in applying the pro-posed method to M-20, only the image and motion sensor data were fused. In addition, considering that the activities to be recognized in M-20 are quite dif-ferent from those in the eButton dataset, the same six Table 8Activity categories of the egocentric activity dataset presented in [15]
Ambulation
1 Walking (WO)
2 Walking upstairs (US)
3 Walking downstairs (DS)
4 Riding elevator up (VU)
5 Riding elevator down (VD)
6 Riding escalator up (SU)
7 Riding escalator down (SD)
8 Sitting (ST)
Daily activities
9 Eating (ET)
10 Drinking (DR)
11 Texting (TU)
12 Making phone calls (MP)
Office work
13 Working at PC (CU)
14 Reading (RD)
Table 9Comparison of different methods on their respective datasets
Proposed method (%)
Method proposed in [15] (ConvNets+LSTM) + pooling fusion (%) Method proposed in [16]
(DT + temporal enhanced features) + Fisher vector (%)
Average pooling Maximum pooling
Vision 79.2 68.5% 75.0 78.4
Sensors 43.1 – 49.5 69.0
Fusion 85.4 76.5 80.5 83.7
activities were extracted from the two datasets to evaluate the ability of the proposed method to recognize the same activities in different datasets. The six activities were “eating,” “reading,” “texting” (“tele-phone use” in eButton dataset), “walking” (“walking outside” in eButton dataset), “working at PC” (“com-puter use” in eButton dataset), and “writing sen-tences” (“writing” in eButton dataset). The data from these activities formed a separate subset, defined as MS-6. Both M-20 and MS-6 were used to evaluate the proposed method.
In applying the proposed method toM-20 and MS-6, the parameter values of the entropy-based TF-IDF algo-rithm used for the egocentric images in the training set are consistent with those used to analyze the eButton dataset. The confusion matrices produced by applying the trained BoT classifier to the M-20 and MS-6 test sets are shown in Fig. 11. For the motion sensor data, feature extraction by windowing is not required because there is a one-to-one correspondence with the images produced during the conversion from video to image se-quence, and the motion sensor data frame (a 19-dimensional vector) can be directly used as a feature in training the SVM. The kernel function is again the ra-dial basis function. Using cross-validation, the cost and gamma parameters (c, g) ofM-20 andMS-6 were found to be (256, 9.19) and (5.278, 1.74), respectively. The
confusion matrices produced by applying the trained SVM classifier to the M-20 and MS-6 test sets are shown in Fig.12.
According to Fig. 11, the number of candidate activ-ities in the next fusion process is Nc = 8 (M-20) and Nc = 4 / (MS-6). As there is no time–activity table in the dataset, i.e., there is no knowledge BBA, the simplified 2-L HFNDCS algorithm without prior knowledge (see Section 3.2.4) was employed to obtain the fusion result of the image-based method and sensor-based method. The fusedF1measures ofM-20 andMS-6 are shown in Fig.13. The average of theF1measure over all activities was computed, and a comparison of the proposed method and the methods in [15,16] on the same dataset is presented in Table11.
4.4 Discussion of the comparison on the same dataset
From the results in Table 11, it is apparent that ap-plying the proposed method to M-20 produced much lower recognition performance in the proposed vision-based method than in the existing methods. This is because the vision-based part of the proposed method is based on the combination of objects in the static images, whereas the methods in [15, 16] use vision-based motion features extracted from the video (optical flow [15] and dense trajectories [16]). Thus, for activity pairs with similar scenes but different Table 10Composition of the converted datasetM-20
Set CY DP DT DR ET* MP OF RD VD VU SD SU RN ST TU DS US WO CU WT
Training 150 150 150 150 150 150 150 150 150 150 150 150 150 150 150 150 150 150 150 150
Test 150 150 150 150 150 150 150 150 150 150 150 150 150 150 150 150 150 150 150 150
*Italics indicate that the activity is the same as the corresponding activity in the eButton dataset used in this paper. The same six activities constituteMS-6
Fig. 11The confusion matrices of the trained BoT classifier applied to the test set ofaM-20 andbMS-6.M-20 andMS-6 are the converted
vision-based motion features, such as “riding elevator up” and “riding elevator down,” “riding escalator up” and “riding escalator down,” “walking upstairs” and “walking downstairs,” “walking,” and “running,” the methods in [15, 16] will achieve better recognition performance. Note that, for some outdoor activities with similar scenes but large differences in motion
speed, such as “making phone calls” (walking slowly while making phone calls outside), “walking,” and “running,” the proposed method can distinguish them using the speed value obtained from the GPS sensor. However, the dataset used in this experiment contains no GPS data, leading to poor recognition performance of these activities by the proposed method.
Fig. 12The confusion matrices of the trained SVM classifier applied to the test set ofaM-20 andbMS-6
a
b
The comparison shows that the proposed method is better suited for recognition of ADLs with larger scenes or object differences. This result is validated by the high recognition accuracy of the proposed method when applied to dataset MS-6. Compared to the existing methods, the key factor in the proposed framework is the introduction of the prior knowledge model. Considering that neither M-20 nor MS-6 contains any prior knowledge data, the recognition performance could be expected to improve signifi-cantly once the wearers’ daily routines (time–activity tables) are introduced.
In addition, for the methods proposed in [15,16], it is necessary to extract optical flow between adjacent frames by means of the time-consuming optical flow field estimation algorithm. Even in the multistream deep learning framework proposed by [15], in the video pro-cessing part, three convolutional networks are used to accomplish feature extraction of single-frame images, optical flow, and stabilized optical flow. In contrast, the proposed algorithm only deals with a single-frame image and does not need to extract the optical flow. Only a pre-trained convolutional neural network is needed to extract the semantic features of a single image. There-fore, the computational complexity of the proposed algo-rithm is much lower than that of the methods proposed in [15,16]. Detailed complexity comparison can be seen in Table12.
5 Conclusion
A knowledge-driven multisource fusion framework for egocentric activity of daily living (ADL)
recognition is presented in this paper. The frame-work is based on Dezert–Smarandache theory (DSmT) and consists of information from three sources: a set of knowledge obtained from the wearer, a set of images from a wearable camera, and a set of sensor data from an IMU and a GPS sensor. With regard to user knowledge, we propose a con-venient model building method, which only requires the user to fill in a time–activity table through a user-friendly interface. For the egocentric image se-quence, we propose a novel egocentric ADL recogni-tion algorithm based on image semantic features. An advanced automatic annotation algorithm is used based on a pre-trained CNN to obtain semantic in-formation from each image, and an entropy-based al-gorithm is subsequently applied to further extract semantic features, so as to reduce the image classifi-cation problem to a text classificlassifi-cation problem. In addition, in the DSmT-based multisource fusion part, we propose a hierarchical fusion architecture to eliminate the reliability differences between different information sources. Our experimental results show that the recognition performance for a number of ADLs that have previously been considered difficult can be significantly improved through the fusion of user knowledge with information from images and motion sensors. When applied to a self-built egocen-tric activity dataset, the proposed method achieved an average recognition accuracy of 85.4% across 15 predefined ADL classes, significantly higher than the accuracy that can be reached without incorporating user knowledge.
Table 11Comparison of different methods applied to the same dataset
Proposed method Method in [15] Method
in [16] (%)
M-20 (Nc = 8) (%) MS-6 (Nc = 4) (%) Maximum pooling (%)
Vision 53.2 75.8 75.0 78.4
Sensors 65.8 72.2 49.5 69.0
Fusion 72.3 85.2 80.5 83.7
Table 12Comparison of the complexity of different methods
Proposed method Method in [15] Method in [16]
Vision One pre-trained CNN (single image) + entropy-based TF-IDF
Three-stream CNN (single frame, optical flow, and stabilized optical flow)
Optical flow-based dense trajectory
Low High Very high
Sensors SVM Four-stream LSTM Temporal enhanced
trajectory-like features
Low Medium Low
Fusion DSmT Average or maximum pooling Multimodal Fisher vector
6 Appendix 1
6.1 Detailed time–activity tables for wearer 1
Table 13Time–activity table for workdays (Monday to Thursday) for eButton wearer 1
Time period CN CU ET EM LD MT RD SP TK TU TP WO WU TV WT
0:01–6:50 0 0 0 0 10 0 0 0 0 0 0 0 0 0 0
6:51–7:20 2 2 10 0 0 0 3 0 6 8 0 0 8 0 1
7:21–7:30 0 0 0 0 0 0 0 0 6 8 0 10 0 0 0
7:31–8:00 0 0 0 0 0 0 0 0 10 8 0 9 0 0 0
8:01–8:50 1 10 0 0 0 0 0 0 5 8 3 3 5 0 0
8:51–9:20 0 5 0 0 0 0 2 0 0 9 2 10 0 0 2
9:21–10:00 0 10 1 0 0 0 5 0 6 8 0 5 3 0 5
10:01–11:20 0 10 1 0 0 0 5 0 5 8 0 0 3 0 5
11:21–12:00 0 5 4 0 0 0 2 2 3 8 0 10 0 0 2
12:01–12:30 0 2 10 0 0 0 2 0 5 8 0 4 2 8 1
12:31–13:00 0 2 2 0 8 0 0 0 5 3 0 1 0 5 0
13:01–13:30 0 0 2 0 10 0 0 0 2 6 0 0 0 4 0
13:31–13:50 0 4 0 0 0 0 4 0 0 9 0 10 0 0 2
13:51–17:00 0 10 4 0 0 0 8 0 6 8 0 5 2 0 8
17:01–17:30 0 3 2 2 0 0 1 0 8 9 0 10 2 2 1
17:31–18:00 8 1 10 5 0 0 1 0 5 8 0 3 1 1 0
18:01–20:00 4 2 4 6 0 0 10 0 8 9 0 1 0 8 5
20:01–21:00 2 4 5 10 0 0 6 0 5 6 0 0 3 8 0
21:01–22:00 2 10 1 0 0 0 3 0 5 6 0 0 3 9 2
22:01–00:00 1 10 2 0 5 0 0 0 0 5 0 0 8 9 0
Table 14Time–activity table for Friday (on this day a regular meeting present) for eButton wearer 1
Time period CN CU ET EM LD MT RD SP TK TU TP WO WU TV WT
0:01–6:50 0 0 0 0 10 0 0 0 0 0 0 0 0 0 0
6:51–7:20 2 2 10 0 0 0 3 0 6 8 0 0 8 0 1
7:21–7:30 0 0 0 0 0 0 0 0 6 8 0 10 0 0 0
7:31–8:00 0 0 0 0 0 0 0 0 10 8 0 9 0 0 0
8:01–8:50 1 10 0 0 0 0 0 0 5 8 3 3 5 0 0
8:51–9:20 0 5 0 0 0 0 2 0 0 9 2 10 0 0 2
9:21–10:00 0 10 1 0 0 0 5 0 6 8 0 5 3 0 5
10:01–11:00 0 10 0 0 0 0 5 0 5 8 0 0 3 0 5
11:01–11:20 0 5 4 0 0 0 2 2 3 8 0 10 0 0 5
11:21–11:45 0 2 10 0 0 0 2 0 5 8 0 0 2 8 1
11:46–12:00 0 0 2 0 0 0 0 0 0 9 0 10 0 0 0
12:01–15:00 0 2 1 0 0 10 2 0 5 8 0 2 0 0 1
15:01–17:00 0 10 4 0 0 0 8 3 6 8 5 0 2 0 8
17:01–17:30 0 3 2 2 0 0 1 2 8 9 2 10 2 2 1
17:31–18:00 8 1 10 5 0 0 1 2 5 8 2 2 1 1 0
7 Appendix 2
7.1 Detailed time–activity tables for wearer 2
Table 14Time–activity table for Friday (on this day a regular meeting present) for eButton wearer 1(Continued)
Time period CN CU ET EM LD MT RD SP TK TU TP WO WU TV WT
20:01–21:00 2 0 0 2 0 0 0 3 5 8 2 0 1 8 0
21:01–22:00 1 0 1 1 0 0 0 3 5 6 0 0 3 9 0
22:01–00:00 3 5 2 0 2 0 0 0 0 5 0 0 8 10 0
Table 15Time–activity table for Saturday for eButton wearer 1
Time period CN CU ET EM LD MT RD SP TK TU TP WO WU TV WT
0:01–1:00 0 0 0 0 5 0 0 0 0 6 0 0 10 0 0
1:01–8:00 0 0 0 0 10 0 0 0 0 0 0 0 0 0 0
8:01–9:00 0 2 10 0 0 0 1 0 0 8 0 0 8 0 0
9:01–10:00 6 0 3 1 0 0 0 2 2 8 5 0 0 2 0
10:01–12:00 0 3 0 2 0 0 0 10 5 8 8 2 2 5 0
12:01–13:00 0 2 6 2 0 0 0 10 5 8 8 2 2 5 0
13:01–14:00 0 2 8 0 0 0 0 5 5 8 2 2 2 2 0
14:01–18:00 0 0 0 3 0 0 0 8 5 8 2 2 2 2 0
18:01–19:00 0 0 10 3 0 0 0 5 5 8 2 2 2 4 0
19:01–20:00 0 0 5 2 0 0 0 3 5 8 2 2 2 5 0
20:01–21:00 0 1 0 2 0 0 0 3 5 6 2 0 1 8 0
21:01–22:00 1 2 1 1 0 0 0 3 5 6 0 0 3 9 0
22:01–00:00 0 10 2 0 2 0 0 0 0 5 0 0 8 10 0
Table 16Time–activity table for workdays (Monday, Wednesday, to Friday) for eButton wearer 2
Time period CN CU ET EM LD MT RD SP TK TU TP WO WU TV WT
2:01–7:00 0 0 0 0 10 0 0 0 0 0 0 0 0 – 0
7:01–8:00 0 2 0 4 6 0 0 0 0 0 0 3 0 – 0
8:01–9:00 3 5 5 2 5 0 0 0 0 2 0 10 8 – 0
9:01–10:00 0 8 0 1 2 0 3 0 2 2 0 5 0 – 3
10:01–11:00 0 9 0 0 0 0 5 0 4 1 0 1 0 – 3
11:01–12:00 0 9 0 0 0 0 5 0 6 1 0 1 0 – 4
12:01–13:00 0 9 5 5 3 0 3 0 4 2 0 6 0 – 5
13:01–14:00 0 9 7 5 5 0 3 0 2 1 0 6 0 – 5
14:01–15:00 0 9 2 0 5 0 5 0 3 1 0 2 0 – 5
15:01–16:00 0 9 0 0 0 0 5 0 1 1 0 1 0 – 5
16:01–17:00 0 9 0 0 0 0 5 0 1 1 0 1 0 – 5
17:01–18:00 0 9 0 0 0 0 3 0 1 1 0 1 0 – 5
18:01–19:00 0 7 7 0 0 0 3 0 1 1 0 6 0 – 5
19:01–20:00 0 7 4 0 4 0 3 0 1 1 5 6 0 – 3
20:01–21:00 0 9 4 0 1 0 5 0 1 1 0 1 0 – 3
21:01–22:00 0 9 2 0 0 0 5 0 3 3 2 1 0 – 3
Table 16Time–activity table for workdays (Monday, Wednesday, to Friday) for eButton wearer 2(Continued)
Time period CN CU ET EM LD MT RD SP TK TU TP WO WU TV WT
23:01–0:00 0 7 0 7 0 0 0 0 1 1 4 7 0 – 0
0:01–1:00 0 3 0 6 7 0 0 0 1 0 4 4 8 – 0
1:01–2:00 0 1 0 2 8 0 0 0 0 0 1 0 0 – 0
Table 17Time–activity table for Tuesday (on this day a regular meeting present) for eButton wearer 2
Time period CN CU ET EM LD MT RD SP TK TU TP WO WU TV WT
2:01–7:00 0 0 0 0 10 0 0 0 0 0 0 0 0 – 0
7:01–8:00 0 2 0 4 6 0 0 0 0 0 0 3 0 – 0
8:01–9:00 3 5 5 2 5 0 0 0 0 2 0 10 8 – 0
9:01–10:00 0 8 0 1 2 3 3 0 2 2 0 5 0 – 3
10:01–11:00 0 9 0 0 0 7 5 0 4 1 0 1 0 – 3
11:01–12:00 0 9 0 0 0 6 5 0 6 1 0 1 0 – 4
12:01–13:00 0 9 5 5 3 0 3 0 4 2 0 6 0 – 5
13:01–14:00 0 9 7 5 5 0 3 0 2 1 0 6 0 – 5
14:01–15:00 0 9 2 0 5 0 5 0 3 1 0 2 0 – 5
15:01–16:00 0 9 0 0 0 0 5 0 1 1 0 1 0 – 5
16:01–17:00 0 9 0 0 0 0 5 0 1 1 0 1 0 – 5
17:01–18:00 0 9 0 0 0 0 3 3 1 1 0 1 0 – 5
18:01–19:00 0 7 7 0 0 0 3 3 1 1 0 6 0 – 5
19:01–20:00 0 7 4 0 4 0 3 5 1 1 5 6 0 – 3
20:01–21:00 0 9 4 0 1 0 5 5 1 1 0 1 0 – 3
21:01–22:00 0 9 2 0 0 0 5 0 3 3 2 1 0 – 3
22:01–23:00 0 9 1 6 0 0 3 0 3 3 6 7 0 – 3
23:01–0:00 0 7 0 7 0 0 0 0 1 1 4 7 0 – 0
0:01–1:00 0 3 0 6 7 0 0 0 1 0 4 4 8 – 0
1:01–2:00 0 1 0 2 8 0 0 0 0 0 1 0 0 – 0
Table 18Time–activity table for Saturday for eButton wearer 2
Time period CN CU ET EM LD MT RD SP TK TU TP WO WU TV WT
2:01–8:00 0 0 0 0 10 0 0 0 0 0 0 0 0 – 0
8:01–9:00 0 2 0 4 6 0 0 0 0 0 0 3 0 – 0
9:01–10:00 5 5 5 2 5 0 0 0 0 2 0 10 8 – 0
10:01–11:00 0 8 0 1 2 0 3 0 2 2 0 5 0 – 3
11:01–12:00 0 9 0 0 0 0 5 0 4 1 0 1 0 – 3
12:01–13:00 0 9 5 5 3 0 3 0 4 2 0 6 0 – 5
13:01–14:00 0 9 7 5 5 0 3 0 2 1 0 6 0 – 5
14:01–15:00 0 9 2 0 5 0 5 0 3 1 0 2 0 – 5
15:01–16:00 0 9 0 0 0 0 5 0 1 1 0 1 0 – 5
16:01–17:00 0 9 0 0 0 0 5 0 1 1 0 1 0 – 5
17:01–18:00 0 9 0 0 0 0 3 0 1 1 0 1 0 – 5
18:01–19:00 0 7 7 0 0 0 3 5 1 1 0 6 0 – 5
19:01–20:00 0 7 4 0 0 0 3 3 1 1 5 6 0 – 3
Abbreviations
2-L HFNDCS:Two-level hierarchical fusion network with descending candidate sets; ADL: Activities of daily living; BBA: Basic belief assignment; BoTs: Bags of tags; CNN: Convolutional neural network; CoO: Combination of objects; DSmT: Dezert–Smarandache theory; DST: Dempster–Shafer evidence theory; GPS: Global positioning system; IMU: Inertial measurement unit; LSTM: Long- and short-term memory; PCR: Proportional Conflict
Redistribution; SVM: Support vector machine; TF-IDF: Term frequency-inverse document frequency
Acknowledgements
The authors would like to acknowledge all the participants for their significant contributions to this research study, as well as Clarifai for providing online service.
Funding
This work was supported in part by the National Institutes of Health (NIH) Grants (No. U01HL91736, R01CA165255) of the United States; the National Natural Science Foundation of China (Grant No. 61601156, 61602430, 61102132); the State’s Key Project of Research and Development Plan of China (Grant No. 2016YFE0108100); Zhejiang Provincial Natural Science Foundation of China (Grant No. Q16F010019).
Availability of data and materials
The multimodal egocentric activity data used in the performance comparison is presented in [25,26]. It is available athttp://people.sutd.edu.sg/~1000892/ dataset. The eButton activity datasets used in this work are available from the corresponding author on reasonable request.
Authors’contributions
MS, WJ, and HY conceived the idea of the study. HY designed the framework of the study. HY collected the data. ZL and FG carried out part of the algorithms. WJ analyzed the data and the results. HY wrote the manuscript. MS, DY, and HZ revised the manuscript. All authors read and approved the final manuscript.
Competing interests
The authors declare that they have no competing interests.
Publisher’s Note
Springer Nature remains neutral with regard to jurisdictional claims in published maps and institutional affiliations.
Author details
1College of Electronics and Information, Hangzhou Dianzi University, Hangzhou 310018, China.2Department of Electrical and Computer Engineering, University of Pittsburgh, Pittsburgh, USA.3Department of Computer Science, Ocean University of China, Qingdao, China.4Institute of Power Consumption and Energy Efficiency, China Electric Power Research Institute, Beijing 100192, China.5Image Processing Center, School of Astronautics, Beihang University, Beijing, China.6Department of Neurological Surgery, University of Pittsburgh, Pittsburgh, USA.
Received: 13 August 2018 Accepted: 4 February 2019
References
1. L. Zhang, Y. Gao, W. Tong, G. Ding, A. Hauptmann, inProceedings of the 19th International Conference on Multimedia Modeling (MMM 2013). Multi-camera
egocentric activity detection for personal assistant (Huangshan, China, 2013), Springer, pp. 499–501
2. S.F. KaiZhan, FabioRamos, Multi-scale conditional random fields for first-person activity recognition on elders and disabled patients. Pervasive Mob. Comput.16, 251–267 (2015)
3. A. Behera, D.C. Hogg, A.G. Cohn, inProceedings of the 11th Asian Conference on Computer Vision (ACCV 2012). Egocentric activity monitoring and recovery (Daejeon, 2012), Springer, pp. 519–532
4. D. Surie, T. Pederson, F. Lagriffoul, L.-E. Janlert, D. Sjölie, inProceedings of the 4th international conference on Ubiquitous Intelligence and Computing. Activity recognition using an egocentric perspective of everyday objects (Hong Kong, 2007), Springer, pp. 246–257
5. K.M. Kitani, T. Okabe, Y. Sato, A. Sugimoto, inProceedings of 2011 IEEE Conference on Computer Vision and Pattern Recognition (CVPR 2011). Fast unsupervised ego-action learning for first-person sports videos (Colorado Springs, CO, USA, 2011), IEEE, pp. 3241–3248
6. Y. Hoshen, S. Peleg, inProceedings of 2016 IEEE Conference on Computer Vision and Pattern Recognition (CVPR 2016). An egocentric look at video photographer identity (Las Vegas, 2016), IEEE, pp. 4284–4292
7. A. Betancourt, P. Morerio, C.S. Regazzoni, M. Rauterberg, The evolution of first person vision methods: a survey. IEEE Trans. Circuits Syst. Video Technol.
25, 744–760 (2015)
8. W. Jiang, Z. Yin, inProceedings of the 23rd ACM international conference on Multimedia. Human activity recognition using wearable sensors by deep convolutional neural networks (Brisbane, 2015), ACM, pp. 1307–1310
9. O.D. Lara, M.A. Labrador, A survey on human activity recognition using wearable sensors. IEEE Commun. Surv. Tutorials15, 1192–1209 (2013) 10. T.H. Nguyen, J.C. Nebel, F. Florez-Revuelta, Recognition of activities of daily
living with egocentric vision: a review. Sens. (Basel)16, 72: 1-24 (2016) 11. M. Bolaños, M. Dimiccoli, P. Radeva, Toward storytelling from visual
lifelogging: an overview. IEEE. Trans. Hum. Mach. Syst.47, 77–90 (2017) 12. M. Bolaños, M. Garolera, P. Radeva, inProceedings of the 2015 Iberian
Conference on Pattern Recognition and Image Analysis (IbPRIA). Object discovery using CNN features in egocentric videos (Santiago de Compostela), Springer, pp. 67–74
13. M. Ma, H. Fan, and K. M. Kitani, inProceedings of the2016IEEE Conference on Computer Vision and Pattern Recognition (CVPR).Going deeper into first-person activity recognition (Las Vegas, 2016), IEEE, pp. 1894–1903 14. Y. Li, Z. Ye, J.M. Rehg, inProceedings of the 2015 IEEE Conference on
Computer Vision and Pattern Recognition (CVPR). Delving into egocentric actions (Boston, 2015), IEEE, pp. 287–295
15. S. Song, V. Chandrasekhar, B. Mandal, L. Li, J.-H. Lim, G.S. Babu, et al., in
Proceedings of the 2016 IEEE Conference on Computer Vision and Pattern Recognition Workshops (CVPRW). Multimodal multi-stream deep learning for egocentric activity recognition (Las Vegas, 2016), IEEE, pp. 378–385 16. S. Song, N.-M. Cheung, V. Chandrasekhar, B. Mandal, J. Lin, inProceedings of
the 2016 IEEE International Conference on Acoustics, Speech and Signal Processing (ICASSP). Egocentric activity recognition with multimodal fisher vector (Shanghai, 2016), IEEE, pp. 2717–2721
17. G. Shafer, Perspectives on the theory and practice of belief functions. Int. J. Approx. Reason.4, 323–362 (1990)
18. F. Smarandache, J. Dezert,Advances and Applications of DSmT for Information Fusion(American Research Press, Rehoboth, 2004)
19. L. Chen, J. Hoey, C.D. Nugent, D.J. Cook, Z. Yu, Sensor-based activity recognition. IEEE Trans. Syst. Man Cybern. Part C Appl. Rev.42, 790– 808 (2012)
20. B. Bouchard, S. Giroux, A. Bouzouane, A smart home agent for plan recognition of cognitively-impaired patients. J. Comput.1, 53–62 (2006)
Table 18Time–activity table for Saturday for eButton wearer 2(Continued)


![Table 8 Activity categories of the egocentric activity datasetpresented in [15]](https://thumb-us.123doks.com/thumbv2/123dok_us/880106.1105757/15.595.56.539.650.723/table-activity-categories-egocentric-activity-datasetpresented.webp)

