Journal of
RAN’GE MANAGEMENT
Volume November, 25 Number 1972 6Social Welfare and Integrated Resource Management ____._________..____ Dillard H. Gates The Environment-Where Do We Stand? From the
Vantage Point of Space ____________________________-_____________________________._____ R. Relationships of Wildlife to
Ranches on the Laikipia
Livestock on Some Developed Plateau, Kenya __..____ _______ _____ ________
Keith Arnold 413 411
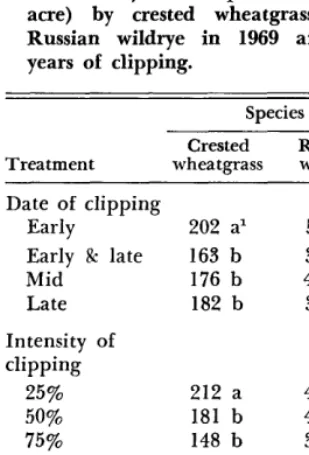
Richard N. Denney Clipping Effects on Seeded Foothill Ranges
in Utah ____ ___ _____ ________________ D. Lynn Drawe, J. B. Grumbles, and Jack F. Hooper Carbohydrate Reserves of Crested Wheatgrass and Russian Wildrye
as Influenced by Development and Defoliation
M. J. Trlica, Jr. and C. Wayne Cook 415
426
Herbage Slash
Response to Precommercial Thinning Pine ____ ________ _______.____________ H. E. Grelen, L. in
Direct-Seeded
B. Whitaker, and R. E. Lohrey Soil Properties and Nutrient Availability in Tarweed Communities
of Central Washington ______ ____._ __________ _.________ ________ _.__ __________._ Arthur R. Tiedemann Controlling Red Threeawn on Abandoned Cropland with
Ammonium Nitrate ______________________________________________ D. N. Hyder and R. E. Bement 430
435
438
443 Forage Yield in Two
and Nova Scotia
Forest Zones of New Brunswick
_______________________________________.________________________----________----______ An Alternate-Furrow System for Seeding Northern
Colorado Rangeland ____ ______._ ________ ____ _____________ _.___ ____________________ Response of a Seeded Mixture
to Fertilization ____________________
of Warm-season Prairie Grasses -_____ G. W. Rehm, W. J. Moline,
E. S. Telfer 446
William J. McGinnies 450
452 and E. J. Schwartz Nitrogen and Phosphorus Availability in a Fertilized Rangeland
Ecosystem of the Northern Great Plains ____________ A. L. Black and J. Ross Wight
Paraquat Kills Geyer Larkspur _________________________________________________________-__________ D. N. Hyder 456 460 Sand Shinnery Oak Response to Silvex Sprays of
Varying Characteristics ______.__________._____________________________________________________.____ Voles Can Improve Sagebrush Rangelands
Neil C. Frischknecht and Maurice F. Baker C. J. Scifres 464
466 468 471 Estimation of Herbage Intake from Jackrabbit Feces ________________________ R. M. Hansen Evaluating Animal Forage Preference _____________-____________________________ William C. Krueger Computer Processing of Chart Quadrat Maps and Their Use
in Plant Demographic Studies __________________._________________________ R. Gerald Wright, Jr. Technical Notes
476
W,interfat Seeds Undergo After-Ripening ___________.____________________ H. W. Springfield An Experiment in Deer Detection by Thermal Scanning
H. Dennison Parker, Jr. and Richard S. Driscoll 479
480 482 484 487 489 Measurement of Seed Responses to Environment ________________________ A. M. Wilson
Book Reviews ___________________________________________________________________________________________________________________________ 26th Annual Meeting, Boise, Idaho ________________________.___________________________________________________________
Index, Volume 25, 1972 ___________---__________---__________________ ____________._______________._______________________
cover
Photo-Wild
Turkey in Upland Habitat,
Uvalde County, Texas.
Social Welfare and Integrated
Resource Management’
DILLARD H. GATES
llirector, Rangeland Resources Program, Oregon State University, Cowallis.
Highlight
Resource management decisions can- not be properly made based upon single use but must give full consider- ation to alternative uses or combina- tions of uses. The impact of uses
resources must be evaluated. ?l? soundness of management deci- sions must be evaluated on the basis of their impact upon human welfare. A philosophy of integrated resource management will reflect concern for both resources and people.
The dependence of man upon resources is legend.
The demands placed upon wild- land resources by a growing, mobile, affluent and leisure-time oriented population is a legend in our time. Despite accelerating demands upon
wildland resources, we do not
understand the complex interac-
tions between resources and man. We have limited knowledge and a
partial understanding of the im-
pact of various land management decisions upon resources. In many cases, decisions may have been made and forgotten without moni- toring or evaluating either their direct or side effects. Only in com- paratively recent times have we be- come particularly concerned about the full impact of man’s actions upon resources. Concern for the
lack of understanding of the im-
pact of resources and resource use upon man is of even a more recent vintage. In fact, it is just emerging. An increasing, but still limited, part of the population now realizes that wildland resources are limited. This realization alone has placed
additional stress on an already
stressed human environment. We
now worry not only about how to
acquire additional resources for
human use but also about how our use of resources adds to their scar-
l Received for publication April 24, 1972.
city or contributes to their deple- tion. We (at least some of us) now realize that man must “make do” with what he now has and that what he now has is both limited (Planet Earth) and limiting insofar as human welfare is concerned.
Although resources are limited the seemingly limitless population growth makes increasing demands on resources. Therefore, it is im- perative that land use decisions or schemes of management optimize
production of goods and values
from wildland resources over the long run. We can no longer afford expedient short-run economic opti- mization.
Goods and values derived from wildland resources are assumed to be necessary or desirable from the standpoint of the social welfare of man. A nation-wide policy of in- tegrated resource management, em- bracing both public and private lands, is needed to achieve the goal of optimizing production of goods and values from wildland resources over the long run.
D. A. Smith2 defined integrated resource management as, “The ap- plication of management strategies to achieve the maximum output from the optimized use of natural resources of a specific area for the benefit of a referent-group and its
successors.” This definition pro-
vides a framework within which to achieve the public goal for resource management.
Our representative form of gov- ernment contains the mechanisms to translate public attitudes into goals as well as action to accom- plish these goals. Individuals and groups set society’s goals by artic- ulating their desires and through
the ballot box. Society’s goals
2 Master of Forestry thesis, University
of British Columbia, 1969. 411
should provide the conceptual
framework for planning, establish- ment of objectives and their im- plementation.
Some goals for resource use have been identified through legislation such as the Multiple Use, Environ-
mental Protection and Environ-
mental Quality Acts. Many indi- viduals and/or groups may not fully support either the legislation or the goals. We assume these goals do reflect the attitude of the broad public today on matters of resource management and environ- mental quality.
Expressed goals, no matter how noble, are merely rhetoric until supported by objectives designed to accomplish the goals and imple-
ment objectives. For example: a
goal set by society may be to en- hance and protect the environ- mental quality of rangelands. To reach this goal, certain specific
things must be done-that is, ob-
jectives must be set. An objective may be to restore vegetation to its
natural state on specific areas.
However, this objective is still
meaningless unless implemented.
This means planning, funds, and
manpower. Thus, the planning
process for integrated resource man- agement must embrace setting of
goals, establishment of objectives
and implementation of actions nec- essary to accomplish the objectives. No plan is complete unless it in- cludes methods for implementation.
The resource manager generally gets into the planning loop when objectives are established or the
implementation of action to ac-
complish objectives that have been set by others. The proper point to insert resource management exper- tise into the planning process is a moot question. I feel it should be much sooner. However, significant resource manager inputs generally follow broad policy decisions or setting of goals. This procedure frequently places the resource man-
ager in the difficult position of
being asked-required-expected-
412
GATES
schemes not compatible with eco-
logical characteristics of wildland
resources. In other words, the re- source manager may be committed to action as a result of decisions made by others who had less than the best possible knowledge and understanding of the problem.
We should recognize that re- source managers do not always utilize fully all information avail- able in their resource management decision-making processes. This is especially true when the decision maker is strongly single discipline- oriented or when through igno- rance he fails to involve other legitimate disciplines into the deci- sion-making process.
In most cases today, resource decisions cannot be based upon single disciplines or single use but
must give full consideration to
alternatives or combinations of use. In so doing, the impact of various uses or combination of uses upon both resources and resource users must be understood and evaluated.
Results of these evaluations be-
come a part of the decision-making processes.
Tragically, all the information
now available sometimes has little impact upon the human character- istics of seeing only one side of a problem or presenting only one
viewpoint. In fact, the great
amount of information (not always facts) available to decision makers may actually ease the management decisions without fully exploring all facets of a problem.
Objectivity is still a rare com-
modity. However, it can be in-
creased and strengthened by in-
sisting that resource information is factual and by taking an interdis- ciplinary approach to integrated
resource management. An inter-
disciplinary approach to problem solving will add not only credi- bility but acceptance to resource management decisions.
Accelerating demands on range- lands require an interdisciplinary
approach to resource problems.
Paradoxical, these very demands
from an expanding and concerned
society may force the interdiscipli-
nary approach to integrated re-
source management. In the long
run, rangeland resources may be “saved” by forces or activities which at first appeared to be, and in many cases probably were, de- structive. What at first appeared to be our dilemma would be our
salvation. Silent Spring and many
so-called Doom’s Day ecologists have caused us to look more closely at what we were doing with our resources and ourselves.
Integrated resource management
has significant social implication
when related to management and use of resources by and for man. Contrary to the viewpoint of the traditional conservationist olr pres- ervationist, resources are not man- aged for the sake of resources but for people. Thus, integrated re- source management includes an in- creasingly important social dimen- sion that may be difficult for some
resource managers to recognize,
appreciate, or deal with effectively. In general, resource managers
have been trained to manage
resources. Management decisions
were, or are, made primarily upon the basis of their impact upon re-
sources. Traditionally the quali-
fied resource manager had at least a working understanding of the re- sponse of rangeland resources to
given specific treatments. He was
little concerned about the social
implications of resource manage-
ment decisions. For too long, too many resource managers have op- erated under the false premise that both their authority and responsi- bility stopped at a given boundary.
These procedures are no longer
acceptable. The resource manager
today must make his decision with full consideration of its social im- plications. He must understand re- sources. He must understand the impact of people upon resources.
Just as importantly, he must be
sensitive to the impact of resources
on people. The rang-eland re-
source manager must recognize
the social implications implicit in many biological phenomena. Most
of us consider ourselves biologists. We must recognize that neither biology nor sociology is a separate
and distinct science. Resource
management decisions must be
made only following a full evalua- tion of their impact on human
welfare. (In fact, this is a good
basis for evaluating most decisions.)
A multidisciplinary approach to
resource decisions is required to as-
sure adequate understanding and
treatment of capabilities and limi- tations of resources, needs and de- sires of people, and the social environment in which the decision is made. The multidisciplinary ap- proach involves more than a range man, a forester, and a wildlife man having a cup of coffee together. It involves all concerned disciplines really working together. Thus, if we are actually managing resources for man, can the social scientist be omitted? This may appear to be a cumbersome approach, but in the final analysis, it will provide a mechanism for expertise in all concerned disciplines to be appro- priately applied to problems of resource management.
Summary
(1) We must understand the re- source and people we are trying to manage.
(2) Resources are managed for
people. Therefore, resource deci-
sions must reflect a concern for human welfare.
(3) A mu1 tidisciplinary approach is required to provide understand- ing, credibility, and acceptance of management decisions.
(4) The concept of integrated re- source management embraces the resources, the people, and their interactions.
Longmont Seed Co.
We Buy & Sell Western Range Gruss8 Legume Seeds
CONFRONT US with your RANGE PROBLEMS: phone: 303 + 776-1320
The Environment-Where
Do We Stand?
From the Vantage Point of Space1
R. KEITH ARNOLD
Deputy Chief for Research, Forest Service, U. S. Department of Agriculture, Washington, D. C.
Highlight
Remote sensing from satellite sys- tems offers real potentials for data collection on rangeland problems, structure, and use. When techniques, now being tested at a number of loca- tions, have been more fully developed, more information from remotely based sensors will be available for reducing the uncertainties surrounding daily policy and management decisions. Techniques under development are discussed.
A significant part of man’s cur- rent concern about his environ- ment can be traced to his reaction to the first, incredible, astronaut’s- eye-view of this planet. The vision of “spaceship earth” drifting in lonely isolation has shocked mil- lions of thoughtful citizens into a
chilling awareness of the com-
pletely closed character of the life support system we live in. Casual
acceptance of, or indifference to,
the fact of our total dependence on a finite resource supply, and on a supporting environment of demon- strated yet unmeasured fragility, is now fairly generally recognized as a foolish and shortsighted posture. The “need to know” what is hap-
pening to our global environ-
ment-not just from one century
to the next but almost from day-to- day-has become painfully evident.
Technical feasibility has been
established, and launching of the first earth resources technical satel- lite (ERTS-A) is planned for later this year. Other more sophisticated projects, including Skylab and the space shuttle, will follow. What then are the potentials for these new intelligence systems?
First, let us discard the idea that one photograph or image will pro-
l Presented at the annual meeting of the Society for Range Management, Washington, D.C., February 8, 1972.
vide each of us the data we need for day to day management of the
environment, for the seasonal or
annual planning requirements, or for the major policy decisions faced at every level of government and
corporate activity. Replacing the
single highly skilled photo inter- preter are teams of scientists study- ing sensor-signature codes, engineer- ing teams perfecting an unlimited
array of electromagnetic sensors,
groups of data and image process-
ing specialists looking for new
ways to surface, automatically and routinely, the useful information which lies hidden in many forms and formats of imagery and elec- tronic signals.
If we are past the show and tell stage, where are we? Modern re- mote sensing technology is unfold- ing opportunities which are stag-
gering. Here are some of the
opportunities:
The synoptic or big view.-From imagery taken 150 miles out in space we can view without distor- tion the entire State of Wyoming on 10 photographs.
Multistage sampling.-We now
have the capability of extending useful sampling from the observa- tion of a single blade of grass through larger samples to the limit of one face of the earth.
Repetitive imagery.-We can now repeat imagery at intervals which have air, soil, water or phenological significance.
Multiband imagery.-For most of man’s existence on earth, we have had to limit our remote sensing to the 4/10’s of a mi- crometer of the electromagnetic spectrum that the optic nerve re- sponds to. Now we span most of
the electromagnetic spectrum.
Image and signal enhancement.-
We have just scratched the surface
413
with a few developments in optical and electronic image and signal
enhancement which allows maxi-
mum information retrieval for spe- cific purposes and selective com-
binations of information from
many sources.
Data handling and communica- tions .-This technology is ahead of, or equal to, requirements that we in natural resources may place upon it. But as you develop a strategy for employing all of the above in concert, data handling may become limiting.
There is little new in the tech- nology devices listed above. We can and have used them before the space age. Continuous use for many purposes over wide areas for practical application at reasonable cost is not possible without the space dimensions.
The most commonly invoked ap- plication of space information sys- tems to rangeland problems is for the development of a complete in- ventory of our western wildlands. It is vitally important that we have an accurate, up-to-date knowledge of the structure, use, and condition of this immense area, but the job is of such magnitude, complexity, and cost that it has never been done.
But important as adequate range- land inventories are, we must not fail to recognize the potential util- ity of a permanent or continuing space information system for docu- menting change. The capability to delineate on space photos major categories of land use has already
been demonstrated. It presents an
unparalleled opportunity for ob-
serving and evaluating, on a re-
gional or even sub-continental
scale, shifts in row-crop agricul- ture, irrigation, range grazing, new- town development, surface mining,
and other similar activities. We
can also expect to be able to detect the extent and severity of certain types of natural or man-caused en-
vironmental change, and to ap-
praise its probable significance.
414
ronmental degradation, but when we have learned what to look for, it will provide an environmental “early warning system.” It will help establish a base level from
which to judge, measure, and
evaluate change. It will help ex- plain locally observable phenomena which, out of context of the total mosaic, are meaningless.
The limiting factor, or pacing
element, in useful application to
range and other natural resources problems, is research. Thanks to
the momentum of the Nation’s
total space effort, and to the tech- nological achievements of the aero-
space and electronics industries,
the hardware engineering aspects
of producing data from remotely based sensors are well advanced. What is lagging far behind is knowledge of relationships among
earth resources phenomena and
sensor response. These phenom-
ena change over space and over time at varying rates for different phenomena.
Let us return to data handling, briefly. This will be serious enough with the relatively limited output
of the experimental ERTS-A. But
when a continuing satellite system becomes operational, the sheer vol- ume of data will utterly swamp all available staff and facilities if we do not know by then how to sort, reduce, and process data automati- cally to extract specific needed in-
formation. Ways of doing this
have been under study by a num- ber of skilled and imaginative
people. The Purdue University
remote sensing lab has made excel- lent progress in automatic discrimi- nation of agricultural crops. The
random and heterogeneous pat-
terns of range soils and vegetation represents a more difficult chal- lenge. Techniques of scanning aer-
ARNOLD
ial or space photos using an auto- ma tic recording microdensi tome ter, being studied by Forest Service re- searchers at Berkeley and Ft. Col- lins, show considerable promise.
The success of data interpreta-
tion depends on identification of
energy patterns in different bands of the spectrum that are uniquely characteristic of whatever it is that
is to be discriminated. To produce
discrimination keys for consistent
and reliable recognition of range ecosystems, for example, the dis- tinctive spectral features or “signa- tures” of each must be established. It is also necessary to know at what season of the year the character- istics differences can best be de- tected, on which kind of film, and using what filters. The influence of climate, site quality, current grazing regime, and other variables must also be isolated. Our staff at Berkeley has been building a micro- density image data bank for forest and rang-eland classes using Apollo 9 infrared color photos, and multi- band simulated space imagery rep-
resenting several seasonal condi-
tions.
Other important related research deals with such problems as optical properties of vegetation, recogni- tion and possible diagnosis of stress symptoms in plants, and design of multistage sampling techniques for
quantifying timber volumes and
forage production. The National
Aeronautics and Space Administra- tion is taking the lead in helping to plan, coordinate, and fund re- search. The Departments of Inte- rior and Agriculture and a number of universities are actively partici- pating.
In considering the practical out-
look for satellite information sys-
tems, it is difficult to avoid ex- tremes of either optimism or skep-
ticism. But if we accept the poten- tial of the foregoing applications, two critical questions still remain: Who will use the information, and how will they integrate it into cur- rent decision making and program planning? There is not time, nor for that matter the experience- based judgment, to examine these questions in the depth that they deserve. Raw data from ERTS-A will be recorded on magnetic tape at central receiving stations, proc- essed, and distributed to trained interpreters in Federal and State
establishments, universities, and
other organizations. They will
have the responsibility of working closely with the people who will
put this information to practical
use. Gradually, as raw data are
converted into maps, statistical
summaries, and electronic print-
outs showing patterns of selected phenomena, a wide variety of user groups will become directly in-
volved in adaptation to specific
resource problems. These will in-
clude livestock producers, land
managers, water user associations,
advisory and regulatory boards,
State and regional land-use plan- ners, Federal agencies, and leg-
islative committees. Decisions in-
volving allocation of funds, choice of management strategies, and the
scheduling of action programs
should be made with greater as- surance of success.
In the final analysis, informa- tion derived from remotely based sensors offers one more opportu- nity for reducing the uncertainties surrounding decisions that must be made every day. Those of us who are decision makers and policy planners will have more accurate indicators of change and a more rapid feed-back on environmental conditions.
Spec;u/isfs
in
QuulifyN AT I
V
E G
R
A S
S E S
Wheatgrasses l Bluestems l Gramas l Switchgrasses l Lovegrasses l Buffalo l and Many Others
We grow, harvest, process these seeds Native Grasses Harvested in ten States Your Inquiries
SHARP BROS. SEED CO.
Phone 39%223 1Relationships of Wildlife to Livestock
on Some Developed Ranches on the
Laikipia Plateau, Kenya
RICHARD N. DENNEYl
Forestry Officer, Wildlife, Kenya Range Management Project, Food and Agriculture Organization of the United Nations, Nairobi, Kenya.
Highlight
The status and relationships of wildlife with domestic livestock on 42 ranches in the relatively developed ranching area of the Laikipia Plateau in Kenya, East Africa, were surveyed during 1967 and 1968. The average ranch was 35,400 acres, with approximately 3,000 cattle. Conservative estimates indicate a wildlife population of at least 100,000 animals of Thomson’s gazelle size or larger, with some data being obtained on a total of 64 species. Most of the ranchers were tolerant of wildlife, in reasonable numbers, and except for cer- tain species. The three most important wildlife-related problems were disease transmission, forage competition, and damage. Ranch practices which influ- enced wildlife were fencing (particularly game-proof fences), bush control, and shooting. The average rancher is interested in the possibility of a biologically sound, controlled game utilization scheme under which game meat could be sold. The potentials of expanded sport hunting and game cropping can make wildlife a profitable asset to the ranchers. Unless some means of assuring the landowner of a substantial return on the wildlife on his ranch is provided, the generally tolerant attitude prevailing
status of the wildlife.
The Laikipia Plateau has been the home of wildlife and Masai livestock since long before the ar- rival of the first European. It has become one of the most important livestock areas in Kenya today. It may also be one of the last areas in which considerable numbers and varieties of wildlife will be found in the not too distant future, other than in game reserves and national parks, depending on the attitude of the ranchers toward wildlife and the resultant policies adopted in
ranch management. These ranch-
ers may become more tolerant,
even genuinely concerned about
the welfare of wildlife, if it can be shown that game has an intrinsic value to them. To better under-
stand the relationships between
wildlife and livestock it was neces- sary to assess the factors of live- stock husbandry of these relatively
well-developed highland ranches
which affect and are affected by wildlife. This survey represents a beginning in such an evaluation.
l Present address is Wildlife Consult- ant, The American Humane Associa- tion, P. 0. Box 1266, Denver, Colo- rado, 80201.
now will deteriorate, and= with it the
Due to the increasing settlement in some of the rangelands of Kenya through stabilizing nomadic pasto- ral groups by land adjudication and grazing schemes, many of the principles evolved through almost 50 years of ranching experience
in Laikipia can have immediate
application.
Information and data concern-
ing natural features, the type and extent of improvements, livestock
data, management practices, and
the attitude toward wildlife, as
well as seasonal estimates of game
numbers, wildlife-livestock disease
relationships, competition, damage and wildlife utilization and values were obtained from 42 ranches in Laikipia.
Location and Study Area Description
The Laikipia Plateau is an area in west central Kenya lying west and north of Mount Kenya, from just south of the equator to 0” 45’ north latitude and between 36” 15’ and 37” 10’ east longitude (Fig. 1). It is characterized by relatively low and erratic annual rainfall, which dictates a grazing or ranching econ- omy. The area as a whole is com-
415
prised of 1,869,OOO acres, of which
approximately 92% is unculti-
vated meadows and pasture (Kenya M.E.P. and D., 1965). The greater part lies on the rolling plains drained by the Ewaso Nyiro and Ewaso Narok rivers and their trib- u taries. Altitudes vary from 4,500 feet in the lower Ewaso Nyiro to 7,500 feet in the foothills of the
Aberdare Mountains, with the
bulk of the plateau lying between 5,500 and 6,500 feet.
Climate
Although located practically on the equator, this area is character- ized by moderate temperatures, rel- atively low humidity and a low,
erratic annual precipitation. Daily
temperatures have a maximum of 79 F and minimum of 45 F, with a mean annual temperature of 59 F.
The average annual rainfall
ranges from 18 inches on the lower Ewaso Nyiro to 32 inches on the slopes of the mountains, with an overall average of 25 inches. Ap- proximately 32% of the rainfall is received during the March through May period, 21% during July and August and 20% during October and November. The July-August rains, locally termed the “grass rains,” are more pronounced toward the western side of the Laikipia Plateau.
Water is a limiting factor in the plateau, but the Ewaso Nyiro and the Ewaso Narok, with many
of their tributaries draining the
Mount Kenya and Aberdare Moun-
tains watersheds, provide year-
round water. Other drainages pro- vide seasonal or temporary water, and natural springs occur in some areas, particularly at the northwest end of the plateau. Swamps and lowlands have been channelled to provide water, and reservoirs of various sizes, along with boreholes (wells) provide much of the water for livestock.
Vegetation
The rangeland comprising the
Laikipia Plateau is mostly char-
DEi’JRTEY
tural potential with a natural vege- tation of dry forms of woodland and savanna, primarily an Acacia- Themeda association. It is a po- tentially productive range, limited by the encroachment of bush; and, while sensitive to severe grazing, burning is usually part of its man- agement. Usually less than 10 acres are required per stock unit.
Second is rangeland with an arid climate. Here only local limited areas are suited to agriculture, with shrubby-type woody vegeta- tion dominating. Desirable peren- nial grasses can dominate, although highly susceptible to overgrazing. More than 10 acres are required per stock unit.
The vegetative types are basi- cally grassland, bushed grassland, wooded grassland and woodland, the latter restricted to riverine con- ditions and higher elevations on the slopes of the mountains. Indi- vidual ranches varied considerably in the vegetative types represented, depending on local site features such as altitude, topography, soils and precipitation. Based on the acreages of the vegetative types on the ranches, 39% of the area is bush, 37% open grassland or plains,
14% savanna, 6% forest, riverine or steep slopes, and 4% heavy forest and bush mixed.
Normal Characteristics of the Developed Ranch When the terms “owners” and “private land” are used in this
paper they do not refer to freehold or titled land, but rather to land on leaseholds under which practi- cally all the land in Kenya is held, usually on a 999.year lease. The ranches ranged from 8,000 to
128,000 acres, with an average size of 35,400 acres. Carrying capacities ranged from 6 to 24 acres per ani- mal unit per year, with an average of 10.9 acres. Stocking rates varied from 6 to 20 acres, with a mean of 11.4 acres per head. Compared with the average carrying capac- ity it appears the plateau is gen- erally within the indicated carry- ing capacity.
The ranching economy is basi- cally beef production, with an average of 3,000 head, comprised of 65% Boran and 23% Boran crosses. Many ranchers have high- grade exotic bulls (Bos taurus), but some are turning to artificial insemination to produce controlled crosses. Although sheep were among the first livestock intro- duced in Laikipia by Europeans, they have never gained the promi- nence that cattle have. Seventy- seven per cent of the 62,500 sheep found on 25 ranches are the wool- producing Merino breed.
Management, production, and range improvement are directly proportional to development in most cases. Paddocking into units consistent with the size of the ranch and system of Razing, and with water available in each pad- dock, is the desired objective. Based on an arbitrary classification considering perimeter fencing and paddocking, as well as water de- velopment and the furthest that stock must travel to water, 60% of the 42 ranches are in stages of ad- vanced development or are fully developed. The Ministry of Agri- culture uses an estimate of 70 cents to $1.12 per acre for water develop- ment.
nal fences after a two-year trial, consisting of three strands of smootl~ wire on Posts 90 feet apart with four droppers. He has found that this effectively bars his mature cattle, while the flexibility allows large game to go through and the lowness allows them to jump over. Rather simple measures have been tried for short-term effect. When fencing a new paddock, one rancher hazed the zebra out before closing the last side, then tied strips of red and white cloth on the top wires for about three miles (Fig. 2). The material endured long enough to keep the zebva spooked out, but became faded and disintegrated in time. Buffalo and other forest wildlife grazed nightly on a ranch lying adjacent to the forest land at the north end of the Aberdares, causing destruction to existing fencing. A combination fence and ditch has been constructed along seven miles of ranch boundary a& jacent to the forest to keep such wildlife out. The ditch is six feet deep, one foot wide at the bottom, seven feet wide at the top, and the dirt is piled three feet high on the ranch side of the ditch (Fig. 3). A four-strand smooth wire fence is built atop the dirt mound, with posts 30 feet apart with four drop- pers. Economically the rancher feels that the increase in forage adjacent to the forest will enable him to run more stock, which will compensate for the barrier cost of $1,120 per mile.
While such a structure ade- quately protects one ranch, and may be justified economically, it then behooves adjacent ranchers, farmers and settlements and/or the government to link such systems with other similar structures or adequate natural barriers to pre- vent the funnelling of the diverted wildlife onto neighboring enter- prises which may be of lower economic potential but neverthe- less essential, such as settlement schemes on a subsistence basis. Twenty miles of game moat exist in the Nyeri area, separating forest and the Aberdare National Park
‘“t hsh.
from adjacent settlement schemes. The government plans to link this moat with the one described at the north end of the Aberdares over the next four years at an estimated cost of $2,464 per mile, plus $280 per mile maintenance costs per year.
Various other styles of game- proof fencing without the moat have been tried with some success. The Timau area was not included in the survey, but three ranches there have been blocked into a unit within a common perimeter fence against buffalo and elephant, as well as vermin (hyena, wild dog, jackal). This highly successful fence has been up six years, and consists primarily of heavy gauge wire netting up to five feet, with angled bracing to the outside from the tops of the posts which are strung with barbed wire. The cost was $980 per mile, but the increased grass production in the pastures adjacent to the forest was felt to justify the cost.
Another type consists of chain- link or ring-lock wire, sometimes with part of the lower portion buried in the ground, with two or more strands of barbed wire on
top, and may have one strand of barbed wire at ground level if the mesh is not buried. This type of fence is usually seven to eight feet high. However, one such fence en- closing approximately 23,000 acres tCi keep hyena and jackals out of sheep paddocks is about five feet high and heavy gauge wire netting was used at a construction cost of $1,000 per mile (Fig. 4).
Fences utilizing chain-link, wo- ven wire, wire netting o* similar tight mesh usually preclude the entrance of most predators and allow their strict control within the enclosure. They also effec- tively block the movement of un- gulates, the species affected being dependent to some extent upon the total height of the fence. There- fore, the extensive uncoordinated use of such structures could have serious implications in regard to unprotected neighbors and certain wildlife populations.
DENNEY
area.
on 83% of the ranches, and dipping or spraying is performed during the tick seasons by most ranches at least fortnightly at an average cost of 3.5 cents per head per treatment.
Arable lands comprised only 0.3% of the area, being devoted to maize, lucerne and other fodder crops, but included 1,500 acres of wheat on one ranch. The bulk of the maize is for African labor.
Livestock can be grazed out throughout the year without sup- plemental feed. The paddocked ranches employ a flexible system of rotation similar to the decision deferment described by Hoffman et al. (196R), based on specific needs or situations, usually for an entire growing season or part of it when moisture conditions are best, and where systematic deferment cannot be applied economically. Some ranchers heavily graze a pad- dock and then rest it until it fully recovers. Some burning is still carried out, especially in the Acacia-Theme& zone, but not with any set frequency.
Slaughter animals are one of the main sources of income, and the study area ranch mean annual shipment was 468 steers, 108 heifers and 43 cull cows. The gross in-
come per ranch from beef cattle and wool sheep averaged $67,236 per year, or $1.90 per acre.
Livestock Mortalities and Control Death losses of livestock natu- rally decrease the productivity of a livestock enterprise, and neces- sary steps to alleviate such losses increase the operating costs. Dis- ease losses on the 42 ranches ranged from 0 to 5%, averaging 1.8%, and with 40% of the ranches reporting less than 1%. Total annual mortal- ity ranged from 0.8 to 8.0%, with an average of 3.2%.
Based on the 123,000 cattle re- ported on these ranches, there would be a total annual death loss of almost 4,000 head, of which ap- proximately 2,200 would be attrib- utable to disease. One rancher stated that 80% of the disease in his cattle was due to tick-borne diseases. Another said that 25% of his disease mortality was due to anaplasmosis, and several other ranchers felt that most of their losses were due to this tick-borne rickettsial disease alone. Tick-borne diseases (anaplasmosis, heartwater, sweating sickness, redwater and East Coast fever), which may be implicated with wildlife, are gen-
erally guarded against through tick control with toxaphene (83% of the ranches, of which 17% use an organo-phosphate in combination). Other diseases as well, attributed by the ranchers to wildlife, are ondiiritis, rinderpest, foot and mouth disease, anthrax, lymphan- gitis, contagious bovine pleuro- pneumonia, leptospirosis, biliary fever, African swine fever, haem- orrhagic septicaemia and black- quarter. Annual expenditures for prophylaxis and treatment of dis- eases and parasites by Laikipia ranchers, apart from dipping and spraying costs, average approxi- mately $958.
Livestock losses from accidents (broken legs, bloat, calving, etc.), plant poisoning and snakebite are of considerable magnitude (1.3%). Predation by “vermin” accounts for mortalities approximating 1.2%, and losses due to spearings and theft amount to 0.7%. Losses in the first and third of these cate- gories can be minimized to some extent by paddocking, and if a ranch isn’t sufficiently developed the herding practices can alleviate some of these losses. Control of losses from predation is effected by shooting, the use of gin (steel) traps and live-traps, poison baits and, to some extent, herding practices, Gun traps used to be employed, but the majority of ranches use carcasses or kills poisoned with strychnine or toxaphene nowadays. Dogs are used extensively by some ranchers to flush, trail, and “tree” or bag predators such as lion, leop- ard, cheetah, hyena, and sometimes jackal.
Wildlife
WILDLIFE
RELATIONSHIPS
419
ant of reasonable numbers, and ex- cept certain species (variable, but
including buffalo almost unani-
mously, and waterbuck, zebra, rhi- noceros, eland, and lion). Of the 38 ranchers claiming tolerance, six
proclaimed themselves essentially
as protectionists. At the other ex-
treme were two ranches with wild- life extermination policies, and two not quite so radical, but considered
intolerant of wildlife. In four
cases it was apparent that the atti-
tude and administrative policy of
the ranch ownership was not ap- proved of or supported by the ranch manager.
Several ranchers remarked that ranching would be much easier and simpler if there was no wild-
life, and in a few cases efforts to drastically reduce wildlife popula-
tions or exterminate them have
been initiated. Fortunately, most
of the ranchers who feel that their
operation would be simplified
without game still prefer to have them around for aesthetic or util- i ty purposes.
Since the welfare of wildlife spe- cies depends so greatly on the atti- tudes of the ranchers toward them,
and their resultant management
policies, it is essential to maintain the tolerance of the ranchers who are tolerant, and to improve the attitudes of those who are not. In view of the expressed thoughts that wildlife adds to the general burden of ranch management, and
to the costs incurred as discussed in the following sections, it would appear that wildlife must pay its own way to maintain tolerance or decrease antipathy. Therefore, it is clear that wildlife must contribute further to the economy of these developed ranches to insure proper game management.
Wildlife Species and Numbers
Sixty-eight species of wild ani- mals were listed as occurring on the 42 ranches, some of which, however, are insignificant econom- ically or are of such low densities as to occur on few ranches. The estimated populations, where appli- cable, are based entirely on guessti- mates by the ranchers, although a
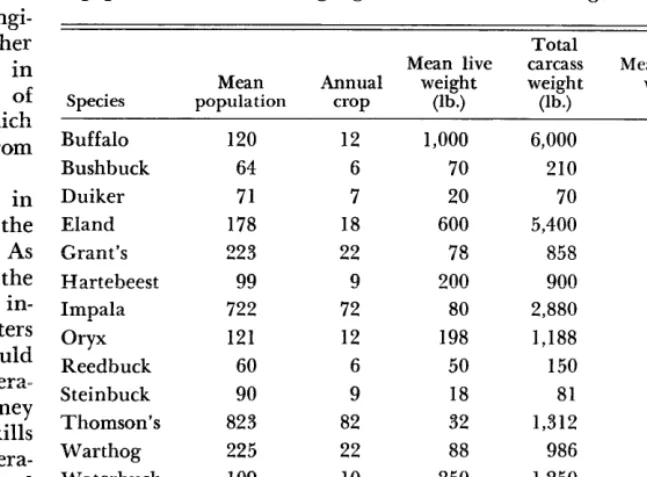
Table 1. Population data for important wildlife species on forty-two Laikipia Plateau ranches, 1967-68.
Species
Number of ranches on which present
Resident Seasonal Resident
Populations
Seasonal Mean Total
Baboon, yellow (Pupio cynocephalus)
Buffalo, cape (Syncerus caffer)
Bushbuck (Trugeluphus scriptus delumerei)
Cheetah (Acinonyx jubutus)
Duiker (Cephulus monticolu, C. nutulensis)
Eland (Tuuro trugus oryx put tersoniunus)
Elephant (Loxodon tu ufricunu)
Gazelle, Grant’s (Gaze&z grunti ruineyi)
Gazelle, Thomson’s (Guzellu thomsonii
thomsonii)
Giraffe, reticulated (Giruffu re ticulutu)
Hartebeest, Kenya Jackson’s (A Zceluphus
buseluphus jucksoni)
Hippopotamus (Hippopotamus umphibius) Hyena, spotted (Crocu tu crocu tu)
Impala (Aepyceros melumpus)
Leopard (Pun theru purdus)
Lion (Puntheru Zeo)
Oryx, beisa (Oryx beisu unnectens) Ostrich, Somali (Struthio camelus)
Reedbuck (Reduncu r. wurdi, R. fulverufulu chunleri)
Rhinoceros, black (Diceros bicornis) Steinbuck (Ruphicerus cumpestris) Warthog (Phucochoerus uethiopicus) Waterbuck (Kobus ellipsiprymnus,
K. defussu)
Zebra, common (Equus burchelli) Zebra, Grevy’s (Equus grevyi grevyi)
11 20
22 34
21 30
22 30
19 32
20 34
5 32
26 27
31 36 750 897 823 26,000
19 29 90 105 97 2,220
31 3.5
11 12
20 34
37 39
31 38
7 28
20 22
21 24
21 27
13 18
20 33
8 13
31 31
38 104 114 109 3,540
38 131 336 234 6,210
5 18 100 20 20
108 58 11
133 70 14
155 201
81 136
216 230
94 104
697 746
10 18
110 132
31 35
7 9
425 4,600
120 3,330
64 1,310
12 300
71 1,360
178 3,000
109 200
223 5,800
99 3,180
21 200
25 430
722 27,080
10 310
14 150
121 2,560
33 730
60 1,270
8 120
90 1,800
420
DENNEY
Game Department study on
27
ofthe ranches in the Rumuruti area indicated that these estimates are reasonably accurate (Hughes, 1968). Population data showing seasonal ranges (resident, and resident plus migratory animals) or means, the number of ranches on which they occur, and total estimated popula- tions are presented in Table 1 for the most important species.
Taking the minimum species
population data from the ranchers that made estimates of numbers, there is a minimum of 100,000 game animals of Thomson’s gazelle-size and over, which would average out to at least 2,500 head per ranch,
with Thomson’s gazelle, impala,
zebra, Grant’s gazelle, warthog,
eland, buffalo, oryx and waterbuck
in decreasing numerical order.
These represent the species which
have the greatest economic po-
tential.
An important class of wildlife, often overlooked or assigned sec- ondary importance, are the avian species. While not dealt with com- prehensively in this survey, some data were obtained which are per- tinent. There is a large number of game birds present in Laikipia, but no attempt was made to deter- mine numbers or actual distribu- tion, although certain significant
population factors were noted.
The ranchers reported that the game bird populations were very much higher about ten years ago,
particularly the helmeted guinea
fowl (Numida mitrata), yellow-
necked spurfowl (Pternistis Zeu-
coscepus), and crested and red-
winged francolins (Francolinus
sephaena and F. leuaillantia). A severe reduction in numbers was thought to have been caused by a
combination of factors, namely
drought, flood, and diseases. Most of the ranchers felt that while the game bird populations are not any- thing like they were, they are in the process of gradually build- ing up again. The slow build-up
was attributed to predation and
poaching on a small basic breeding population.
Disease Relationships
The greatest concern of the
ranchers regarding wildlife is the fear of disease transmission to their
livestock, particularly tick-borne
diseases. In spite of this general feeling, however, five of the ranch- ers had none to negligible disease problems, which they attributed to careful sanitation, prophylaxis and
treatment. There is evidence to
indicate that many parasites and
diseases did not originate with
wildlife, but, on the contrary, were transmitted to them by domestic livestock, e.g. rinderpest. However, this does not change the fact that, whether susceptible to certain dis- eases or not, wildlife may be im- portant reservoirs or carriers of them. Prevention of such diseases in livestock is difficult if prophy- laxis does not exist or is not satis- factory, and, of course, treatment of wildlife is not feasible, if possible. It appears that tick-borne dis- eases can be adequately controlled with proper tick control that new and modern acaricides can pro- vide. Even if all the wildlife were removed from specified areas, cer- tain soil-borne diseases, such as
anthrax, tetanus, blackquarter,
Salmonellosis, lymphadenitis, botu- lism and coccidiosis, would still be almost as prevalent in livestock. On the basis of those diseases attrib- uted to wildlife by the ranchers, it would appear that the most seri- ous threat to livestock is posed by buffalo, with waterbuck a close second, then zebra, eland, impala, Kenya hartebeest, warthog, giraffe, Thomson’s gazelle, steinbuck and elephant in order of decreasing accusations.
In an effort to assign an eco- nomic value to the contributing costs of wildlife in relation to dis- eases and their control or treat- ment, let us assume that one-half the cost of tick control, and one- half the cost of annual veterinary
expenditures, is due to wildlife.
If we arbitrarily assume that the average ranch has 3,000 head of cattle, and dips fortnightly at an average cost of 3.5 cents per head
per time, the annual cost of dipping is $2,800, half of which is $1,400. As determined in this study, the average annual veterinary costs are $958, half of which is $479. There-
fore, wildlife m,ay cost the average
ranch $1,879 annually for disease control.
Forage Competition
Competition for forage consti-
tuted the second largest threat to livestock from wildlife. While the majority of ranchers have a toler- ant attitude toward wildlife in rea- sonable numbers, seasonal influxes of migratory species were felt to be
particularly competitive and/or
damaging.
Forage competition was felt to be negligible by eight of the ranchers,
one of whom qualified this by
stating that this was normally the case with static wildlife popula- tions. Ten ranchers felt that all wildlife species were competitive
because the cattle and sheep
browsed during the dry seasons, therefore competing with grazers
or browsers year-round. Another
said that all species were competi- tive on new grass, and that game took forage on his ranch that would support 150 more cattle at an average value of $62 each. Still another reported that the game went after the best stargrass. One rancher felt that all wildlife except giraffe, gerenuk and elephant were
in competition with his stock,
while another excluded elephant alone from a competitive role.
Zebra were reported by 21 ranch- ers as competing with livestock, with one stating that zebra eat one and a half times the amount that cattle do, and clean off the grass. Eight ranchers listed impala as
being in competition with live-
stock, two of them limiting this
to competition with sheep, and
WILDLIFE RELATIONSHIPS
the forest. Four ranchers listed Kenya hartebeest as competing with livestock, while eland and waterbuck were considered as com- petition in three cases each, and oryx in two instances. Grant’s gazelle and hippo were each listed as competitive in one case. Another rancher felt that all the antelopes were in competition with his cattle. If is interesting to note that one of the ranchers observed that the lack of bush understory in his pad- docks was due, he assumed, to the effect of giraffe. Another rancher was of the opinion that the bush would encroach rapidly into the grassland if all the game was elimi- nated (Fig. 5). There are minimal data available on the food habits of the various wildlife species, par- ticularly as they differ seasonally, and from one habitat to another. Nevertheless, it may be assumed that the most direct competition is from the grazing ungulates, in- cluding those that feed on a mixture of grass and herbaceous dicotyle- dons, such as buffalo, hartebeest, waterbuck, reedbuck, oryx, Grant’s and Thomson’s gazelles, zebra, hippo and warthog. Some of the Laikipia species include grass, her- baceous dicots and browse in their
diets, namely elephant, rhinoceros, impala, bushbuck and eland; others are principally browsers, such as giraffe and gerenuk. Therefore, it does not appear logical to state that all wildlife, or even all ante- lopes, are in direct competition with livestock.
Near the end of the rainy season competition should be at a mini- mum when there is a greater selection of species available and the game is not concentrated. Conversely, competition probably becomes intensified as the dry sea- son progresses and the diversity and quantity of grasses become more limited. At any rate, forage competition may be significant on most ranches, at least seasonally, and from certain species such as zebra on early stages of regrowth.
It is difficult to assess the eco- nomic impact of wildlife competi- tion on these ranches, but asp suming that the rancher who stated that he could run 150 more steers if it were not for game competition was right, then it is costing him almost $2,800 per year (150 head at $62 prorated over three and a half years-the age at which steers are generally sold). This is prob- ably an over-estimation, however,
421
since he was already admittedly overstocked. The overall average annual cost of wildlife competition would probably be nearer $5FO.
Damage and Predation The third liability of wildlife on the ranches concerns damage, both from the standpoint of physical damage to develolnnents such as fences, waterpoints and crops, and losses through predation. Of these, predation caused the greatest eco- nomic losses.
Nine ranchers reported that fence damage was nil or negligible, while 15 reported fence damage to some extent, but not specified as to value. Eleven ranches had fence damage averaging $288. Elephant caused the most fence damage, fol- lowed by buffalo, giraffe, eland, zebra, hartebeest, ostrich, oryx and rhino. Wildlife were reported as responsible for an average of 30% of the annual fence maintenance costs, or $84.
The majority of the game, par- ticularly resident populations, soon get used to the fences and learn about them, although when under stress, such as being chased by dogs when the labor is hunting, or when stampeded, cause some fence dam- age. There is no doubt that exten- sive fencing influences the seasonal movements of game, and contrib- utes to the establishment of resi- dent populations of some species which might otherwise move.
Damage to crops was mainly to maize and wheat, although ele- phants were reported as damaging fruit trees on one ranch. Baboons were the chief culprits in crop dam- age, with rhino, forest hogs, wart- hog, porcupine, Thomson’s gazelle and squirrel reported specifically. No estimates of value were made pertaining to this type of damage. Baboons were reported to foul waterpoints and supplies by several ranchers.