PANDA
Muon System Prototype
Victor Abazov1, Gennady Alexeev1, Maxim Alexeev2, Vladimir Frolov1, Georgy Golovanov1, Sergey Kutuzov1, Alexei Piskun1, Alexander Samartsev1, Valeri Tokmenin1, Alexander
Verkheev1,,LeonidVertogradov1,NikolaiZhuravlev1
1Joint Institute for Nuclear Research, Dubna, Russia 2INFN Sezione di Torino, Torino, Italy
Abstract.The PANDA Experiment will be one of the key experiments at the Facility for
Antiproton and Ion Research (FAIR) which is under construction now in the territory of the GSI Helmholtz Centre for Heavy Ion Research in Darmstadt, Germany. PANDA is aimed to study hadron spectroscopy and various topics of the weak and strong forces. Muon System is chosen as the most suitable technology for detecting the muons. The Prototype of the PANDA Muon System is installed on the test beam line T9 at the Proton Synchrotron (PS) at CERN. Status of the PANDA Muon System prototype is presented with few preliminary results.
1 Introduction
PANDA (antiProton ANnihilation at Darmstadt) experiment is one of the four major scientific pillars of FAIR and is dedicated to perform fundamental research with antiproton beam with the momentum between 1.5 GeV/c and 15 GeV/c interacting with a fixed target inside the PANDA detector. The purpose of this experiment is hadron spectroscopy with the search for exotic particles and nucleon structure measurements for studying in-media effects of hadronic particles or hypernuclei. The envis-aged physics program of the PANDA experiment requires large acceptance, high resolution for track-ing as well as excellent particle identification and calorimetry. To obtain good momentum resolution the PANDA setup is divided into two parts: the Target Spectrometer (TS) based on a superconduct-ing solenoid magnet surroundsuperconduct-ing the interaction point and the Forward Spectrometer (FS) based on a conventional dipole magnet for detecting particles emitted at forward angles.
Muons are an important probe forJ/ψidentification, semi-leptonic D-meson decays and the
Drell-Yan process. To measure muons within a wide momentum range, from hundreds MeV up to 10 GeV inside PANDA the Muon System [1] will be installed. The PANDA Muon System uses a Range System (RS) technique to register muons in a laminated iron absorber. Mini Drift Tubes (MDT) [2, 3] with two-coordinate readout of track information (the wires and the orthogonal strips) are used for charged particle detection in the RS. The resolution of Muon System is enough to use it as a coarse sampling hadron calorimeter. The Muon System consists of four parts: a Barrel (13 sensitive layers), an Endcap (5 layers), a Muon Filter (4 layers) and a Forward RS (16 layers). In the barrel part the granularity of the iron absorber is 3 cm (6 cm for the first and last layers) while in other parts of the
Muon System – 6 cm (for better detection/absorption of muons with higher momenta). The aim of the Muon System is to identify the primary muons with maximal possible separation from background contamination originating mostly from primary low-momenta pions and secondary decay muons.
2 Range System Prototype
To test and optimise different aspects of the PANDA Range System performance based on MDTs with two-coordinate readout, a Range System prototype of the Muon System has been constructed at JINR (Dubna) and installed at CERN. The prototype was placed at the end of the secondary particles test beam line T9 at the Proton Synchrotron. It consists of steel absorber plates, detecting layers of MDTs, strip boards, corresponding front-end electronics for wire and strip readout, trigger and data acquisition system (DAQ), high-voltage and low-voltage supplies, and a gas system. The prototype is designed as ‘4 in 1’ device: the structure of absorber plates reproduces the different parts of the Muon
System mentioned above. The physical dimensions of the prototype are 220 x 150 x 170 cm3. The
weight of the prototype is about 10 tons. The total number of readout channels is about 4000, i.e. 2000 for wires and 2000 for strips. The prototype has equal spatial granularity in both coordinates – 1 cm given by the wire pitch of MDT and the strip width. The wires and strips are running perpendicular to each other.
The information is read out by the trigger and the data acquisition system of the COMPASS (CERN) experiment [4] adapted for the PANDA Muon System prototype.
The main tasks of the beam tests are: 1) study the system response to all types of particles in the full energy range of PANDA; 2) test the algorithms for muon-to-pion separation; 3) tune the Monte Carlo (MC) model parameters.
3 Modeling of Muon System Prototype
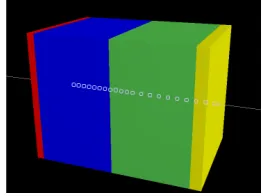
It is important to have the model of the Muon System prototype in PandaRoot package [5] for full MC simulation of PANDA setup. Transfer of the detector geometry from Computer-Aided Design (CAD) systems to particle transports MC codes like GEANT4 [6] and ROOT [7] is always an issue due to possible geometry description incompatibility. To describe the geometry of the existing prototype of PANDA Muon System, its model was developed using CATIA-GDML geometry builder package [8]. The package allows exchanging of the CAD-geometry to GEANT4 or ROOT compatible code using Geometry Description Markup Language (GDML) [9]. The geometrical model of the prototype con-sists of four parts as well as the real setup (see Sec. 2). Each part comprises detector layers consisting of 8-12 MDTs, which are separated by the absorbers of varying thickness. Each MDT consists of 8 sensitive elements, aluminium profiles and plastic envelope. In total, it equals to 24 layers. The geo-metrical model of the prototype was transferred and integrated into PandaRoot framework. Different colors represent different parts of the PANDA Muon System, see Fig. 1. Also new program classes (MdtPrototype, MdtPoint etc.) have been developed and can be added into PandaRoot framework.
4 Experimental Data and Results
Muon System – 6 cm (for better detection/absorption of muons with higher momenta). The aim of the
Muon System is to identify the primary muons with maximal possible separation from background contamination originating mostly from primary low-momenta pions and secondary decay muons.
2 Range System Prototype
To test and optimise different aspects of the PANDA Range System performance based on MDTs
with two-coordinate readout, a Range System prototype of the Muon System has been constructed at JINR (Dubna) and installed at CERN. The prototype was placed at the end of the secondary particles test beam line T9 at the Proton Synchrotron. It consists of steel absorber plates, detecting layers of MDTs, strip boards, corresponding front-end electronics for wire and strip readout, trigger and data acquisition system (DAQ), high-voltage and low-voltage supplies, and a gas system. The prototype is designed as ‘4 in 1’ device: the structure of absorber plates reproduces the different parts of the Muon
System mentioned above. The physical dimensions of the prototype are 220 x 150 x 170 cm3. The
weight of the prototype is about 10 tons. The total number of readout channels is about 4000, i.e. 2000 for wires and 2000 for strips. The prototype has equal spatial granularity in both coordinates – 1 cm given by the wire pitch of MDT and the strip width. The wires and strips are running perpendicular to each other.
The information is read out by the trigger and the data acquisition system of the COMPASS (CERN) experiment [4] adapted for the PANDA Muon System prototype.
The main tasks of the beam tests are: 1) study the system response to all types of particles in the full energy range of PANDA; 2) test the algorithms for muon-to-pion separation; 3) tune the Monte Carlo (MC) model parameters.
3 Modeling of Muon System Prototype
It is important to have the model of the Muon System prototype in PandaRoot package [5] for full MC simulation of PANDA setup. Transfer of the detector geometry from Computer-Aided Design (CAD) systems to particle transports MC codes like GEANT4 [6] and ROOT [7] is always an issue due to possible geometry description incompatibility. To describe the geometry of the existing prototype of PANDA Muon System, its model was developed using CATIA-GDML geometry builder package [8]. The package allows exchanging of the CAD-geometry to GEANT4 or ROOT compatible code using Geometry Description Markup Language (GDML) [9]. The geometrical model of the prototype con-sists of four parts as well as the real setup (see Sec. 2). Each part comprises detector layers consisting of 8-12 MDTs, which are separated by the absorbers of varying thickness. Each MDT consists of 8 sensitive elements, aluminium profiles and plastic envelope. In total, it equals to 24 layers. The geo-metrical model of the prototype was transferred and integrated into PandaRoot framework. Different
colors represent different parts of the PANDA Muon System, see Fig. 1. Also new program classes
(MdtPrototype, MdtPoint etc.) have been developed and can be added into PandaRoot framework.
4 Experimental Data and Results
The main goal of the tests is calibration of the prototype as a particle identification (PID) device - for further use of this information for the Muon System. At the energies above 2 GeV the identification of muons versus hadrons is rather simple: the muon is represented by a ‘straight’ track, the hadron gives obvious sample of a shower. It is demonstrated in Figs. 2(a) and 2(b) for the full depth of the
Figure 1.The geometrical model of the prototype in PandaRoot framework with hits (wire cells) fired by 5 GeV/c muon. Different colors represent different parts of the Muon System.
prototype. The patterns (muon and hadron) were readout from the early version of prototype when it was equipped with only one-dimensional (wire) readout.
It is important to mention that since 2017 we have equipped the prototype with the second coor-dinate (strip) readout system. Fig. 2(c) shows the muon track sample (6 GeV/c) for two-coordinate
readout (wires and orthogonal stripes) obtained for the barrel structure of prototype.
(a) (b) (c)
Figure 2. (a) Muonic sample, (b) hadronic sample: 5 GeV/c with one-coordinate readout (wires only), one bar represents one fired MDT cell (1 cm); (c) two-coordinates readout (wires - left, strips - right) for 6 GeV/c muon momentum; the particles on the figures enter the prototype from top.
The goal of 2017 test beam runs was aimed to identify low energy particles (by measuring their time-of-flight (TOF) in a beam) and study the corresponding response in the prototype structure.
Two test beam runs have been conducted in 2017. The prototype was pre-tested on cosmic rays and then it was installed at the end (focus) of the T9/PS test beam line and experimental data were
collected.
Two scintillation counters of the TOF system have been mounted into the beam line (at the distance
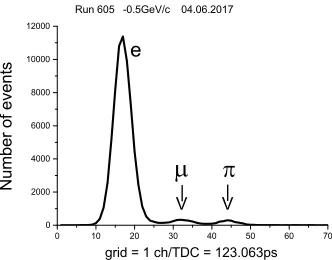
∼26 m of each other) which allowed observing three timing peaks in a beam (electrons, muons and pions). Fig. 3 shows results of particles separation. The beam momentum was set up to 0.5 GeV/c.
Setting the selection criteria for the time-to-digital converter (used by DAQ system) channel numbers allow separating events to two different data samples (withµandπ-mesons) interesting for further analysis.
The obtained data sets were processed, converted to a root format and analysed. At the same time MC simulation of events with muons and pions with the same momentum was performed using prototype geometrical model in the PandaRoot framework. FairBoxGenerator generator is used [5]. To study the prototype response to different particles and find the way to separate the signal muons
Figure 3.Results of particle TOF separation (identification): three peaks correspond to electrons, muons and pions.
pions (black triangles) as a function of the last number of triggered (fired) layer in the prototype in data and MC, respectively. Distributions in data and MC have a similar shape, although they are
different in numerical terms. The experimental data permit us to make an initial/preliminary rough
estimate of the pion-to-muon separation at low (∼0.5 GeV) momentum. So, the overlap of the pionic
and muonic spectra after layer # 7 (to keep high efficiency for muon registration, 93%) gives us∼22%
of pion contamination. Whereas for the MC model we have contamination of pions 27% at 99% of
muon efficiency. We assume now that the observed difference is caused by the secondary muons
present in the beam due to pion-to-muon decay, and we plan to discriminate them in further runs by direct measurement of incoming momenta at the final focus of the beam. The depth of particle
penetration will be used for particle identification in the Muon System at low (≈1 GeV/c) momenta.
Layer number
0 2 4 6 8 10 12
Normalized Number of Events 0 0.1 0.2 0.3 0.4 0.5 0.6
h_lastlayer Entries 7607 Mean 8.585 RMS 1.451
h_lastlayer Entries 4751 Mean 4.337 RMS 2.437 h_lastlayer Entries 4751 Mean 4.337 RMS 2.437 data
-sample
π
-sample
µ
(a)
Layer number
0 2 4 6 8 10 12 14
Normalized Number of Events 0 0.1 0.2 0.3 0.4 0.5 0.6
h_lastlayer Entries 19827 Mean 9.02 RMS 0.634
h_lastlayer Entries 9841 Mean 4.679 RMS 2.473 h_lastlayer Entries 9841 Mean 4.679 RMS 2.473 MC
-sample
π
-sample
µ
(b)
Figure 4. Normalized distributions of events with muons (green line) and pions (black triangles) as a function
of the last hitted layer in the prototype: (a) in data; (b) in MC.
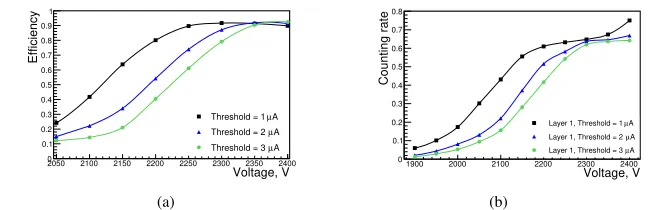
Some methodical tests have been also performed in 2017 using muon samples with the momenta of 2.5 GeV/c. For instance, the efficiency of particle’s registration by MDT as a function of applied high voltage and the input current threshold was obtained, see Fig. 5(a). The detection efficiency of
muon by single MDT at the operating voltage and current threshold (2250V and 1µA) is 92%, which
corresponds to its geometrical efficiency. Fig. 5(b) shows the counting rate of MDT (normalized to trigger rate) as a function of the voltage and the current threshold. These two plots indicate rather
good high voltage operational plateau of MDTs with the small threshold (∼1µA) of about 150 – 200
Figure 3.Results of particle TOF separation (identification): three peaks correspond to electrons, muons and pions.
pions (black triangles) as a function of the last number of triggered (fired) layer in the prototype in data and MC, respectively. Distributions in data and MC have a similar shape, although they are
different in numerical terms. The experimental data permit us to make an initial/preliminary rough
estimate of the pion-to-muon separation at low (∼0.5 GeV) momentum. So, the overlap of the pionic
and muonic spectra after layer # 7 (to keep high efficiency for muon registration, 93%) gives us∼22%
of pion contamination. Whereas for the MC model we have contamination of pions 27% at 99% of
muon efficiency. We assume now that the observed difference is caused by the secondary muons
present in the beam due to pion-to-muon decay, and we plan to discriminate them in further runs by direct measurement of incoming momenta at the final focus of the beam. The depth of particle
penetration will be used for particle identification in the Muon System at low (≈1 GeV/c) momenta.
Layer number
0 2 4 6 8 10 12
Normalized Number of Events 0 0.1 0.2 0.3 0.4 0.5 0.6 h_lastlayer Entries 7607 Mean 8.585 RMS 1.451
h_lastlayer Entries 4751 Mean 4.337 RMS 2.437 h_lastlayer Entries 4751 Mean 4.337 RMS 2.437 data -sample π -sample µ (a) Layer number
0 2 4 6 8 10 12 14
Normalized Number of Events 0 0.1 0.2 0.3 0.4 0.5 0.6 h_lastlayer Entries 19827 Mean 9.02 RMS 0.634
h_lastlayer Entries 9841 Mean 4.679 RMS 2.473 h_lastlayer Entries 9841 Mean 4.679 RMS 2.473 MC -sample π -sample µ (b)
Figure 4. Normalized distributions of events with muons (green line) and pions (black triangles) as a function
of the last hitted layer in the prototype: (a) in data; (b) in MC.
Some methodical tests have been also performed in 2017 using muon samples with the momenta of 2.5 GeV/c. For instance, the efficiency of particle’s registration by MDT as a function of applied high voltage and the input current threshold was obtained, see Fig. 5(a). The detection efficiency of
muon by single MDT at the operating voltage and current threshold (2250V and 1µA) is 92%, which
corresponds to its geometrical efficiency. Fig. 5(b) shows the counting rate of MDT (normalized to trigger rate) as a function of the voltage and the current threshold. These two plots indicate rather
good high voltage operational plateau of MDTs with the small threshold (∼1µA) of about 150 – 200
Volts.
Voltage, V
2050 2100 2150 2200 2250 2300 2350 2400
Efficiency 0 0.1 0.2 0.3 0.4 0.5 0.6 0.7 0.8 0.9 1 A µ
Threshold = 1 A
µ
Threshold = 2 A
µ
Threshold = 3
(a)
Voltage, V
1900 2000 2100 2200 2300 2400
Counting rate 0 0.1 0.2 0.3 0.4 0.5 0.6 0.7 0.8 A µ
Layer 1, Threshold = 1 A
µ
Layer 1, Threshold = 2 A
µ
Layer 1, Threshold = 3
(b)
Figure 5. (a) MDT efficiency and (b) MDT counting rate as a function of voltage and current thresholds.
5 Summary
The geometrical model of the PANDA Muon System Prototype is done and ready to be implemented into the PandaRoot package. It is used to perform MC simulations of events with muons and hadrons. Also in 2017, two test beam runs were conducted at CERN for the PANDA Muon System prototype. It allowed making experimental tests and estimate the muon-to-pion separation in data and MC at low energy. The PANDA Muon System prototype will be modified for 2018 test beam run.
Authors would like to thank Dr. S. Belogurov and E. Ovcharenko - for help with modeling of the PANDA Muon System prototype, I. Konorov - for help and advising on DAQ system and V. Malyshev - for the partici-pating in the beginning of the work. Authors are particularly grateful to L. Gatignon for the multiple and fruitful discussions of the beam features. The work is partially carried out with the financial support of FAIR-Russia Research Center. One of the authors (A. Verkheev) also would like to acknowledge support by JINR, grant for JINR Young Scientists and Specialists no. 17-201-01.
References
[1] PANDA Collaboration, TDR for the: PANDA Muon System
http://www.fair-center.eu/fileadmin/fair/publications_exp/Muon_TDR.pdf.
[2] V. Abazovet al., Instrum. Exp. Tech.53, 356-361 (2010).
[3] V. Abazovet al., Instrum. Exp. Tech.53, 648-652 (2010).
[4] H. Fischeret al., IEEE Trans. Nucl. Sci.49, 443-447 (2002).
[5] https://fairroot.gsi.de/.
[6] S. Agostinelliet al., Nucl. Inst. Meth. Phys. Res. A506, 250-303 (2003).
[7] R. Brun and F. Rademakers, Nucl. Inst. Meth. Phys. Res. A38981-86 (1997).
[8] S. Belogurovet al., J. Phys.: Conf. Ser.513, 022003 (2014).