Clinical Ophthalmology
Dove
press
O r i g i n a l r e s e a r C h
open access to scientific and medical research
Open access Full Text article
Correlation between peripapillary retinal nerve
fiber layer thickness and fundus autofluorescence
in primary open-angle glaucoma
Lukas Reznicek* Florian Seidensticker* Thomas Mann
irene hübert alexandra Buerger Christos haritoglou aljoscha s neubauer Anselm Kampik Christoph hirneiss Marcus Kernt
Department of Ophthalmology, Ludwig-Maximilians-University, Munich, Germany
*These authors contributed equally to this work
Correspondence: Marcus Kernt Ludwig-Maximilians-University, Department of Ophthalmology, Klinikum der Universität München, Campus Innenstadt, Mathildenstrasse 8, D-80336 Munich, Germany
Tel +49 89 5160 3811 Fax +49 9131 5160 5160
email marcus.kernt@med.uni-muenchen. de
Purpose: To investigate the relationship between retinal nerve fiber layer (RNFL) thickness and retinal pigment epithelium alterations in patients with advanced glaucomatous visual field defects.
Methods: A consecutive, prospective series of 82 study eyes with primary open-angle glaucoma and advanced glaucomatous visual field defects were included in this study. All study partici-pants underwent a full ophthalmic examination followed by visual field testing with standard automated perimetry as well as spectral-domain optical coherence tomography (SD-OCT) for peripapillary RNFL thickness and Optos wide-field fundus autofluorescence (FAF) images. A pattern grid with corresponding locations between functional visual field sectors and structural peripapillary RNFL thickness was aligned to the FAF images at corresponding location. Mean FAF intensity (range: 0 = black and 255 = white) of each evaluated sector (superotemporal, temporal, inferotemporal, inferonasal, nasal, superonasal) was correlated with the corresponding peripapillary RNFL thickness obtained with SD-OCT.
Results: Correlation analyses between sectoral RNFL thickness and standardized FAF
inten-sity in the corresponding topographic retina segments revealed partly significant correlations with correlation coefficients ranging between 0.004 and 0.376 and were statistically significant in the temporal inferior central field (r= 0.324, P = 0.036) and the nasal field (r= 0.376, P= 0.014).
Conclusion: Retinal pigment epithelium abnormalities correlate with corresponding peripapil-lary RNFL damage, especially in the temporal inferior sector of patients with advanced glau-comatous visual field defects. A further evaluation of FAF as a potential predictive parameter for glaucomatous damage is necessary.
Keywords: glaucoma, fundus autofluorescence, FAF, retinal nerve fiber layer, RNFL, optical
coherence tomography, OCT, imaging
Introduction
Structural changes in primary open-angle glaucoma (POAG) occur in the optic nerve
head as well as peripapillary retinal nerve fiber layer (RNFL).1–4 While it has been
assumed that structural loss of the RNFL anticipates functional visual field loss, the relationship between structure and function in glaucoma is not yet fully understood and remains the subject of intense research.2,5–9
While a close relationship between RNFL and the retinal pigment epithelium (RPE) is a prerequisite for normal vision,10,11 little is known about RPE involvement in patients suffering from glaucoma. A previously published study on dogs has shown
pathologic abnormalities and RPE damage in glaucomatous eyes.12 Few published
studies on human glaucomatous eyes have shown correlations between peripapillary
Clinical Ophthalmology downloaded from https://www.dovepress.com/ by 118.70.13.36 on 21-Aug-2020
For personal use only.
Number of times this article has been viewed
This article was published in the following Dove Press journal: Clinical Ophthalmology
Dovepress
Reznicek et al
RPE abnormalities and optic nerve degeneration in glaucoma
patients.13–15 A recent study has shown that RPE atrophies
seem to progress over the course of the disease.16
Fundus autofluorescence (FAF) has been used for the evaluation of degenerative, inflammatory, and neoplastic diseases of the posterior fundus.17–20 The FAF signal is suppos-edly derived primarily from fluorophores found in lipofuscin within the RPE layer – mainly fluorophore N-retinylidene-N-retinyl ethanolamine (A2E) – and indicates altered structure as a result of atrophic changes due to inflammation result-ing in increased or decreased FAF in the affected areas.21–23 Open-angle glaucoma (OAG) is generally understood as a degenerative disease and remains one of the leading causes of blindness in the elderly population.3 POAG is the most common subtype of OAG, with glaucoma-typical structural as well as functional glaucomatous alterations.2 To date, there is only very limited evidence on altered RPE signal intensity in glaucoma patients.
The recently developed ultra-wide-field scanning laser oph-thalmoscope Optomap Panoramic 200Tx (Optos, Dunfermline, Fife, Scotland) allows non-mydriatic wide-field imaging and provides an additional wide-field FAF detection modality.
The goal of this study was to investigate the relationship between RNFL thickness and RPE alterations as detected by wide-field FAF in patients suffering from manifest POAG.
Patients and methods
Patients
A consecutive, prospective series of 82 study eyes, mean age 64 years (range: 35–86 years), with POAG and advanced glaucomatous visual field defects was included in this study (47 female and 35 male, 42 right and 40 left eyes).
According to the definition of the European Glaucoma Society and a previous work by Katz et al,24 a visual field defect suspicious for glaucoma is defined as a cluster of at least three or more contiguous non-edge points with
significantly reduced sensitivity (P , 0.05), one of which
with a significance of at least P , 0.01 on the same side of the horizontal meridian in the pattern deviation plot.
All study participants underwent a full ophthalmic examination including best-corrected visual acuity (BCVA) in decimals obtained with a Snellen projection chart; objec-tive and subjecobjec-tive refraction; slit-lamp biomicroscopy; intraocular pressure measurement with Goldmann applana-tion tonometry; gonioscopy; and fundus examinaapplana-tion by indirect ophthalmoscopy.
Each included patient underwent visual field testing followed by spectral-domain optical coherence tomography
(SD-OCT) for peripapillary RNFL thickness and Optos wide-field FAF images.
Only eyes suffering from POAG were included, defined by a documented history of elevated intraocular pressure, characteristic optic nerve head damage, and/or characteristic visual field defects. Exclusion criteria were any evidence for optic nerve head degeneration derived from any other subtype of glaucoma than POAG; opticopathy of any reason other than glaucoma; diabetic retinopathy; macular disease; posterior uveitis; or retinal surgery.
All research was conducted in accordance with insti-tutional guidelines and board approval and conformed to the tenets of the World Medical Association Declaration of Helsinki.
sD-OCT measurements
Conventional predefined circular peripapillary optic nerve head (ONH) cross-sectional scans were obtained from each included study eye with a Spectralis optical coherence tomography device (Heidelberg Engineering, Heidelberg, Germany) with an excitation wavelength of 870 nm running at a speed of 40,000 A-scans per second. Global and sectoral (supero temporal, temporal, inferotemporal, inferonasal,
nasal, and superonasal) RNFL thickness values in µm were
calculated with the inbuilt Heidelberg software.
Optomap imaging
Optomap imaging was performed without pupil dilation. Optomap imaging consisted of taking several images and sav-ing the best image of each included eye for gradsav-ing. The device takes one image in approximately 0.25 seconds, thus avoiding motion artifacts. Total scanning time was about 3–5 minutes, which included patient positioning, and was performed by an experienced technician (TM). Basic operation of the Optomap for ultra-wide-field composite color fundus images involves a scanning laser ophthalmoscope with two laser wavelengths scanning at 532 nm (“green laser separation”) and 633 nm (“red laser separation”). The optical resolution was 3,900–3,072 pixels, resulting in approximately 17–20 pixels per degree. Wide-field FAF images were obtained with an excitation wave length of 532 nm, and autofluorescence was detected by a broadband detector at 540 to 800 nm.
Quantification of FAF signal
intensity and correlation
with peripapillary RNFL thickness
For further analysis, the pattern grid with correspond-ing locations between functional visual field sectors and
Clinical Ophthalmology downloaded from https://www.dovepress.com/ by 118.70.13.36 on 21-Aug-2020
Dovepress Peripapillary RNFL thickness and fundus autofluorescence in POAG
structural peripapillary RNFL thickness originally described
by Garway-Heath et al25 was aligned to the FAF images at
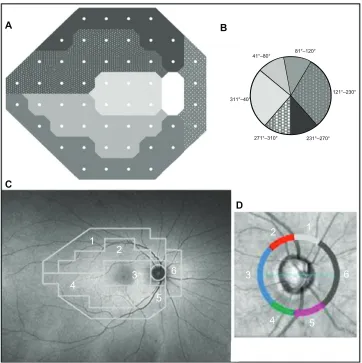
corresponding locations (Figure 1). FAF brightness with val-ues ranging between 0 (black) and 255 (white) was obtained for each FAF sector (superotemporal peripheral [1], super-otemporal central [2], temporal central [3], infersuper-otemporal central [4], inferotemporal peripheral [5], and nasal [6]; Figure 1C and D) using standalone software based on Matlab (7.0 R14; Mathworks Inc, Natick, MA, USA), as described in our previous works.19,27 Mean FAF intensity of each sector was standardized for each included study eye to eliminate individual FAF intensity differences due to aging19 and cor-related with the corresponding peripapillary RNFL thickness obtained with SD-OCT.
statistical analysis
Data were collected and analyzed using SPSS software (version 19.0; IBM Corporation, Armonk, NY, USA).
A P-value of , 0.05 was considered statistically significant. Univariate parametric analyses were applied.
Results
Eighty-two glaucomatous eyes were included in our prospec-tive study. Patient characteristics are displayed in Tables 1 and 2. Mean FAF intensities and mean sectoral peripapillary RNFL thickness values for analyzed subfields 1–6 of each included study eye can be seen in Table 3. The highest mean FAF intensity was observed in the peripheral infero temporal sector, while the central superotemporal sector showed the lowest mean FAF intensity of all investigated subfields (Table 3). Mean RNFL thickness was highest in the peripheral inferotemporal sector and lowest in the nasal sector (Table 3). Correlation analyses between sectoral RNFL thickness and standardized FAF intensity in the corresponding topographic retina segments revealed partly significant correlations (Table 4). Correlation coefficients ranged between 0.004
1
1
2
2
3 6 3 6
5
5 4
4
A B
C
D
41°–80° 81°–120°
121°–230°
231°–270° 271°–310°
311°–40°
Figure 1 Structure–function relationship between visual field (A) and peripapillary nerve fiber layer obtained with spectral-domain optical coherence tomography (C and D), adapted for corresponding locations of the posterior fundus (D).
Note: The principle of the evaluation is based on the works of Strouthis et al.40
Clinical Ophthalmology downloaded from https://www.dovepress.com/ by 118.70.13.36 on 21-Aug-2020
Dovepress
Reznicek et al
may be accompanied by corresponding RPE alterations. These findings apply especially for the temporal inferior and nasal sectors and thus are, at least in part, in agreement with results and observations of previously published data of structure–function relationships in glaucomatous eyes, which suggest the temporal inferior peripapillary region in particular to be a predilection site for structural damage in glaucoma.38,39
Those studies on evaluated functional visual field abnor-malities in glaucoma patients correlated the observed func-tional abnormalities to structural RNFL changes and showed the temporal inferior sector, in particular, to be subject to structural changes in patients with visual field defects due to glaucoma.
Further studies are needed to give a better understanding of peripapillary sectors more susceptible to degenerative changes than others and to possibly address the question as to whether this observation is due to biomechanic or nutritive predisposing anatomic circumstances.
Significant correlations between nasal RNFL thickness and corresponding FAF intensity in human POAG eyes have Table 1 Patient characteristics: age, BCVA, vertical CDR, and
Us-CCT
Parameter n = 84
Patient characteristics
Age (years) 64 ± 13
BCVA (Snellen) 0.78 ± 0.25
CDr 0.82 ± 0.15
US-CCT (µm) 541 ± 35
Note: Values are given as mean ± standard deviation.
Abbreviations: BCVA, best-corrected visual acuity; CDR, vertical cup/disc ratio; US-CCT, ultrasound-based measurement of central corneal thickness.
Table 2 Age distribution of all included patients
Overall n = 84
Age distribution
Age subgroups (years) n
31–40 41–50 51–60 61–70 71–80
4 10 14 31 19
81–90 6
Table 3 Mean FAF intensities and peripapillary RNFL thickness
values for each analyzed sector (1–6)
FAF intensities (0–255)
RNFL thickness (μm)
sector
Superotemporal peripheral (1) 160 ± 27 55.9 ± 15.8 Superotemporal central (2) 146 ± 24 74.2 ± 23.7 Temporal central (3) 163 ± 28 78.6 ± 24.5 Inferotemporal central (4) 165 ± 26 90.3 ± 28.7 Inferotemporal peripheral (5) 175 ± 29 94.0 ± 33.8
Nasal (6) 171 ± 28 54.1 ± 15.2
Note: Values are given as mean ± standard deviation.
Abbreviations: FAF, fundus autofluorescence; RNFL, retinal nerve fiber layer.
Table 4 Correlations (Pearson correlation coefficient) between
FAF intensity and peripapillary RNFL thickness at corresponding sectors (1–6)
Correlation between sectoral mean FAF intensity and RNFL thickness
sector
Superotemporal peripheral (1) 0.273; P= 0.080 Superotemporal central (2) 0.114; P= 0.474 Temporal central (3) 0.004; P= 0.979 Inferotemporal central (4) 0.324; P= 0.036* Inferotemporal peripheral (5) 0.280; P= 0.073
Nasal (6) 0.376; P= 0.014*
Note: *Values that were statistically significant.
Abbreviations: FAF, fundus autofluorescence; RNFL, retinal nerve fiber layer.
and 0.376 and were statistically significant in the temporal inferior central field (r = 0.324, P = 0.036) and the nasal field (r = 0.376, P = 0.014).
Discussion
In retinal metabolism, a close symbiotic interac tion between neurosensory retina and RPE exists.28 RPE has various support functions, including neuroprotection, and its damage results in functional alteration of the
neurosen-sory retina, including the RNFL.29–32 Therefore, FAF has
become a valuable tool in monitoring the development and progression of atrophic RPE dysfunction and consecutive neurosensory degeneration, such as in age-related macula
degeneration (AMD).18,19 A close correlation between RPE
damage measured with FAF intensity and visual
deterio-ration has been de scribed.33–36 In reverse, RNFL damage
may be associated with RPE dysfunction. However, little is known as to whether RNFL damage, which has been demonstrated to correlate with visual field function,7,26,37 is connected with RPE malfunction or degeneration poten-tially detectable by FAF. Our observations of a certain correlation between sectoral RNFL thickness and FAF intensity at corresponding locations in glaucomatous eyes are in accordance with published studies on dogs and reveal a close interaction between RPE and the neurosensory
retina.12 The results of this study provide early evidence
that peripapillary RNFL dege neration in glaucoma patients
Clinical Ophthalmology downloaded from https://www.dovepress.com/ by 118.70.13.36 on 21-Aug-2020
Dovepress Peripapillary RNFL thickness and fundus autofluorescence in POAG
not, to our knowledge, been published so far and remain our focus of continuing research.
A limitation of our study is the fact that, due to its cross-sectional character, we do not have data from over the course of glaucoma disease and are not able to predict any of our observed developments. Additionally, FAF intensity changes
during aging,19 so that interindividual comparison of
mea-sured FAF intensity values should be done with caution.
Conclusion
The presented early data from POAG patients shows that, at first – and from the structural point of view – a certain correlation between FAF, reflecting RPE function, and peri-papillary RNFL thickness exists. As a next step, it will have to be explored whether these findings are in correlation to the actual function deficit measured by visual fields and whether our observation can be interpreted with regards to a potential predictive parameter for glaucomatous damage.
In summary, we were able to correlate RPE abnormali-ties to corresponding peripapillary RNFL damage especially in the temporal inferior sector of patients with manifest glaucomatous visual field defects. A further evaluation of FAF as a potential predictive parameter for glaucomatous damage is necessary.
Disclosure
The authors report no conflicts of interest in this work.
References
1. Douglas GR, Drance SM, Schulzer M. A correlation of fields and discs in open angle glaucoma. Can J Ophthalmol. 1974;9(4):391–398. 2. Zeyen TG, Caprioli J. Progression of disc and field damage in early
glaucoma. Arch Ophthalmol. 1993;111(1):62–65.
3. Quigley HA, Broman AT. The number of people with glaucoma world-wide in 2010 and 2020. Br J Ophthalmol. 2006;90(3):262–267. 4. Quigley HA, Katz J, Derick RJ, Gilbert D, Sommer A. An evaluation of
optic disc and nerve fiber layer examinations in monitoring progression of early glaucoma damage. Ophthalmology. 1992;99(1):19–28. 5. Kerrigan-Baumrind LA, Quigley HA, Pease ME, Kerrigan DF,
Mitchell RS. Number of ganglion cells in glaucoma eyes compared with threshold visual field tests in the same persons. Invest Ophthalmol Vis Sci. 2000;41(3):741–748.
6. Airaksinen PJ, Tuulonen A, Alanko HI. Rate and pattern of neuroretinal rim area decrease in ocular hypertension and glaucoma. Arch Ophthalmol. 1992;110(2):206–210.
7. Swanson WH, Felius J, Pan F. Perimetric defects and ganglion cell damage: interpreting linear relations using a two-stage neural model. Invest Ophthalmol Vis Sci. 2004;45(2):466–472.
8. Keltner JL, Johnson CA, Anderson DR, et al; Ocular Hypertension Treatment Study Group. The association between glaucomatous visual fields and optic nerve head features in the Ocular Hypertension Treatment Study. Ophthalmology. 2006;113(9):1603–1612.
9. Hood DC, Kardon RH. A framework for comparing structural and functional measures of glaucomatous damage. Prog Retin Eye Res. 2007;26(6):688–710.
10. Hosoya K, Tachikawa M. The inner blood-retinal barrier: molecu-lar structure and transport biology. Adv Exp Med Biol. 2012;763: 85–104.
11. Sparrow JR, Hicks D, Hamel CP. The retinal pigment epithelium in health and disease. Curr Mol Med. 2010;10(9):802–823.
12. Mangan BG, Al-Yahya K, Chen CT, et al. Retinal pigment epi-thelial damage, breakdown of the blood-retinal barrier, and retinal inflammation in dogs with primary glaucoma. Vet Ophthalmol. 2007; 10 Suppl 1:117–124.
13. Jonas JB, Naumann GO. Parapapillary retinal vessel diameter in nor-mal and glaucoma eyes. II. Correlations. Invest Ophthalmol Vis Sci. 1989;30(7):1604–1611.
14. Jonas JB, Nguyen XN, Gusek GC, Naumann GO. Parapapillary chori-oretinal atrophy in normal and glaucoma eyes. I. Morphometric data. Invest Ophthalmol Vis Sci. 1989;30(5):908–918.
15. Wilensky JT, Kolker AE. Peripapillary changes in glaucoma. Am J Ophthalmol. 1976;81(3):341–345.
16. Guo Y, Wang YX, Xu L, Jonas JB. Five-year follow-up of parapapillary atrophy: the Beijing Eye Study. PloS One. 2012;7(5):e32005. 17. Yannuzzi LA, Ober MD, Slakter JS, et al. Ophthalmic fundus imaging:
today and beyond. Am J Ophthalmol. 2004;137(3):511–524. 18. Schmitz-Valckenberg S, Holz FG, Bird AC, Spaide RF. Fundus
auto-fluorescence imaging: review and perspectives. Retina. 2008;28(3): 385–409.
19. Reznicek L, Wasfy T, Stumpf C, et al. Peripheral fundus auto-fluorescence is increased in age-related macular degeneration. Invest Ophthalmol Vis Sci. 2012;53(4):2193–2198.
20. Reznicek L, Kernt M, Seidensticker F, et al. Autofluorescence in pos-terior uveitis. Ophthalmology. 2012;119(8):1712–1713. e3.
21. Delori FC, Dorey CK, Staurenghi G, Arend O, Goger DG, Weiter JJ. In vivo fluorescence of the ocular fundus exhibits retinal pigment epithelium lipofuscin characteristics. Invest Ophthalmol Vis Sci. 1995;36(3):718–729.
22. Delori FC, Goger DG, Dorey CK. Age-related accumulation and spatial distribution of lipofuscin in RPE of normal subjects. Invest Ophthalmol Vis Sci. 2001;42(8):1855–1866.
23. Kitagawa K, Nishida S, Ogura Y. In vivo quantitation of auto-fluorescence in human retinal pigment epithelium. Ophthalmologica. 1989;199(2–3):116–121.
24. Katz J, Sommer A, Gaasterland DE, Anderson DR. Comparison of analytic algorithms for detecting glaucomatous visual field loss. Arch Ophthalmol. 1991;109(12):1684–1689.
25. Garway-Heath DF, Poinoosawmy D, Fitzke FW, Hitchings RA. Mapping the visual field to the optic disc in normal tension glaucoma eyes. Ophthalmology. 2000;107(10):1809–8115.
26. Nilforushan N, Nassiri N, Moghimi S, et al. Structure-function relationships between spectral-domain OCT and standard achromatic perimetry. Invest Ophthalmol Vis Sci. 2012;53(6):2740–2748. 27. Reznicek L, Dabov S, Haritoglou C, Kampik A, Kernt M, Neubauer AS.
Green-light fundus autofluorescence in diabetic macular edema. Int J Ophthalmol. 2013;6(1):75–80.
28. Hadziahmetovic M, Kumar U, Song Y, et al. Microarray analysis of murine retinal light damage reveals changes in iron regulatory, complement, and antioxidant genes in the neurosensory retina and isolated RPE. Invest Ophthalmol Vis Sci. 2012;53(9):5231–5241. 29. Strauss O. The retinal pigment epithelium in visual function. Physiol
Rev. 2005;85(3):845–881.
30. Boulton M, Dayhaw-Barker P. The role of the retinal pigment epithelium: topographical variation and ageing changes. Eye (Lond). 2001;15(Pt 3):384–389.
31. Boulton M, Rózanowska M, Rózanowski B. Retinal photodamage. J Photochem Photobiol B. 2001;64(2–3):144–161.
32. Araki T, Taniwaki T, Becerra SP, Chader GJ, Schwartz JP. Pigment epithelium-derived factor (PEDF) differentially protects imma-ture but not maimma-ture cerebellar granule cells against apoptotic cell death. J Neurosci Res. 1998;53(1):7–15.
Clinical Ophthalmology downloaded from https://www.dovepress.com/ by 118.70.13.36 on 21-Aug-2020
Clinical Ophthalmology
Publish your work in this journal
Submit your manuscript here: http://www.dovepress.com/clinical-ophthalmology-journal
Clinical Ophthalmology is an international, peer-reviewed journal covering all subspecialties within ophthalmology. Key topics include: Optometry; Visual science; Pharmacology and drug therapy in eye diseases; Basic Sciences; Primary and Secondary eye care; Patient Safety and Quality of Care Improvements. This journal is indexed on
PubMed Central and CAS, and is the official journal of The Society of Clinical Ophthalmology (SCO). The manuscript management system is completely online and includes a very quick and fair peer-review system, which is all easy to use. Visit http://www.dovepress.com/ testimonials.php to read real quotes from published authors.
Dovepress
Dove
press
Reznicek et al
33. Acton JH, Gibson JM, Cubbidge RP. Quantification of visual field loss in age-related macular degeneration. PloS One. 2012;7(6):e39944. 34. Acton JH, Smith RT, Hood DC, Greenstein VC. Relationship between
retinal layer thickness and the visual field in early age-related macular degeneration. Invest Ophthalmol Vis Sci. 2012;53(12):7618–7624. 35. Seidensticker F, Neubauer AS, Wasfy T, et al. Wide-field fundus
autofluorescence corresponds to visual fields in chorioretinitis patients. Clin Ophthalmol. 2011;5:1667–1671.
36. Coleman HR, Chan CC, Ferris FL 3rd, Chew EY. Age-related macular degeneration. Lancet. 2008;372(9652):1835–1845.
37. Rao HL, Zangwill LM, Weinreb RN, Leite MT, Sample PA, Medeiros FA. Structure-function relationship in glaucoma using spectral-domain opti-cal coherence tomography. Arch Ophthalmol. 2011;129(7):864–871.
38. Vermeer KA, van der Schoot J, Lemij HG, de Boer JF. RPE-normalized RNFL attenuation coefficient maps derived from volumetric OCT imag-ing for glaucoma assessment. Invest Ophthalmol Vis Sci. 2012;53(10): 6102–6108.
39. Leaney J, Healey PR, Lee M, Graham SL. Correlation of structural RNFL parameters and functional measures using HRT3 and Spectralis SD-OCT at different levels of glaucoma severity. Clin Experiment Ophthalmol. 2012;40(8):802–812.
40. Strouthidis NG, Vinciotti V, Tucker AJ, Gardiner SK, Crabb DP, Garway-Heath DF. Structure and function in glaucoma: the relationship between a functional visual field map and an anatomic retinal map. Invest Ophthalmol Vis Sci. 2006;47(12):5356–5362.
Clinical Ophthalmology downloaded from https://www.dovepress.com/ by 118.70.13.36 on 21-Aug-2020