Clinical Pharmacology: Advances and Applications
Dove
press
O R I G I N A L R E S E A R C H
open access to scientific and medical research
Open Access Full Text Article
Effects of irbesartan on serum uric acid levels
in patients with hypertension and diabetes
Makiko Nakamura1
Nobuo Sasai2
Ichiro Hisatome3
Kimiyoshi Ichida1
1Department of Pathophysiology, Tokyo University of Pharmacy and Life Sciences, Tokyo, Japan; 2Sasai Clinic, Kanagawa, Japan; 3Division of Regenerative Medicine and Therapeutics, Institute of Regenerative Medicine and Biofunction, Graduate School of Medical Sciences, Tottori University, Tottori, Japan
Correspondence: Kimiyoshi Ichida Tokyo University of Pharmacy and Life Sciences, 1432-1 Horinouchi, Hachiouji, Tokyo, Japan Tel +81 42 676 5680 Fax +81 42 676 5680 Email ichida@toyaku.ac.jp
Background: Hyperuricemia has been proposed to be a risk factor for cardiovascular disease and chronic kidney disease. Since diabetes is often complicated by hypertension and hype-ruricemia, efficient therapeutic strategy against these two complications is very important in diabetic treatment. It has been reported that the antihypertensive drug, irbesartan, inhibits the renal uric acid reabsorptive transporters, URAT1 and GLUT9; this result suggests that irbesartan decreases serum uric acid level (SUA).
Subjects and methods: A retrospective study of 107 patients with hypertension and diabetes was performed to analyze the effects of irbesartan on blood pressure, estimated glomerular filtration rate (eGFR), and SUA. The follow-up period was 6–12 months. Seventy percent of the patients were diagnosed with diabetic nephropathy stage II–IV. We excluded patients treated with drugs that influenced SUA. The multiple logistic regression analysis was introduced to identify the relative factors for SUA decline. The time-dependent SUA changes were examined in a mixed-linear model.
Results: Irbesartan reduced blood pressure significantly after 1, 6, and 12 months’ treatment. No subject showed significant change in eGFR from baseline level throughout the period. The multiple logistic regression analysis revealed that SUA baseline significantly influenced SUA decline after 6–12 months. In patients whose SUA baseline was $5.9 mg/dL, the SUA was significantly decreased from 6.6±0.16 mg/dL to 6.2±0.16 mg/dL (P=0.010), after 12 months’ irbesartan treatment. In the SUA baseline ,5.9 mg/dL group, the SUA did not show significant change over the monitoring period.
Conclusion: Our results demonstrate that irbesartan reduces the risk of hyperuricemia. No decline in renal function was observed after the initiation of irbesartan treatment. The present report determines the criteria of SUA baseline for introducing an antihyperuricemic effect using irbesartan. Its antihypertensive effect coupled with SUA decline would be effective for the treatment of hypertension complicated by hyperuricemia.
Keywords: angiotensin-receptor blocker, diabetes, hypertension, hyperuricemia, serum uric acid
Introduction
Hyperuricemia has been reported to be an independent risk factor for hypertension,1,2 cardiovascular diseases,3 and kidney diseases.4 Approximately 25% of patients with hypertension have hyperuricemia,1 while approximately 30% of patients with hyper-uricemia or gout have hypertension.2 In diabetic patients, hypertension and decreased renal function with hyperuricemia are major problems.5 Therefore, the effects of anti-hypertensive drugs on serum uric acid level (SUA), especially angiotensin II receptor blockers (ARBs), have been closely scrutinized in recent years.
Clinical Pharmacology: Advances and Applications downloaded from https://www.dovepress.com/ by 118.70.13.36 on 21-Aug-2020
For personal use only.
Number of times this article has been viewed
This article was published in the following Dove Press journal: Clinical Pharmacology: Advances and Applications
Dovepress
Nakamura et al
We have examined the influence on SUA by ARBs and shown that one of the ARBs, irbesartan, inhibits uric acid (UA) transport via the renal UA transporters, urate trans-porter 1 (URAT1) and glucose transtrans-porter 9 (GLUT9).6 URAT1 is involved in lumen-to-cytosol reabsorption of UA at the apical membrane of proximal tubules,7 whereas GLUT9 functions as a UA efflux transporter from tubular cells at the basolateral membrane.8 Mutations of URAT1 or GLUT9 are associated with renal hypouricemia,9–11 indicat-ing that these two transporters play a dominant role in renal UA reabsorption and regulation of SUA. We previously reported that irbesartan (100–500 µM) inhibited the uptake of UA via both URAT1 and GLUT9 in vitro.6 Losartan has been shown to increase urinary UA excretion and to decrease SUA.12 Losartan is associated with a lower risk of incident gout among patients with hypertension.13 Since losartan is not effective for hypouricemic patients harboring URAT1 mutation, it has been demonstrated that the uricosuric action of losartan is via the inhibition of URAT1.14 The URAT1 inhibitory effects of irbesartan exceeded those of losartan in vitro, and the results suggest that irbesartan has the effect of decreasing SUA through increasing urinary UA excretion.6 Except for losartan and irbesartan, ARBs have been reported to increase the risk of gout13 and to increase the SUA.15 If irbesartan decreases SUA, its multiple effects would also make it useful for the treatment of hypertension combined with hyperuricemia.
A large study was performed in hypertensive patients with hyperuricemia to examine the effects of irbesartan on SUA for 2 months.16 Although the SUA decrease was observed in irbesartan-treated subjects (from 7.06 mg/dL baseline to 6.85 mg/dL), it was not significant and was less than in those treated with losartan (from 7.09 mg/dL to 6.03 mg/dL).16 In contrast, irbesartan was reported to decrease SUA significantly in hypertensive patients with advanced chronic renal disease.17 Since inconsistent results have been reported regarding its effects on SUA, it is neces-sary to determine whether irbesartan has an SUA decreasing effect. In the present study, we investigated the effects of irbesartan on SUA in hypertensive diabetic patients treated with 50–150 mg irbesartan.
Subjects and methods
Subjects
The study was approved by the Ethics Committee of Tokyo University of Pharmacy and Life Sciences and carried out in accordance with recommendations from the Declaration
of Helsinki. This was a retrospective study performed at a diabetic clinic in Chigasaki (Japan). The subjects were 134 stable diabetic outpatients treated with irbesartan for 6–12 months in 2011–2012. We excluded 27 patients treated with drugs that influenced SUA such as allopurinol, diuretics, or fenofibrate. The remaining 107 patients were examined in this study. Out of these, 72 patients had been previously treated with other ARBs and the medicine was switched to irbesartan (designated the ARBs–IRB switch group). Other patients were started on irbesartan as the first ARB (designated the IRB group). Diabetic nephropathy was staged according to an analysis of the urinary albumin excretion (UAE) and eGFR as defined by the Japanese Society of Nephrology from the Japanese historical cohort study:18 stage I, UAE ,30 mg/g creatinine; stage II, 30# UAE ,300 mg/g creatinine; stage III, UAE $300 mg/g creatinine or continuous proteinuria (0.5 g/g creatinine #); stage IV, eGFR ,30 mL/min/1.73 m2. Seven patients had the complication of myocardial disease and four of them were treated with a calcium channel blocker in combination with irbesartan. Three other patients had stopped treatment with anticoagulant, calcium channel blocker or nitrate before irbesartan was started. The dose of irbesartan was 50–150 mg. The follow-up period was 12 months for 101 patients and 6 months for the other six patients. Systolic blood pressure (SBP) and diastolic blood pressure (DBP) were recorded before irbesartan treatment (pre), at the begin-ning of the study (0 month), and 1, 3, 6, and 12 months after irbesartan was started. Serum creatinine (SCr) and SUA were measured at the same time point as SBP and DBP. Estimated glomerular filtration rate (eGFR) was calculated from SCr, sex, and patients’ age. The calculation formula defined by the Japanese Society of Nephrology is:
Male eGFR (mL/min/1.73 m2)
=194 × SCr (mg/dL)-1.094× age (years)-0.287 Female eGFR (mL/min/1.73 m2)
=194 × SCr (mg/dL)-1.094× age (years)-0.287× 0.739
Baseline values were calculated as the average of values between pre-treatment examinations and month zero.
Statistical analysis
The data are presented as means ± SD. Student’s t-test was adopted to compare continuous variables and a value of
P,0.05 was considered significant. Univariate logistic regres-sion analysis was used to identify the factors associated with SUA changes. SUA decline after 6 or 12 months’ irbesartan
Clinical Pharmacology: Advances and Applications downloaded from https://www.dovepress.com/ by 118.70.13.36 on 21-Aug-2020
Dovepress Effects of irbesartan on serum uric acid
treatment was employed as the dependent variable. We intro-duced significant (P,0.05) independent variables from the univariate analysis into multiple logistic regression analysis. The sex, history of alcohol intake, and diabetic disease dura-tion were included in the multiple logistic regression analysis as independent variables. The receiver operating characteristic (ROC) curves were used to estimate the SUA cut-off point and this was determined to be where the sum of sensitivity and specificity was maximized. The Bonferroni multi-comparison test method19 was used when correcting for redundancy as required and P-values ,0.05 were again considered to be statistically significant. To compare the time-series data, we introduced a mixed-linear model adjusted for the cutoff of SUA baseline (,5.9 mg/dL or $5.9 mg/dL) and the treatment before irbesartan (the IRB group or the ARBs–IRB switch group) as fixed effects. Analyses were performed with subjects as random effects. Data were analyzed using SPSS statistical software package for Windows (v21.0; SPSS Inc., Chicago, IL, USA).
Results and discussion
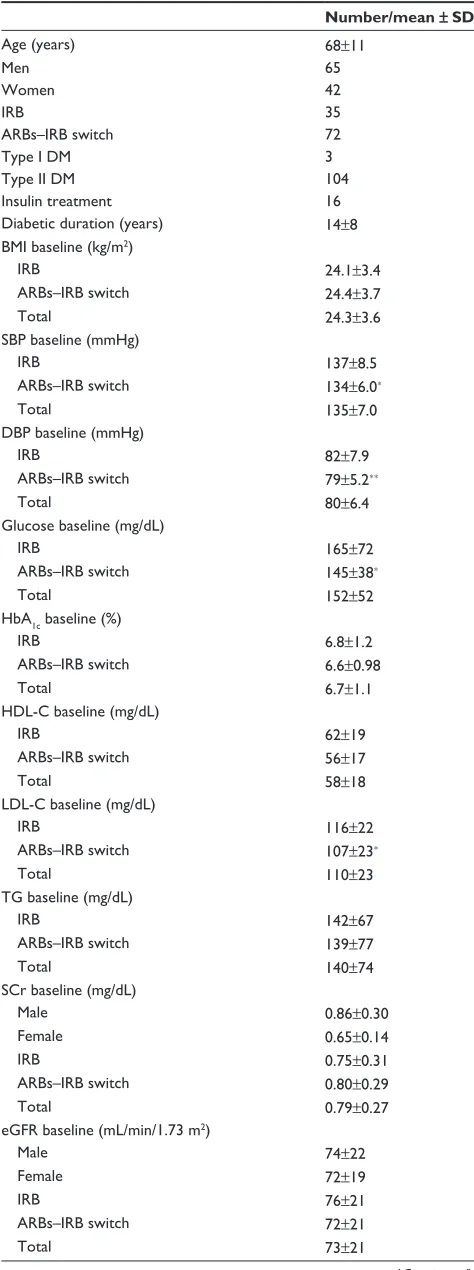
Here, the SUA-depressing effect of irbesartan was investigated retrospectively in 107 hypertensive outpatients with diabetes. The clinical characteristics of the patients are shown in Table 1. Patients in the ARBs–IRB switch group had significantly lower baselines of SBP and DBP than those of the IRB group because of their antihypertensive treatment. The ARB treat-ment is reported to decrease blood glucose level and total cholesterol.20,21 In agreement with those reports, the ARBs– IRB switch group showed significantly lower glucose baseline and low density lipoprotein-cholesterol baseline than the IRB group (Table 1). There were no significant differences between baseline values of SCr and eGFR in the IRB and ARBs–IRB switch groups. The ARBs–IRB switch group had statistically significantly higher SUA baseline than the IRB group. The possibility of SUA increase by the pre-treatment of ARBs was examined in 53 cases from 72 patients of the ARBs–IRB switch group. The SUA at 6–12 months did not change sig-nificantly from the ARB-naïve baseline values. The number of patients who had elevated SUA from the start of ARB use was almost the same as that of patients with decreased SUA (Table S1). From those results, the ARB pre-treatment was estimated not to be correlated with SUA increase. The baseline values of BP, SCr, eGFR, and SUA of the patients diagnosed with diabetic nephropathy are shown in Table S2. The stages of diabetic nephropathy did not significantly influence these baseline values. No patients developed gout or showed renal stone formation during the study period.
Table 1 Clinical characteristics of the patients
Number/mean ± SD
Age (years) 68±11
Men 65
Women 42
IRB 35
ARBs–IRB switch 72
Type I DM 3
Type II DM 104
Insulin treatment 16
Diabetic duration (years) 14±8
BMI baseline (kg/m2)
IRB 24.1±3.4
ARBs–IRB switch 24.4±3.7
Total 24.3±3.6
SBP baseline (mmHg)
IRB 137±8.5
ARBs–IRB switch 134±6.0*
Total 135±7.0
DBP baseline (mmHg)
IRB 82±7.9
ARBs–IRB switch 79±5.2**
Total 80±6.4
Glucose baseline (mg/dL)
IRB 165±72
ARBs–IRB switch 145±38*
Total 152±52
HbA1c baseline (%)
IRB 6.8±1.2
ARBs–IRB switch 6.6±0.98
Total 6.7±1.1
HDL-C baseline (mg/dL)
IRB 62±19
ARBs–IRB switch 56±17
Total 58±18
LDL-C baseline (mg/dL)
IRB 116±22
ARBs–IRB switch 107±23*
Total 110±23
TG baseline (mg/dL)
IRB 142±67
ARBs–IRB switch 139±77
Total 140±74
SCr baseline (mg/dL)
Male 0.86±0.30
Female 0.65±0.14
IRB 0.75±0.31
ARBs–IRB switch 0.80±0.29
Total 0.79±0.27
eGFR baseline (mL/min/1.73 m2)
Male 74±22
Female 72±19
IRB 76±21
ARBs–IRB switch 72±21
Total 73±21
(Continued)
Clinical Pharmacology: Advances and Applications downloaded from https://www.dovepress.com/ by 118.70.13.36 on 21-Aug-2020
Dovepress
Nakamura et al
The HbA1c values at 6–12 months did not change sig-nificantly from the baseline values (data not shown) and it was suggested that diabetes progression did not occur in the patients over the monitoring period.
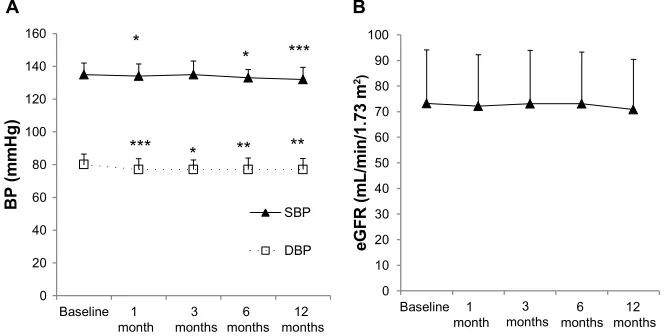
Results for the change in blood pressure (BP) are shown in Figure 1A. The BP baseline values were compared with BP levels at 1–12 months. In all patients, BP was well-controlled in the follow-up period (Figure 1A). SBP levels were decreased significantly at 1, 6, 12 months from baseline and DBP levels were decreased significantly at 1, 3, 6, and 12 months (Figure 1A). There was no significant difference in BP between the IRB group and the ARBs–IRB switch group during the study (data not shown).
0 20 40 60 80 100 120 140 160 Baseline 1
month months3 months6 months12
B P ( m m H g ) SBP DBP A * * *** * ** ** 0 10 20 30 40 50 60 70 80 90 100 Baseline 1 month 3
months months6 12 months eG F R (m L /m in /1 .7 3 m 2) B ***
Figure 1 Changes in blood pressure (A) and eGFR (B) of a total of 107 patients from the baseline compared with 12 months’ irbesartan treatment.
Notes: *P,0.05, **P,0.01, ***P,0.001 versus the baseline.
Table 1 (Continued)
Number/mean ± SD
SUA baseline (mg/dL)
Male 5.7±1.1
Female 4.7±1.0
IRB 5.0±1.0
ARBs–IRB switch 5.4±1.1*
Total 5.3±1.1
Diabetic nephropathy
Stage I 11
Stage II 50
Stage III 19
Stage IV 2
Myocardial disease 7
Cerebrovascular disease 7
Arteriosclerosis 2
Notes:*P,0.05, **P,0.01 versus IRB group by Student’s t-test.
Abbreviations: ARB, angiotensin II receptor blockers; BMI, body mass index; DBP, diastolic blood pressure; DM, diabetes mellitus; eGFR, estimated glomerular
filtration rate; HbA1c, glycated hemoglobin; HDL-C, high-density lipoprotein
cholesterol; IRB, irbesartan; LDL-C, low-density lipoprotein cholesterol; SBP, systolic blood pressure; SCr, serum creatinine; SD, standard deviation; SUA, serum uric acid; TG, triglyceride.
The eGFR did not change significantly from the baseline since irbesartan treatment started (Figure 1B).
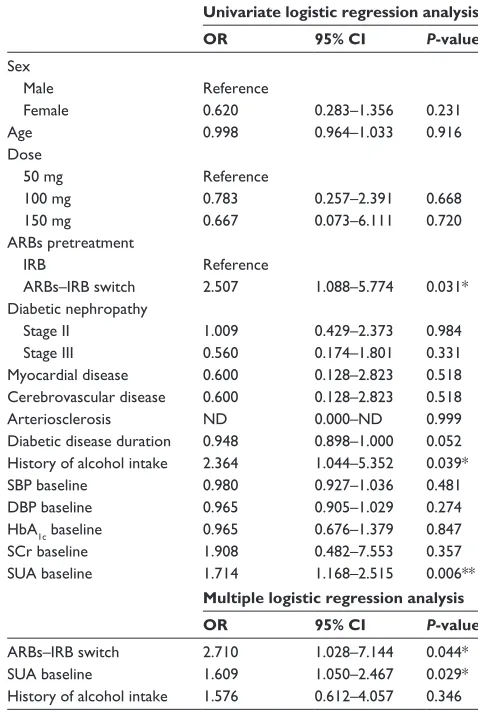
The SUA of the subjects at the end of the study period was compared with the baseline values and the number of the patients with SUA decline was more than half of the patients (Table S3). Thus, we performed univariate logistic regression analysis to identify the factors that influenced SUA changes after 6–12 months (Table S4). SUA decline after 6–12 months was introduced as the dependent variable and some clinical factors were examined with positive effects for SUA changes. The SUA baseline tended to be higher in men than women (Table 1); however, sex was not found to be a significant relative factor for SUA changes (Table S4). The dose of irbesartan, the BP or SCr baseline values, and existence of diabetic nephropathy (stage II and III) were not found to be correlated to SUA. Cardiovascular diseases such as myocardial disease, cerebrovascular disease, and arterio-sclerosis showed no significant effect on the SUA changes. The univariate logistic regression analysis revealed that ARBs–IRB switch, a history of alcohol intake, and higher SUA baseline caused significant SUA decline. Subsequently, we introduced the three significant variables from the uni-variate analysis into the multiple logistic regression analysis (Table S4). The history of alcohol intake was not a signifi-cant variable in the multiple analyses. This may be due to the common restriction of alcohol intake under diabetes treatment. The ARBs–IRB switch and SUA baseline were determined to be significant relative factors in the final model. The ARBs–IRB switch group had significantly higher SUA baseline than the IRB group (Table 1), and this could be the reason why the ARBs–IRB switch was a positive factor for SUA decline. The result of the multiple logistic regression
Clinical Pharmacology: Advances and Applications downloaded from https://www.dovepress.com/ by 118.70.13.36 on 21-Aug-2020
Dovepress Effects of irbesartan on serum uric acid
analysis suggested that the higher SUA baseline led to SUA decline after irbesartan treatment.
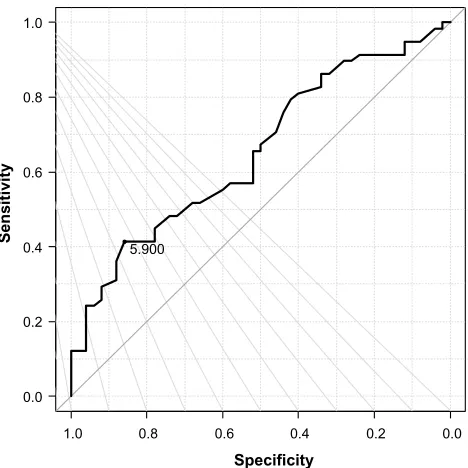
We performed an ROC analysis to determine the cutoff SUA baseline for evaluating dependence of its effect on SUA decreases (Figure S1). The ROC analysis showed that patients with $5.9 mg/dL SUA at baseline had a positive benefit in terms of SUA decline.
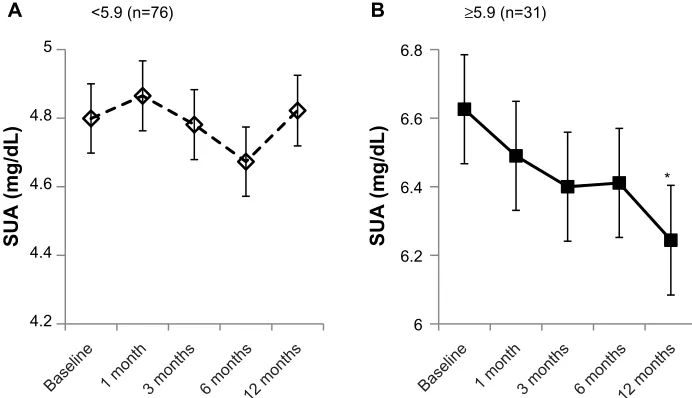
Based on the results of the ROC analysis, the subjects were classified into those with an SUA baseline ,5.9 mg/dL and those $5.9 mg/dL. There was no significant difference in the SUA between the ARBs–IRB and IRB groups except at baseline (data not shown). The irbesartan efficacy on SUA decrease was validated with a mixed-linear model using the 5.9 mg/dL cutoff. The results are shown in Figure 2. The group with an SUA baseline ,5.9 mg/dL showed no significant SUA changes during the study period with the mixed-linear model. Subjects in the SUA baseline $5.9 mg/dL group had signifi-cantly higher SUA than the other group over the monitoring period (P,0.001) and their SUA decreased gradually in a time-dependent manner, with a significant decrease observed at 12 months (from the SUA baseline value 6.6±0.16 mg/dL to 6.2±0.16 mg/dL, P=0.010 by the Bonferroni method).
Conclusion
The present study revealed that irbesartan showed a sig-nificant effect on SUA decline on patients with higher SUA baseline and that the effect of irbesartan was seen markedly in patients with SUA $5.9 mg/dL. This result demonstrates that irbesartan treatment could achieve a decrease of SUA
in hyperuricemic patients. This multiple effect of irbesartan enables efficient treatment for diabetic patients with hyper-tension and hyperuricemia.
Disclosure
This work was funded by Dainippon Sumitomo Pharma Co, Ltd, Osaka, Japan. The authors report no other conflicts of interest in this work.
References
1. Messerli FH, Frohlich ED, Dreslinski GR, Suarez DH, Aristimuno GG. Serum uric acid in essential hypertension: an indicator of renal vascular involvement. Ann Intern Med. 1980;93:817–821.
2. Lin KC, Lin HY, Chou P. The interaction between uric acid level and other risk factors on the development of gout among asymptomatic hyperuricemic men in a prospective study. J Rheumatol. 2000;27:1501–1505. 3. Savarese S, Ferri C, Trimarco B, et al. Changes in serum uric acid levels
and cardiovascular events: a meta-analysis. Nut Metabol Cardiovas Dis. 2013;23:707–714.
4. Sedaghat S, Hoorn EJ, van Rooij FJ, et al. Serum uric acid and chronic kidney disease: The role of hypertension. PLOS One. 2013;8:e76827. 5. Ito H, Abe M, Mifune M, et al. Hyperuricemia is independently
associ-ated with coronary heart disease and renal dysfunction in patients with type 2 diabetes mellitus. PLOS One. 2011;6:e27817.
6. Nakamura M, Anzai N, Jutabha P, Sato H, Sakurai H, Ichida K. Concentration-dependent inhibitory effect of irbesartan on renal uric acid transporters. J Pharmacol Sci. 2010;114:115–118.
7. Enomoto A, Kimura H, Chairoungdua A, et al. Molecular identifica-tion of a renal urate-anion exchanger that regulates blood urate levels.
Nature. 2002;417:447–452.
8. Anzai N, Ichida K, Jutabha P, et al. Plasma urate level is directly regu-lated by a voltage-driven urate efflux transporter URATv1 (SLC2A9) in humans. J Biol Chem. 2008;283:26834–26838.
9. Ichida K, Hosoyamada M, Hisatome I, et al. Clinical and molecular analysis of patients with renal hypouricemia in Japan: influence of URAT1 gene on urinary urate excretion. J Am Soc Nephrol. 2004;15:164–173.
4.2
Baseline 1 month 3 months 6 months12 months
4.4 4.6 4.8 5
SUA (mg/dL) SUA (mg/dL)
<5.9 (n=76)
6 6.2 6.4 6.6 6.8
≥5.9 (n=31)
A B
*
Baseline 1 month 3 months 6 months12 months
Figure 2 Mixed-linear model plots for SUA changes of patients classified according to SUA baseline value (,5.9 mg/dL (A) or $5.9 mg/dL (B)). Estimated marginal means of SUA were plotted from SUA at 0–12 months in covariance with diabetic disease duration.
Note: *P,0.05 versus SUA baseline, calculated by the Bonferroni multi-comparison test method.
Abbreviation: SUA, serum uric acid.
Clinical Pharmacology: Advances and Applications downloaded from https://www.dovepress.com/ by 118.70.13.36 on 21-Aug-2020
Dovepress
Nakamura et al
10. Matsuo H, Chiba T, Nagamori S, et al. Mutations in glucose trans-porter 9 gene SLC2A9 cause renal hypouricemia. Am J Hum Genet. 2008;83:744–751.
11. Dinour D, Gray NK, Campbell S, et al. Homozygous SLC2A9 mutations cause severe renal hypouricemia. J Am Soc Nephrol. 2010;21:64–72. 12. Fauvel JP, Velon S, Berra N, et al. Effects of losartan on renal
func-tion in patients with essential hypertension. J Cardiovasc Pharmacol. 1996;28:259–263.
13. Choi HK, Soriano LC, Zhang Y, Rodríguez LA. Antihypertensive drugs and risk of incident gout among patients with hypertension: population based case-control study. BMJ. 2012;344:d8190.
14. Hamada T, Ichida K, Hosoyamada M, et al. Uricosuric action of losar-tan via the inhibition of urate transporter 1 (URAT1) in hypertensive patients. Am J Hypertens. 2008;21:1157–1162.
15. Nishida Y, Takahashi Y, Susa N, Kanou N, Nakayama T, Asai S. Com-parative effect of angiotensin II type I receptor blockers on serum uric acid in hypertensive patients with type 2 diabetes mellitus: a retrospec-tive observational study. Cardiovasc Diabetol. 2013;12:159. 16. Dang A, Zhang Y, Liu G, Chen G, Song W, Wang B. Effects of losartan
and irbesartan on serum uric acid in hypertensive patients with hype-ruricaemia in Chinese population. J Hum Hypertens. 2006;20:45–50.
17. Coronel F, Cigarrán S, García-Mena M, Herrero JA, Calvo N, Pérez-Flores I. [Irbesartan in hypertensive non-diabetic advanced chronic kidney disease. Comparative study with ACEI]. Nefrologia. 2008;28:56–60. Spanish.
18. Wada T, Haneda M, Furuichi K, et al. Clinical impact of albuminuria and glomerular filtration rate on renal and cardiovascular events, and all-cause mortality in Japanese patients with type 2 diabetes. Clin Exp
Nephrol. Epub October 17, 2013.
19. Curran-Everett D. Multiple comparisons: philosophies and illustrations.
Am J Physiol Regul Integr Comp Physiol. 2000;279:R1–R8.
20. Kitamura N, Takahashi Y, Yamadate S, Asai S. Angiotensin II recep-tor blockers decreased blood glucose levels: a longitudinal survey using data from electronic medical records. Cardiovasc Diabetol. 2007;6:26.
21. Nishida Y, Takahashi Y, Nakayama T, Asai S. Comparative effect of angiotensin II type I receptor blockers and calcium channel blockers on laboratory parameters in hypertensive patients with type 2 diabetes.
Cardiovasc Diabetol. 2012;11:53.
Clinical Pharmacology: Advances and Applications downloaded from https://www.dovepress.com/ by 118.70.13.36 on 21-Aug-2020
Dovepress Effects of irbesartan on serum uric acid
Table S1 SUA changes of the ARBs–IRB switch group by the pre-treatment of ARBs
Number
. baseline = baseline , baseline
SUA at 6–12 months of the ARBs pre-treatment
Candesartan 15 0 12
Telmisartan 9 2 10
Valsartan 2 0 1
Olmesartan 1 0 1
Sum 27 2 24
Note: Baseline means the average of values between ARBs-naïve examinations and the onset of ARBs.
Abbreviations: ARB, angiotensin II receptor blockers; IRB, irbesartan; SUA, serum uric acid.
Table S2 The baseline values of the subjects classified with the stages of diabetic nephropathy
Number SBP
(mmHg)
DBP (mmHg)
SCr (mg/dL)
eGFR
(mL/min/1.73m2)
SUA (mg/dL) Diabetic nephropathy
Stage I 11 136±3.6 81±4.0 0.73±0.13 79±17 5.7±0.92
Stage II 50 136±4.7 79±5.3 0.79±0.19 71±18 5.2±1.1
Stage III 19 135±12 82±9.9 0.84±0.31 74±28 5.8±1.1
Note: The values are represented as mean±standard deviation.
Abbreviations: DBP, diastolic blood pressure; eGFR, estimated glomerular filtration rate; SBP, systolic blood pressure; SCr, serum creatinine; SUA, serum uric acid.
Supplementary material
1.0 0.8 0.6 0.4 0.2 0.0
0.0 0.2 0.4 0.6 0.8 1.0
Specificity
Sensitivity
5.900
Figure S1 ROC analysis of SUA baseline values.
Notes: Decreaseof SUA over 12 months was set to a positive influence and specificity and sensitivity of SUA baseline value were plotted. The cutoff point of SUA when the sum of specificity and sensitivity is maximized was 5.9 mg/dL (specificity, 0.860; sensitivity, 0.414). Area under the curve: 0.6540 and 95% CI: 0.5510–0.7569.
Abbreviations: CI, confidence interval; ROC, receiver operating characteristic; SUA, serum uric acid.
Clinical Pharmacology: Advances and Applications downloaded from https://www.dovepress.com/ by 118.70.13.36 on 21-Aug-2020
Clinical Pharmacology: Advances and Applications
Publish your work in this journal
Clinical Pharmacology: Advances and Applications is an international, peer-reviewed, open access journal publishing original research, reports, reviews and commentaries on all areas of drug experience in humans. The manuscript management system is completely online and includes a very quick and fair peer-review system, which is all easy to use.
Visit http://www.dovepress.com/testimonials.php to read real quotes from published authors.
Dovepress
Dove
press
Nakamura et al
Table S4 Logistic regression analysis of the factors associated with SUA decline
Univariate logistic regression analysis
OR 95% CI P-value
Sex
Male Reference
Female 0.620 0.283–1.356 0.231
Age 0.998 0.964–1.033 0.916
Dose
50 mg Reference
100 mg 0.783 0.257–2.391 0.668
150 mg 0.667 0.073–6.111 0.720
ARBs pretreatment
IRB Reference
ARBs–IRB switch 2.507 1.088–5.774 0.031*
Diabetic nephropathy
Stage II 1.009 0.429–2.373 0.984
Stage III 0.560 0.174–1.801 0.331
Myocardial disease 0.600 0.128–2.823 0.518
Cerebrovascular disease 0.600 0.128–2.823 0.518
Arteriosclerosis ND 0.000–ND 0.999
Diabetic disease duration 0.948 0.898–1.000 0.052 History of alcohol intake 2.364 1.044–5.352 0.039*
SBP baseline 0.980 0.927–1.036 0.481
DBP baseline 0.965 0.905–1.029 0.274
HbA1c baseline 0.965 0.676–1.379 0.847
SCr baseline 1.908 0.482–7.553 0.357
SUA baseline 1.714 1.168–2.515 0.006**
Multiple logistic regression analysis
OR 95% CI P-value
ARBs–IRB switch 2.710 1.028–7.144 0.044*
SUA baseline 1.609 1.050–2.467 0.029*
History of alcohol intake 1.576 0.612–4.057 0.346
Notes: SUA decline after 6–12 months was introduced as dependent variable and
was coded 1. *P,0.05; **P,0.01.
Abbreviations: ARB, angiotensin II receptor blockers; CI, confidence interval;
DBP, diastolic blood pressure; HbA1c, glycated hemoglobin; IRB, irbesartan;
OR, odds ratio; ND, not determined; SBP, systolic blood pressure; SCr, serum creatinine; SUA, serum uric acid.
Table S3 SUA changes from baseline after 6–12 months of irbesartan treatment
Number of patients SUA at the end of the study period
$baseline 50
,baseline 57
Abbreviation: SUA, serum uric acid.
Clinical Pharmacology: Advances and Applications downloaded from https://www.dovepress.com/ by 118.70.13.36 on 21-Aug-2020