_____________________________________________________________________________________________________ *Corresponding author: E-mail: [email protected], [email protected];
23(10): 1-14, 2017; Article no.JAMMR.36343
ISSN: 2456-8899
(Past name: British Journal of Medicine and Medical Research, Past ISSN: 2231-0614, NLM ID: 101570965)
Evaluation of Sonographic Detected Fatty Livers:
Comparison of Multi Parametric MRI with ARFI
Elastography; An Initial Experience
Atul Kapur
1*,
Goldaa Mahajan
1, Aprajita Kapur
1and J. S. Sidhu
11
Department of Radiology, Advanced Diagnostics and Institute of Imaging, 17/8 Kennedy Avenue, The Mall, Amritsar, 143001, Punjab, India.
Authors’ contributions This work was carried out in collaboration between all authors. Author Atul Kapur designed the study,
performed the statistical analysis, wrote the protocol, and wrote the first draft of the manuscript. Authors GM and Aprajita Kapur managed the analyses of the study. Author JSS managed the literature searches. All authors read and approved the final manuscript.
Article Information
DOI: 10.9734/JAMMR/2017/36343 Editor(s): (1) Fatima Mubarak, Department of Radiology, Aga Khan University, Karachi, Pakistan. Reviewers: (1) Mohamed Ahmed Mohamed Nagy Mohamed, El Minia Hospital for Mental Health and Addiction Treatment, Egypt. (2)Ramesh Gurunathan, Sunway Medical Center, Malaysia and Lecturer, Monash University, Australia. (3)Dhastagir Sheriff, Benghazi University, Libya. (4)Romeo-Gabrtiel Mihăilă, “Lucian Blaga” University of Sibiu, Romania. Complete Peer review History:http://www.sciencedomain.org/review-history/20945
Received 24th August 2017 Accepted 8th September 2017 Published 12th September 2017
ABSTRACT
Background: Even as ultrasound based elastography detects changes in liver stiffness with good accuracy newer emerging tools using magnetic resonance imaging(MRI) are being evaluated to have a global assessment of Non alcoholic fatty liver disease(NAFLD). This study was designed to compare the role Multiparametric MRI (mpMRI) and ultrasound elastography in the assessment of fatty liver detected on sonogram.
Study: 50 consecutive non alcoholic patients with no prior history of chronic liver disease with fatty liver on sonogram had shear wave elastography using acoustic radiation force impulse (SW-ARFI) imaging followed by Mp MRI. The median liver stiffness was assessed on ARFI while liver fat content, iron content along with Mean T1 value of liver determined on MpMRI. The results of both modalities were statistically analyzed.
Results: Out of 50 patients examined with echogenic fatty livers, 30 were males and 20 females with mean age of 42 years. The median liver stiffness on ARFI was 1.37 m/s while median T1 on Mp MRI was 653.8 msec. MpMRI showed a sensitivity and specificity of 100%, 91% in detection of liver inflammation with AUC of 1.0 with ARFI. Statistically significant linear relationship was seen between liver iron content and liver fat content in all groups with T1 maps. 3 patients had abnormal high liver iron content with normal liver fat content but had echogenic fatty liver appearance on ultrasound.
Conclusion: Mp MRI detects changes in liver stiffness based on T1 estimation of liver parenchyma with high sensitivity and specificity with results comparable with SWI-ARFI. It has advantage over ARFI being more robust and also estimates liver fat and iron content and can be used a single shot test for comprehensive evaluation of echogenic livers.
Keywords: NAFLD; NASH; Multiparametric MRI; ARFI elastography; Cirrhosis.
1. INTRODUCTION
Non alcoholic fatty liver disease (NAFLD) has a global prevalence and is seen in all age groups in both females and males. Detection of NAFLD has also increased due to the use sonography as first line modality in majority of patients coming with abdominal complaints. However sonography makes the situation more confounding if one has to decide the point of care of newly diagnosed echogenic livers as one need to know more about the presence or absence of liver inflammation and fibrosis which is not possible on sonography. Therefore newer methods based on biochemical tests of fibrosis and imaging tools based on shear wave, transient elastography and magnetic resonance imaging (MRI) are being evaluated. The newer biochemical based tests are not easily available and also incur higher costs while the existing routine liver biochemistry has been shown to be of little value in determining the severity of liver fibrosis [1].
Shear wave elastography (SWE) has
revolutionized the assessment of liver fibrosis over the last decade. The technique is based on the generation of shear wave propagation by acoustic radiation force imaging (ARFI) and the measured velocity of propagated shear wave corresponds to the tissue stiffness [2,3]. A recent meta-analysis of SWE /ARFI in NAFLD reported good diagnostic accuracy of SWE/ARFI in assessing significant fibrosis in patients with NAFLD (AUC of 0.898) [4].
Similarly MRI based techniques are also becoming attractive tools for liver fibrosis
assessment. In contrast to ultrasound
techniques, MR is free from operator
dependence and sampling errors of elastography .In a recent prospective study of patients with various chronic liver diseases, MR elastography
had excellent diagnostic accuracy for the differentiation of all stages of fibrosis, with AUC of 0.99 and 1.00 for F3, F4 disease respectively [5]. MR based techniques of liver evaluation also appear to be attractive in quantification of liver fat and iron which has not possible so far on other imaging techniques [6,7]. There have been only few studies to evaluate MR to study the epidemiology of NAFLD [8,9,10].
Multiparametric MRI (MpMRI) is a novel technique combining T1 mapping with MR spectroscopy and proton density fat fraction estimation to quantify fat and iron of liver along with estimation of fibrosis and inflammation [11,12,13,14]. Only limited studies have been done using this technique in patients with established chronic liver diseases [14].
Since there has been no study done so far to compare MpMRI with shear wave elastography the present study was conducted to assess the usefulness of Mp MRI in patients with newly diagnosed echogenic livers on sonography. The observed findings were compared the findings of SW-ARFI using the latter as the reference standard.
2. MATERIALS AND METHODS
Kapur et al.; JAMMR, 23(10): 1-14, 2017; Article no.JAMMR.36343
observer who interpreted MpMRI findings. On the same day the patient then underwent Mp MRI on Siemens Amira 1.5 Tesla MRI for T1mapping, proton spectroscopy and T2* mapping, to quantify liver fibrosis, fat content (LFC) and liver iron content (LIC) respectively.
2.1 The Protocol Involved
All patients undergoing the scan were fasting for at least 3 hours. The average scan time for this protocol was 10 min. T1 relaxation time map was acquired using the shortened Modified Look Locker Inversion (shMOLLI) recovery sequence in the axial plane of the liver. This sequence sampled the T1 recovery curve using single-shot
balanced steady state free precession
acquisition. Each acquisition generated an R2 map for the fit of signal intensity to the exponential recovery curve. A total number of three axial sections of the liver were taken and
the mean T1 was determined by ROI in right lobe of liver. This was followed by T2*W maps at the same level to estimate the T2*W shortening if any from the base line
normal of 23 msec and a corrected T1 value obtained in case of T2* shortening below normal (cT1).
LFC and LIC were quantified using localized proton spectroscopy after avoiding any vascular or biliary structure and the results displayed as a percentage of the liver water content on a color scale using Siemens Liver lab software.
2.2 Statistical Analysis
Descriptive statistics were used to summarize subject characteristics into three groups of patients a) Group I patients with simple NAFLD b) Group II patients of NAFLD with raised liver stiffness but less than 2.0 m/s on ARFI c) Group III patients with Liver stiffness more than 2.0 m/s.LFC and LIC were calculated for all three groups. Pearson’s correlation was performed between shear wave velocities of liver on ARFI and T1maps on MpMRI. Chi square test was done to establish the statistical difference in liver stiffness between three groups by both the modalities. Sensitivity, specificity along with AUC‘s were performed for MpMRI s to determine its usefulness compared with ARFI.
3. RESULTS
Out of the 50 consecutive patients examined for sonographic fatty livers, 30 were males and 20
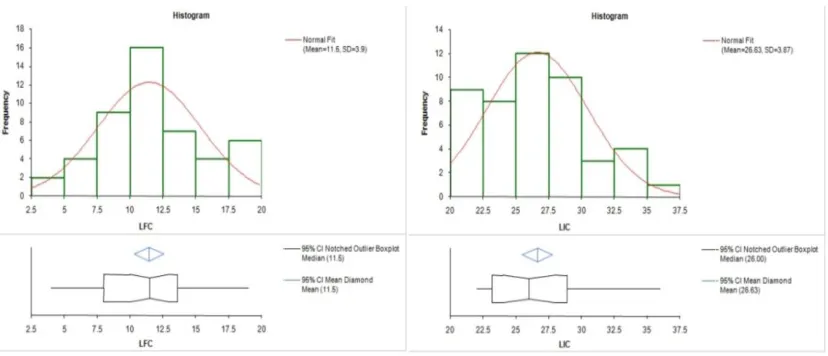
females with mean age of 42 years (36.5- 46 years). The median liver stiffness on ARFI was 1.37 m/sec while the mean liver Stiffness on cT1 mapping was 653.8ms (631.5-676.5 ms: 95% CI) (Fig. 1). The mean liver fat content (LFC) was 11.4% (10.2-12.5: 95% CI) and mean liver iron content (LIC) was 26.16s-1 (25.5-27.18:95% CI) (Fig. 2). 21 patients were having simple NAFLD (Table 1) (Fig. 3a-c), while10 were having Cirrhosis (Fig. 4a-c) with SWV of more than 2.0 m/s, 16 patients had fatty livers with raised tissue stiffness with SWV of 1.31-1.99 m/s and were patients with inflammation and or fibrosis (Fig. 5 a-c), 3 patients were having normal fat quantification on MpMRI but with raised LIC and were categorized as dysmetabolic iron overload syndrome (DIOS) (Fig. 6a-c)). The mean LFC and LIC in patients with NAFLD and those with NAFLD with raised stiffness was 13.1%, 13.7% and 23.8 and 27.86 s-1 respectively; the
difference between LIC being statistically
significant (p value<0.001). Median stiffness by ARFI in patients with NAFLD and NAFLD with increased stiffness was 0.92 m/s and 1.45 m/s and in cirrhosis was 2.05 m/s While the mean T1 values on Mp MRI were 574.6 msec, 664 msec and 804msec respectively. Chi square test for stiffness in all these subgroups showed statistically significant differences in the stiffness values p <0.001 (Fig. 7). Pearson’s correlation done between shear wave velocity and the T1values on MpMRI showed a good correlation; r=1.0 p value 0.013. The AUC’s for both ARFI and MpMRI was 1.0 (Fig. 8) .The MpMRI however showed a sensitivity and specificity, positive predictive and negative value of 100%, 91%, 93% and 100% respectively with a high
odds ratio of 11.5 in detecting
fibrosis/inflammation in the liver (Fig. 8). ARFI showed sensitivity, specificity and positive and negative predictive value of 100%, 78%, 84%, and 100% with likelihood ratio of 4.6 for detection of fibrosis and inflammation. The slightly lower specificity of ARFI was due to 3 patients of DIOS which were not detected on ARFI elastography. Polynomial regression analysis was done between LFC, LIC and T1 mapping and showed a statistically significant inverse linear correlation between LFC and T1 maps and a positive statistically significant correlation between LIC and T1 maps<0.001 (Figs. 9,10).
4. DISCUSSION
diagnostic test to detect and stage the disease. Ultrasonography remains the first line modality to evaluate such patients but it falls short in detecting inflammatory/fibrotic changes and also in quantification of liver fat. SWE and transient elastography have also been in use since quite time as the next step modalities to determine liver stiffness and give robust information. Use of
Table 1. Patient demographics, liver stiffness, LIC AND LFC
Group Mean age Number of. patients
Group I 42.5 years 21
Group II 38 years 16
Group III 46 years 10
DIOS 3
Fig. 1. Histograms of frequency distribution of Corrected T1 values on MpMRI (left side) and Shear wave velocities on ARFI elastography (right side).
Fig. 2. Histograms of frequency
iron content (LIC) on the right side.
diagnostic test to detect and stage the disease. Ultrasonography remains the first line modality to evaluate such patients but it falls short in detecting inflammatory/fibrotic changes and also in quantification of liver fat. SWE and transient graphy have also been in use since quite time as the next step modalities to determine liver stiffness and give robust information. Use of
Controlled attenuation parameter(CAP) in
transient elastography using XL probes has been shown to quantify liver fat into Steatosis 0 grades with varying sensitivity of 55
limitations especially in patients with increased BMI of more than 30, presence of ascites and there is still lack of a clear cut
quantify liver fat [15].
Table 1. Patient demographics, liver stiffness, LIC AND LFC
Number of. patients SWV(m/s) T1 (msec) LIC (s-1)
0.92 574.6 23.8
1.45 664 27.8
2.05 804 28.1
1.33 684 35.5
1. Histograms of frequency distribution of Corrected T1 values on MpMRI (left side) and Shear wave velocities on ARFI elastography (right side).
Histograms of frequency distribution of Liver fat content (LFC) on left side and Liver iron content (LIC) on the right side.
Controlled attenuation parameter(CAP) in
transient elastography using XL probes has been into Steatosis 0-3 grades with varying sensitivity of 55-91% but has limitations especially in patients with increased BMI of more than 30, presence of ascites and there is still lack of a clear cut off value to
1) LFC (%)
15.1 13.7 8.30% 3%
1. Histograms of frequency distribution of Corrected T1 values on MpMRI (left side) and
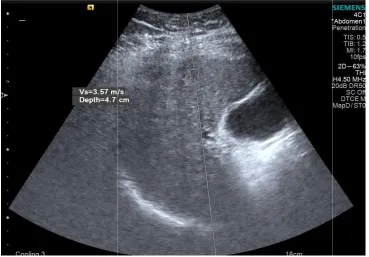
Fig. 3. A): ARFI image showing reduced shear wave vel
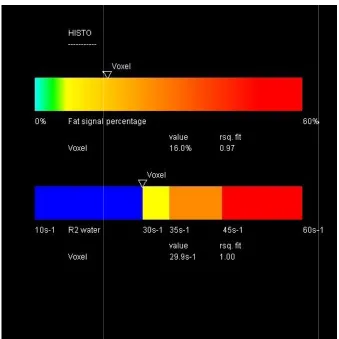
Fig. 3. B): MR spectroscopy Histobar showing increased LFC
Kapur et al.; JAMMR, 23(10): 1-14, 2017; Article no.
A): ARFI image showing reduced shear wave velocity of 0.58m/s in fatty liver
MR spectroscopy Histobar showing increased LFC of 16% with LIC of 29.9 s
Article no.JAMMR.36343
ocity of 0.58m/s in fatty liver
Fig. 3. C): T1 parametric map of liver showing T1 shortening of 538 msec in group I patient.
Fig. 4. A): Group III patient showing
T1 parametric map of liver showing T1 shortening of 538 msec in group I patient.
Group III patient showing raised SWV of 3.87 m/s on ARFI
T1 parametric map of liver showing T1 shortening of 538 msec in group I patient.
Fig. 4. B): Group III same patient showing Normal LFC
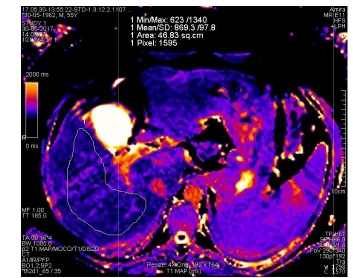
Fig. 4. C): MpMRI image of T1 map showing increased T1 of 869msec.
Kapur et al.; JAMMR, 23(10): 1-14, 2017; Article no.
Group III same patient showing Normal LFC of 1.9% and normal LIC of 21.1 s
MpMRI image of T1 map showing increased T1 of 869msec.
Article no.JAMMR.36343
of 1.9% and normal LIC of 21.1 s-1
Fig. 5. A): Group II patient with ARFI showing mild increased SWV of 1.39m/s
Fig. 5. B): Liver Histo bar showing LFC of 9.1% and LIC
Group II patient with ARFI showing mild increased SWV of 1.39m/s
Fig. 5. C): Mp MRI using Sh-MOLLI showing T1 map wi
Fig. 6. A): ARFI image showing reduced SWV of 0.88m/s with fatty liver
Kapur et al.; JAMMR, 23(10): 1-14, 2017; Article no.
MOLLI showing T1 map with increased T1 in same patient
ARFI image showing reduced SWV of 0.88m/s with fatty liver
Article no.JAMMR.36343
th increased T1 in same patient
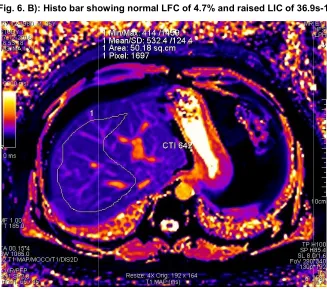
Fig. 6. B): Histo bar showing normal LFC of
Fig. 6. C): Corrected T1 map
Histo bar showing normal LFC of 4.7% and raised LIC of 36.9s
Fig. 7. Chi square analysis of differences in stiffness
Fig. 8. Sensitivity and Specificity chart along
liver stiffness changes in fatty livers
Fig. 9. Polynomial regression analysis between liver stiffness changes seen between LFC and
Kapur et al.; JAMMR, 23(10): 1-14, 2017; Article no.
7. Chi square analysis of differences in stiffness in three groups of fatty livers
8. Sensitivity and Specificity chart along with AUC analysis of MpMRI and ARFI liver stiffness changes in fatty livers
Polynomial regression analysis between liver stiffness changes seen between LFC and T1 on Mp MRI
Article no.JAMMR.36343
in three groups of fatty livers
with AUC analysis of MpMRI and ARFI to detect
Fig. 10. Polynomial regression analysis betwee
The current study shows that MpMRI gives a detailed non-invasive tissue characterization of a large sample of liver parenchyma, and also can detect and quantify liver fat content. In the present study all the patients of NAFLD had a coexisting hepatic fat and liver iron overload with a statistically significant correlation between LFC and LIC (p<0.001) thus suggesting a synergistic mechanism of pathogenesis of disease as has been suggested by different studies done earlie [11,12]. Studies have shown up to 40% of NAFLD patients have concomitant iron overload [6,12]. We observed in this study almost all patients had high LIC which is however not as high as seen in hemachromatosis. All Patients in our study had a higher content of liver iron from a baseline of 14 ms^-1 with a mean of 26.16s (range 14-29) which was on the upper limits of normal range i.e. <29s^-1.Only three patients of DIOS had LIC above the normal range and had a normal liver fat content. Whether it is the increasing iron loading leading to insulin resistance and fatty liver or fatty liver leading to dysregulation of liver hepicidin, ferroportin transporter and increased LIC levels further studies on a larger patient group need to be done to have a final answer. We do hypothesize from the findings of this study that those races like the Indian population Cohort studied who have a higher baseline normal LIC would predispose to having fatty livers. This can be a cause or an effect relationship and is irrespec
presence or absence of liver inflammation. Further increases in LIC would predispose to developing increased liver stiffness due to inflammation and fibrosis as the study showed a statistically significant increased LIC in patients with raised liver stiffness compared to those with simple NAFLD i.e. 23.8 and 27.86 s
respectively.
Polynomial regression analysis between liver stiffness changes seen between LIC and T1 on Mp MRI
The current study shows that MpMRI gives a invasive tissue characterization of a large sample of liver parenchyma, and also can detect and quantify liver fat content. In the NAFLD had a coexisting hepatic fat and liver iron overload with a statistically significant correlation between LFC and LIC (p<0.001) thus suggesting a synergistic mechanism of pathogenesis of disease as has been suggested by different studies done earlier . Studies have shown up to 40% of NAFLD patients have concomitant iron overload . We observed in this study almost all patients had high LIC which is however not as high as seen in hemachromatosis. All Patients in ent of liver iron from a 1 with a mean of 26.16s-1 29) which was on the upper limits of 1.Only three patients of DIOS had LIC above the normal range and had a normal liver fat content. Whether it is the increasing iron loading leading to insulin resistance and fatty liver or fatty liver leading to dysregulation of liver hepicidin, ferroportin transporter and increased LIC levels further studies on a larger patient group need to be done wer. We do hypothesize from the findings of this study that those races like the Indian population Cohort studied who have a higher baseline normal LIC would predispose to having fatty livers. This can be a cause or an effect relationship and is irrespective of the presence or absence of liver inflammation. Further increases in LIC would predispose to developing increased liver stiffness due to inflammation and fibrosis as the study showed a statistically significant increased LIC in patients liver stiffness compared to those with simple NAFLD i.e. 23.8 and 27.86 s-1(p = 0.01)
Therefore increased LIC could be a precursor to NASH in NAFLD and hence monitoring of LIC in NAFLD by the use of Mp MRI can play a important role in the disease management a practice which has been used only in iron storage disorders so far [13]. Interestingly the quantity of liver fat content did not show any significant difference in both the groups of NAFLD and NAFLD with inflammation/fibrosis and was 13.1% and 13.7% respectively. This observation suggests that liver fat may not have a direct role in causing inflammatory/fibrotic process in the liver parenchyma.
The study also shows that out of 50 patients there were 3(6%) patients having increased liver
echogenicity on sonography who were
diagnosed as fatty livers but had normal liver fat on MpMRI; these were patients of DIOS. This has clinical implications in the treatment and follows up of such patients. Hence incorporation of hepatic lipid and iron quantification in the multiparametric MR protocol can become an important factor in managing such patients.
Mp MRI showed a high sensitivity and specificity of 100%and 91% in the present study to detect changes in the liver stiffness seen on T1 map and which correlated with the established standard of measuring liver stiffness by ARFI technique. A high odds ratio of 11.5 was seen in the present study which was similar to results shown by earlier study [13]. MpMRI had the advantage of not being affected by pre
obesity, ascites and assessing entire liver volume rather than point area of sampling.
5. CONCLUSION
To conclude Mp MRI detects changes in liver stiffness as changes in T1 of liver parenchyma
between LIC and
Therefore increased LIC could be a precursor to NASH in NAFLD and hence monitoring of LIC in NAFLD by the use of Mp MRI can play a sease management a practice which has been used only in iron . Interestingly the quantity of liver fat content did not show any significant difference in both the groups of NAFLD and NAFLD with inflammation/fibrosis 1% and 13.7% respectively. This observation suggests that liver fat may not have a direct role in causing inflammatory/fibrotic
The study also shows that out of 50 patients there were 3(6%) patients having increased liver
echogenicity on sonography who were
diagnosed as fatty livers but had normal liver fat on MpMRI; these were patients of DIOS. This has clinical implications in the treatment and follows up of such patients. Hence incorporation ntification in the multiparametric MR protocol can become an important factor in managing such patients.
Mp MRI showed a high sensitivity and specificity of 100%and 91% in the present study to detect changes in the liver stiffness seen on T1 map correlated with the established standard of measuring liver stiffness by ARFI technique. A high odds ratio of 11.5 was seen in the present study which was similar to results . MpMRI had the advantage of not being affected by presence of obesity, ascites and assessing entire liver volume rather than point area of sampling.
Kapur et al.; JAMMR, 23(10): 1-14, 2017; Article no.JAMMR.36343
accurately and along with detection of liver iron and fat content can perform a comprehensive assessment of NAFLD changes in liver which can diagnose, stage the extent of disease and can be of help in the future management.
6. STUDY LIMITATIONS
The study has few limitations:
1. No liver biopsy and biochemical profile was
done as our cohort comprised of
unselected patients attending sonography
outdoor clinic for gastrointestinal
complaints with no prior history of any chronic medical disease. The study was designed to triage patients with echogenic livers based on liver stiffness using ARFI as the reference standard into those with normal and raised liver stiffness. No
attempt was made to differentiate
inflammation from fibrosis in the patients studied.
2. Study is of small size and was to assess the initial proof of the feasibility of MpMRI in evaluation of NAFLD.
With encouraging initial results larger studies need to be done to define an algorithm for the use of MpMRI as single shot test to evaluate NAFLD.
CONSENT
As per international standard or university standard, patient’s written consent has been collected and preserved by the authors.
ETHICAL APPROVAL
Informed consent obtained from all patients participating in the study along with approval from institutional ethical committee.
COMPETING INTERESTS
Authors have declared that no competing interests exist.
REFERENCES
1. Armstrong MJ, Houlihan DD, Bentham L,
Shaw JC, Cramb R, et al. Presence and severity of non-alcoholic fatty liver disease in a large prospective primary care cohort. J. Hepatol. 2012;56:234–240.
2. Ophir J, Céspedes I, Ponnekanti H, Yazdi
Yetal. Elastography: A quantitative method for imaging the elasticity of biological tissues. Ultrasonic Imaging. 1991;13(2): 111-134.
3. Sandrin L, Fourquet B, Hasquenoph JM,
Yon S, Fournier C, Mal F. Transient elastography: A new noninvasive method
for assessment of hepatic fibrosis.
Ultrasound Med Biol. 2003;29:1705–1713.
4. Liu H, Fu J, Hong R, Liu L, Li F. Acoustic
radiation force impulse elastography for the non-invasive evaluation of hepatic fibrosis in non-alcoholic fatty liver disease patients: A systematic review &
meta-analysis. PLoS ONE. 2015;10(7):
e0127782:1-10.
5. Huwart L, Salameh N, terBeek LC, et al.
MR elastography of liver fibrosis:
Preliminary results comparing spin-echo
and echo-planar imaging. European
Radiology. 2008;18:2535–2541.
6. Roldan-Valadez E, Favila R,
Martínez-López M, Uribe M, Ríos C, et al. In vivo 3T
spectroscopic quantification of liver fat content in nonalcoholic fatty liver disease: Correlation with biochemical method and morphometry. J Hepatol. 2010;53(4):732-7.
7. Raptis DA, Fischer MA, Graf R, et al.
Magnetic resonance spectroscopy to
measure hepatic triglyceride content: prevalence of hepatic steatosis in the general population. J Magn Reson Imaging. 2012;47(6):368–75.
8. Browning JD, Szczepaniak LS, Dobbins R,
et al. Prevalence of hepatic steatosis in an urban population in the United States:
Impact of ethnicity. Hepatology. 2004;
40:1387–1395.
9. Wong VW, Chu WC, Wong GL, Chan RS,
Chim AM, Ong A. Prevalence of non-alcoholic fatty liver disease and advanced fibrosis in Hong Kong Chinese: A population study using proton-magnetic resonance spectroscopy and transient elastography. Gut. 2012;61:409–415.
10. Loomba R, Sirlin CB, Ang B, Bettencourt
R, Jain R, et al. For the treatment of non-alcoholic steatohepatitis: Assessment by novel magnetic resonance imaging and magnetic resonance elastography in a
randomized trial (MOZART trial)
Hepatology. 2015;61:1239–1250.
11. Wood J.C. Magnetic resonance imaging
measurement of iron overload.
12. Chandarana H, Lim RP, Jensen JH, Hajdu CH, Losada M, Babb JS. Hepatic iron deposition in patients with liver disease: Preliminary experience with breath-hold multiecho T2-weighted sequence. Am J Roentgenol. 2009;193:1261–1267.
13. Banerjee R, Pavlides M, Tunnicliffe EM,
Piechnik SK, Sarania N, Philips R. Multiparametric magnetic resonance for
the non-invasive diagnosis of liver
disease. J Hepatol. 2014;60:69–77.
14. Ichikawa S, Motosugi U, Morisaka H, Sano
K, Ichikawa T, Tatsumi A. Comparison of the diagnostic accuracies of magnetic resonance elastography and transient elastography for hepatic fibrosis. Magn Reson Imaging. 2015;33:26–30.
15. Sporea I, Șirli R, Mare R, Popescu A,
Ivașcu SC. Feasibility of transient
elastography with M and XL probes in real life. Med Ultrason. 2016;18:7–10.
_________________________________________________________________________________
© 2017 Kapur et al.; This is an Open Access article distributed under the terms of the Creative Commons Attribution License
(http://creativecommons.org/licenses/by/4.0), which permits unrestricted use, distribution, and reproduction in any medium,
provided the original work is properly cited.
Peer-review history: