Cancer Management and Research 2018:10 4145–4153
Cancer Management and Research
Dove
press
submit your manuscript | www.dovepress.com 4145
O R i g i n a l R e s e a R C h
open access to scientific and medical research
Open Access Full Text Article
a novel gene-pair signature for relapse-free
survival prediction in colon cancer
Peng-fei Chen1–3,*
Fan Wang1,2,*
Zi-xiong Zhang4,*
Jia-yan nie1,2
lan liu1,2
Jue-rong Feng1,2
Rui Zhou1,2
hong-ling Wang1,2
Jing liu1,2
Qiu Zhao1,2
1Department of gastroenterology, Zhongnan hospital of Wuhan University, Wuhan 430071, China; 2hubei Clinical Center & Key lab of intestinal & Colorectal Diseases, Wuhan 430071, China; 3Department of gastroenterology, The Central hospital of enshi autonomous Prefecture, enshi 445000, China; 4Department of Otolaryngology, The Central hospital of enshi autonomous Prefecture, enshi 445000, China
*These authors contributed equally to this work
Background: Colon cancer (CC) patients with early relapse usually have a poor prognosis. In this study, we aimed to identify a novel signature to improve the prediction of relapse-free survival (RFS) in CC.
Methods: Four microarray datasets were merged into a training set (n=1,045), and one
RNA-sequencing dataset was used as a validation set (n=384). In the training set, microarray
meta-analysis screened out 596 common RFS-related genes across datasets, which were used to construct 177,310 gene pairs. Then, the LASSO penalized generalized linear model identified 16 RFS-related gene pairs, and a risk score was calculated for each sample according to the model coefficients.
Results: The risk score demonstrated a good ability in predicting RFS (area under the curve [AUC] at 5 years: 0.724; concordance index [C-index]: 0.642, 95% CI: 0.615–0.669). High-risk patients showed a poorer prognosis than low-risk patients (HR: 3.519, 95% CI: 2.870–4.314). Subgroup analysis reached consistent results when considering multiple confounders. In the validation set, the risk score had a similar performance (AUC at 5 years: 0.697; C-index: 0.696, 95% CI: 0.627–0.766; HR: 2.926, 95% CI: 1.892–4.527). When compared with a 13-gene
sig-nature, a 15-gene sigsig-nature, and TNM stage, the score showed a better performance (P<0.0001;
P=0.0004; P=0.0125), especially for the patients with a longer follow-up (R2=0.988, P<0.0001).
When the follow-up was >5 years (n=314), the score demonstrated an excellent performance
(C-index: 0.869, 95% CI: 0.816–0.922; HR: 13.55, 95% CI: 7.409–24.78).
Conclusion: Our study identified a novel gene-pair signature for prediction of RFS in CC.
Keywords:colon cancer, relapse-free survival, gene pair, prognosis
Introduction
Colorectal cancer (CRC) is one of the most common cancers worldwide, with an
estimated 1.4 million new cases and 693,900 deaths per year.1 Despite great
improve-ments in curative resection and adjuvant chemotherapy, the relapse rate remains high.
Approximately 40–50% of patients relapse within the first year after initial resection.2
The TNM staging system is widely used in relapse prediction.3 A higher TNM stage
is usually associated with a higher relapse rate and shorter interval. However, this is controversial among a proportion of patients. Stage IIb patients tend to have a higher
relapse rate than those with stage IIIa.4 Thus, in clinical practice, there is a critical
need to improve the prediction of relapse in colon cancer (CC).
With the development of high-throughput gene detection technology, gene expression profiles became available to identify more reliable molecular subtypes, Correspondence: Qiu Zhao; Jing liu
Department of gastroenterology, Zhongnan hospital of Wuhan University, 169 east lake Road, Wuhan 430071, Wuchang District, China
email zhaoqiuwhu@163.com; liujing81@ hotmail.com
Journal name: Cancer Management and Research Article Designation: Original Research Year: 2018
Volume: 10
Running head verso: Chen et al
Running head recto: A novel gene-pair signature for relapse-free survival prediction in CC DOI: http://dx.doi.org/10.2147/CMAR.S176260
Cancer Management and Research downloaded from https://www.dovepress.com/ by 118.70.13.36 on 20-Aug-2020
For personal use only.
Dovepress
Chen et al
and diagnostic and prognostic molecular signatures in multiple diseases. In 2013, Marisa et al classified CC into six molecular subtypes (C1–C6) by clustering gene expres-sion data of 433 samples and found that the subtypes of C4 and C6 were associated with shorter relapse-free survival
(RFS).5 In 2015, Guinney et al coalesced six CRC
subtyp-ing algorithms (includsubtyp-ing those from Marisa et al5) into four
consensus molecular subtypes (CMSs) with distinguishing features: CMS1 (microsatellite instability immune), CMS2
(canonical), CMS3 (metabolic), and CMS4 (mesenchymal).6
CMS4 tumors displayed worse overall survival and RFS. Alderdice et al compared the CRC transcriptional signatures of CMSs and colorectal cancer intrinsic subtypes (CRISs), and found that CRISs provided a better classification of
molecular subtypes than CMSs.7 More reliable molecular
subtyping system will be detected in large-scale prospective designed studies.
Several studies have also proposed gene-expression-based
prognostic signatures in CRC.8–11 However, those signatures
are limited in sample size and sufficient cross-validation. In this study, we adopted a method based on relative ranking of gene expression levels, which could integrate samples from different datasets without the need for eliminating
batch effects.12–14 Thus, we reached a large sample size and
developed and validated a novel gene-pair signature for RFS prediction in CC.
Materials and methods
Data collection
The Gene Expression Omnibus (GEO) and European Bioin-formatics Institute (EMBL-EBI) databases were searched for related microarray datasets from inception to April 1, 2018. A dataset was included if it fulfilled the following criteria: 1) it focused on gene expression profiles of CC tissues; 2) it was based on the chip platform of Affymetrix Human Genome U133 Plus 2.0 Array (GPL570); 3) the follow-up duration and RFS status (RFS was defined as the time from surgery to the first confirmed relapse) were available; and 4) the
sample size was >50. Normalized gene expression profiles
from the GEO database were downloaded as the training set, while RNA-sequencing data from The Cancer Genome Atlas (TCGA) database (TCGA Colon Cancer [COAD]) was selected as the validation set.
Data quality control
Microarray quality was assessed by sample clustering accord-ing to the distance between different samples in Pearson’s correlation matrices. A height cut-off of 0.2 was chosen to
identify potential microarray outliers, which were removed
from the subsequent analysis.15
RFs-related gene screening
To screen out the common RFS-related genes between datas-ets, microarray meta-analysis was conducted on the included datasets using R software and the MetaOmics package. In survival analysis, we took the log-rank test and permutation
method (n=300) for an individual dataset, and then both
Fisher and maxP methods were adopted to combine the
P-values between datasets. A P-value <0.05 by both methods
was considered statistically significant for the RFS-related probes, which were subsequently converted to gene symbols using the Affymetrix annotation files.
Development of gene-pair signature
The expression level of RFS-related genes in a specific sample underwent pairwise comparison to generate a score for each gene pair. If the first gene of one gene pair had a higher expression level than the second one, a gene pair score of 1 was assigned; otherwise, the gene pair score was 0. The profile of gene-pair scores was used to build the signature. To minimize the risk of over-fitting, we used a Cox propor-tional hazards regression model combined with the least absolute shrinkage and selection criteria operator (R glmnet package). The penalty parameter was estimated by 10-fold cross-validation at 1 standard error beyond the minimum partial likelihood deviance.
signature evaluation and validation
The coefficients of significant gene pairs in the model were extracted to calculate a risk score for each sample. The concordance index (C-index) was used to assess the performance of the risk scores in RFS prediction. Then, the nearest neighbor estimation method was adopted to estimate the time-dependent receiver operating characteristics (ROC) curve of the risk scores (R survcomp package). The area under the ROC curve (AUC) was also used to assess the predictive ability of the signature risk score. The score cor-responding to the shortest distance between the ROC curve and the point of 100% true positive and 0% false positive was selected as the cut-off value. The patients were divided into high- and low-risk groups according to the cut-off. Survival difference between the groups was assessed by the Kaplan–Meier estimate and compared using the log-rank test (R survival package). To validate the signature, we used the same methods in the RNA-sequencing dataset. Furthermore, univariate and multivariate Cox regression survival analyses were conducted on the risk score.
Cancer Management and Research downloaded from https://www.dovepress.com/ by 118.70.13.36 on 20-Aug-2020
Dovepress a novel gene-pair signature for relapse-free survival prediction in CC
Figure 1 sample clustering to detect outliers.
GSE14333
0.16
0.10
0.04
Height
0.12
0.06
0.00
0.00
0.10
Height
Height
0.16
0.10
0.04
Height
GSE38832
GSE17538
GSE40967
Figure 2 Number distribution of significant probes by different methods.
3500
3000 800
600
400
200
0
0 0.001
Fisher MaxP Overlap
Number of probes
0.005 P value cutoff
0.01 0.05
Functional enrichment analysis
To identify potential biological pathways related to the signa-ture, gene set enrichment analysis (GSEA) was performed to detect whether a series of a priori defined biological pathways was enriched in the gene rank derived from differentially expressed genes between high- and low-risk groups. In addition, the gene-pair signature consisted of single genes, and gene ontology (GO) analysis was conducted on these genes to identify potential mechanism associated with the
signature. A false discovery rate of <0.05 was chosen as the
cut-off criterion.
statistical analysis
All statistical analyses were performed using R 3.3.2 software. For use with GSEA software, the collection of annotated gene sets of c2.cp.kegg.v5.2.symbols.gmt in the Molecular Signatures Database was chosen as the refer-ence gene sets. GO analysis was conducted with the online
tool ToppGene (https://toppgene.cchmc.org/). A two-sided
P-value <0.05 was considered statistically significant.
Results
Characteristics of included datasets
Three datasets (GSE17536, GSE17537, and GSE39582) were excluded owing to duplication, while one dataset (GSE33113) was excluded owing to incomplete expres-sion data. Thirty cases of rectal cancer were excluded in
GSE14333. Finally, four datasets (GSE14333 [n=196],
GSE17538 [n=200], GSE38832 [n=92], and GSE40967
[n=557]) were included, with a total number of 1,045 patients.
Those patients had a mean follow-up of 46.2 (0–201) months and a relapse rate of 37.7% (394/1,045). The validation set had a total of 384 patients, with a mean follow-up of 29.7 (0.2–150.1) months and a relapse rate of 20.1% (81/384). No samples were detected as outliers in the datasets (Figure 1).
signature construction, evaluation, and
validation
In microarray meta-analysis, 647 probes were significant
(P<0.05) in both Fisher and maxP methods (Figure 2). These
647 probes could be mapped to 596 genes and constructed 177,310 gene pairs. The LASSO penalized generalized linear model identified 16 significant gene pairs (consisting of 24 genes) (Table 1). Then, a risk score was calculated for each sample according to the model coefficients as follows:
Risk score = ScoreCYP1B1 LIPE * 0.016 + ScoreCYP1B1 GOLGA2P10 *
0.027 + ScoreSCG2 FOXP3 * 0.283 + ScoreSCG2 MED26 * (–0.208)
+ ScoreSCG2 LYPD5 * 0.234 + ScoreACADSB SDHAF1 * 0.350 +
ScoreACADSB SLC25A19 * 0.042 + ScoreMATN3 R3HDML * (–0.209)
+ ScoreRGL2 SLC25A28 * 0.223 + ScoreRGL2 TMEM201 * 0.409 +
ScoreGRB10 GOLGA2P10 * 0.280 + ScoreMAP1B SLC25A22 * 0.334
+ ScoreETS1 MED26 * 0.507 + ScoreWFDC1 HOOK3 * (–0.418) +
ScoreGOLGA2P10 ANGPT2 * 0.088 + ScoreTCF21 ISM1 * (–0.059)
The time-dependent ROC curve analysis indicated an optimal cut-off value of 1.168 for the classification of high-risk and low-high-risk groups. The high-high-risk group had an obvi-ously higher incidence of relapse in the follow-up (Figure 3).
Cancer Management and Research downloaded from https://www.dovepress.com/ by 118.70.13.36 on 20-Aug-2020
Dovepress
Chen et al
High-risk patients showed a poorer prognosis than low-risk
patients (HR: 3.519, 95% CI: 2.870–4.314; P<0.0001)
(Figure 4). In the validation dataset, high-risk patients also had a poorer prognosis (HR: 2.926, 95% CI: 1.892–4.527;
P<0.0001).
In subgroup analysis, we evaluated the effects of age, gender, tumor location, TNM stage, genetic mutation (TP53, KRAS, and BRAF), molecular subtype (C1–C6), and adju-vant chemotherapy (Table 2). The results were consistent except for stage I and C1 subtype. We think that this may contribute to the excellent prognosis after curative surgery in these two subtypes.
As a continuous variable, the risk score showed a com-parative ability in predicting RFS (AUC at 5 years: 0.724; C-index: 0.642, 95% CI: 0.615–0.669) (Figure 5). In the validation dataset, it had a similar performance (AUC at 5 years: 0.697; C-index: 0.696, 95% CI: 0.627–0.766). In multivariate Cox regression analysis, the risk score also showed a significant association with RFS (HR: 2.416, 95%
CI: 1.824–3.198; P<0.001) (Table 3).
Comparison with other signatures
To further investigate the predictive power of the risk score, we compared it with a 13-gene signature, a 15-gene signature, and TNM stage. The risk score in the 13-gene signature and 15-gene signature was calculated according to
the coefficients provided by the primary studies.8,9 In ROC
curve analysis, our signature showed a better predictive ability (AUC at 5 years: 0.724) than the 13-gene signature, 15-signature, and TNM stage (AUC at 5 years: 0.575, 0.509
and 0.703, respectively) (Figure 5). Then, we calculated the C-indices according to minimum follow-up duration. We found that in the patients with a longer follow-up, the risk score showed a better performance in RFS prediction
(R2=0.988, P<0.0001) (Figure 6). In those with a follow-up
of >5 years, the C-index was up to 0.869 (95% CI: 0.816–
0.922), and high-risk patients had a significantly poorer prognosis (HR: 13.55, 95% CI: 7.409–24.78) ( Figure 7). In comparison, our signature had a higher C-index than the
13-gene signature (P for paired t-test <0.0001), 15-gene
signature (P=0.0004), and TNM stage (P for paired t-test
=0.0125). Graphically, our signature also had better
astrin-gency and stability. Table 1 gene-pair signature information
Gene-pair 1 Probe Gene-pair 2 Probe Coefficient
CYP1B1 (cytochrome P450 family 1 subfamily B member 1) 202435_s_at LIPE (lipase e, hormone-sensitive type) 208186_s_at 0.016
CYP1B1 (cytochrome P450 family 1 subfamily B member 1) 202435_s_at GOLGA2P10 (golgin a2 pseudogene 10) 223327_x_at 0.027
SCG2 (secretogranin ii) 204035_at FOXP3 (forkhead box P3) 224211_at 0.283
SCG2 (secretogranin ii) 204035_at MED26 (mediator complex subunit 26) 231724_at –0.208
SCG2 (secretogranin ii) 204035_at LYPD5 (lY6/PlaUR domain containing 5) 236039_at 0.234
ACADSB (acyl-Coa dehydrogenase, short/branched chain) 205355_at SDHAF1 (succinate dehydrogenase complex assembly factor 1)
221855_at 0.350
ACADSB (acyl-Coa dehydrogenase, short/branched chain) 205355_at SLC25A19 (solute carrier family 25 member 19) 223222_at 0.042
MATN3 (matrilin 3) 206091_at R3HDML (R3h domain containing like) 234774_at –0.209
RGL2 (ral guanine nucleotide dissociation stimulator like 2) 209110_s_at SLC25A28 (solute carrier family 25 member 28) 221432_s_at 0.223
RGL2 (ral guanine nucleotide dissociation stimulator like 2) 209110_s_at TMEM201 (transmembrane protein 201) 227617_at 0.409
GRB10 (growth factor receptor bound protein 10) 210999_s_at GOLGA2P10 (golgin a2 pseudogene 10) 223327_x_at 0.280
MAP1B (microtubule associated protein 1B) 212233_at SLC25A22 (solute carrier family 25 member 22) 218725_at 0.334
ETS1 (eTs proto-oncogene 1, transcription factor) 214447_at MED26 (mediator complex subunit 26) 231724_at 0.507
WFDC1 (WAP four-disulfide core domain 1) 219478_at HOOK3 (hook microtubule tethering protein 3) 226395_at –0.418
GOLGA2P10 (golgin a2 pseudogene 10) 223327_x_at ANGPT2 (angiopoietin 2) 236034_at 0.088
TCF21 (transcription factor 21) 229529_at ISM1 (isthmin 1) 235182_at –0.059
Figure 3 Distribution of relapse-free survival status and risk scores of the gene-pair signature.
200
150
100
0
0 1
Risk score
Relapse free Relapse Low risk High risk
2
50
Ti
me (months
)
Cancer Management and Research downloaded from https://www.dovepress.com/ by 118.70.13.36 on 20-Aug-2020
Dovepress a novel gene-pair signature for relapse-free survival prediction in CC
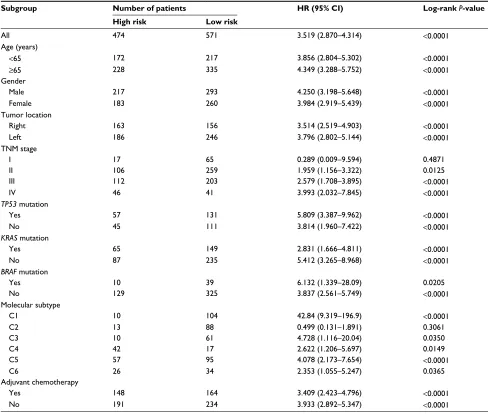
Table 2 subgroup analysis for the hRs between high- and low-risk groups divided by the gene-pair signature
Subgroup Number of patients HR (95% CI) Log-rank P-value
High risk Low risk
all 474 571 3.519 (2.870–4.314) <0.0001
age (years)
<65 172 217 3.856 (2.804–5.302) <0.0001
≥65 228 335 4.349 (3.288–5.752) <0.0001
gender
Male 217 293 4.250 (3.198–5.648) <0.0001
Female 183 260 3.984 (2.919–5.439) <0.0001
Tumor location
Right 163 156 3.514 (2.519–4.903) <0.0001
left 186 246 3.796 (2.802–5.144) <0.0001
TnM stage
i 17 65 0.289 (0.009–9.594) 0.4871
ii 106 259 1.959 (1.156–3.322) 0.0125
iii 112 203 2.579 (1.708–3.895) <0.0001
iV 46 41 3.993 (2.032–7.845) <0.0001
TP53 mutation
Yes 57 131 5.809 (3.387–9.962) <0.0001
no 45 111 3.814 (1.960–7.422) <0.0001
KRAS mutation
Yes 65 149 2.831 (1.666–4.811) <0.0001
no 87 235 5.412 (3.265–8.968) <0.0001
BRAF mutation
Yes 10 39 6.132 (1.339–28.09) 0.0205
no 129 325 3.837 (2.561–5.749) <0.0001
Molecular subtype
C1 10 104 42.84 (9.319–196.9) <0.0001
C2 13 88 0.499 (0.131–1.891) 0.3061
C3 10 61 4.728 (1.116–20.04) 0.0350
C4 42 17 2.622 (1.206–5.697) 0.0149
C5 57 95 4.078 (2.173–7.654) <0.0001
C6 26 34 2.353 (1.055–5.247) 0.0365
adjuvant chemotherapy
Yes 148 164 3.409 (2.423–4.796) <0.0001
no 191 234 3.933 (2.892–5.347) <0.0001
Figure 4 Kaplan–Meier curves of RFs in the training and validation sets. Abbreviation: RFs, relapse-free survival.
100
80
60
40
20
0
0 50 100
Time (months) Time (months)
RFS (%
)
Training set Validation set
Low risk (n=571)
High risk (n=474)
Low risk (n=179)
High risk (n=205)
P <0.0001
HR: 3.519, 95% CI: 2.870–4.314 C-index: 0.642, 95% CI: 0.615–0.669
P <0.0001
HR: 2.926, 95% CI: 1.892–4.527 C-index: 0.696, 95% CI: 0.627–0.766
200 150
100
80
60
40
20
0
0 50 100
RFS (%
)
150
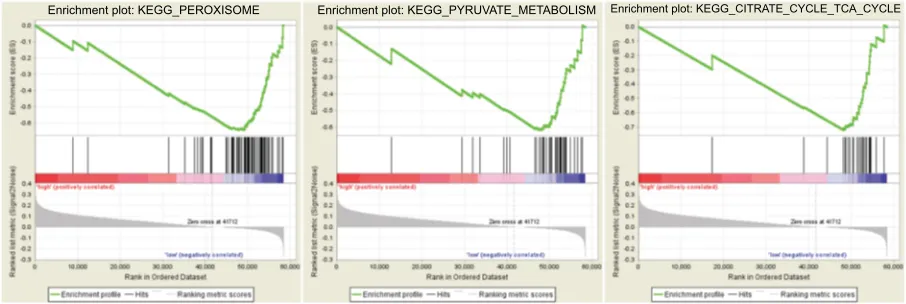
Biological pathways associated with the
gene-pair signature
In the validation set, 374 patients were divided into high- and low-risk groups according to the risk score. Three KEGG pathway-related gene sets were enriched in the low-risk group,
namely “peroxisome”, “pyruvate metabolism”, and “citrate cycle (TCA cycle)” (where TCA is tricarboxylic acid) (Figure 8). In GO analysis of the 24 genes comprising the signature, these genes were associated with multiple biological processes, such as angiogenesis, endothelial cell migration, and T-cell toleration.
Cancer Management and Research downloaded from https://www.dovepress.com/ by 118.70.13.36 on 20-Aug-2020
Dovepress
Chen et al
Discussion
Tumor relapse within the first year after initial resection occurred in almost 50% patients, which was closely related to survival outcomes. Currently, the TNM staging system
is widely used to predict RFS. However, CRC patients with the same stage and treatment varied considerably in the RFS prediction, which may be caused by the genetic differences
between individuals.16 Thus, genomic biomarkers for relapse
Figure 5 Time-dependent ROC curve analysis.
Abbreviations: ROC, receiver operating characteristics; aUC, area under the curve.
Time-dependent ROC curve
Gene-pair signature
False positive
AUC at 1 year 0.576 AUC at 3 year 0.633 AUC at 5 year 0.724 1.00
0.75
0.50
Tr
ue positiv
e
0.25
0.00
0.00 0.25 0.50 0.75 1.00
Time-dependent ROC curve
13-gene
False positive
AUC at 1 year 0.533 AUC at 3 year 0.588 AUC at 5 year 0.575 1.00
0.75
0.50
Tr
ue positiv
e
0.25
0.00
0.00 0.25 0.50 0.75 1.00
Time-dependent ROC curve
15-gene
False positive
AUC at 1 year 0.526 AUC at 3 year 0.55 AUC at 5 year 0.509 1.00
0.75
0.50
Tr
ue positiv
e
0.25
0.00
0.00 0.25 0.50 0.75 1.00
Time-dependent ROC curve
TNM stage
False positive
AUC at 1 year 0.753 AUC at 3 year 0.72 AUC at 5 year 0.703 1.00
0.75
0.50
Tr
ue positiv
e
0.25
0.00
0.00 0.25 0.50 0.75 1.00
Table 3 Univariate and multivariate Cox regression analyses in colon cancer
Variable Univariate analysis Multivariate analysis
HR (95% CI) P-value HR (95% CI) P-value
age 1.001 (0.993–1.009) 0.854 1.006 (0.992–1.019) 0.411
gender 1.066 (0.872–1.303) 0.530 1.412 (1.022–1.951) 0.036
Tumor location 1.083 (0.870–1.347) 0.477 0.763 (0.547–1.062) 0.109
TnM stage 2.847 (2.378–3.408) 0.000 2.093 (1.623–2.701) 0.000
adjuvant chemotherapy 1.220 (0.978–1.523) 0.079 1.057 (0.738–1.513) 0.762
Risk score 2.719 (2.320–3.185) 0.000 2.416 (1.824–3.198) 0.000
Cancer Management and Research downloaded from https://www.dovepress.com/ by 118.70.13.36 on 20-Aug-2020
Dovepress a novel gene-pair signature for relapse-free survival prediction in CC
detection could make up for the deficiency of TNM classi-fication, and thereby identify high-risk patients to improve
personalized cancer care at an earlier stage.17,18
With the development of gene microarray and sequencing technologies, we are faced with a large amount of biological data. Genome and transcriptome information is available in more and more samples, prompting a search for new biomark-ers for the discrimination of high-risk individuals in disease diagnosis or prognosis. A genomic signature is a biomarker in which the genomic data are combined in a defined manner to provide either a continuous score or a categorical classifier for clinical decision-making.
Several CRC prognostic signatures have been reported using the public microarray data from the GEO database. In
Figure 6 C-indices according to minimum follow-up duration. Note: Dashed line: 95% Ci.
Abbreviation: C-index, concordance index.
1.0
0.8
0.6
0.4
0.2
0.0
0 1 3
Minimum follow-up duration (years) Gene-pair signature
C-index
2 4 5 6
1.0
0.8
0.6
0.4
0.2
0.0
0 1 3
Minimum follow-up duration (years) 13-gene signature
C-inde
x
2 4 5 6
1.0
0.8
0.6
0.4
0.2
0.0
0 1 3
Minimum follow-up duration (years) 15-gene signature
C-inde
x
2 4 5 6
1.0
0.8
0.6
0.4
0.2
0.0
0 1 3
Minimum follow-up duration (years) TNM signature
C-index
2 4 5 6
Figure 7 Kaplan–Meier curves of relapse-free survival in patients with a follow-up of >5 years.
Abbreviations: C-index, concordance index; RFs, relapse-free survival.
100
80
60
40
20
0
60 90 120
Time (months)
Low risk (n=210)
High risk (n=104) P <0.0001
HR: 13.55, 95% CI: 7.409–24.78 C-index: 0.869, 95% CI: 0.816–0.922
RFS (%
)
150 180
Cancer Management and Research downloaded from https://www.dovepress.com/ by 118.70.13.36 on 20-Aug-2020
Dovepress
Chen et al
the study by Dai et al, the dataset GSE39582 was used to iden-tify a 15-mRNA signature as an early relapse classifier in CC, which was validated in the datasets of GSE14333, GSE17538,
GSE33113, and GSE37892.8 Tian et al used GSE17536 to
build a 13-mRNA signature for RFS prediction in CRC and
validated it in GSE14333 and GSE33113.9 Among these three
signatures, only one gene, SCG2, overlapped between the
gene-pair signature and 13-gene signature, which has been
reported in multiple cancers.19–21 This may have contributed
to the limited sample size and subsequent selection bias, and a systematic method was needed to identify the prognostic genes. In addition, no signatures based on the microarray data were validated in the RNA-sequencing data, and this may affect their further application in clinical practice.
In this study, we constructed an RFS-related signature consisting of 16 gene pairs using a penalized Cox propor-tional hazards regression model. With specific coefficients, a risk score was calculated for each patient based on the gene expression profile, and this could be used without considering batch effects. Thus, we achieved a large sample size which also helped us to identify a robust signature, which showed a better performance than other single-gene signatures, espe-cially among the patients with a longer follow-up. A study by Tauriello et al used a k-top scoring pair (k-TSP) approach to classify CRCs between CMS4 and CMS1–3. It also adopted
the method of gene pairs and had a good performance.22 In our
study, CMS information was unavailable, but C1–C6 subtyp-ing information was available. High-risk individuals in our signature had a poor prognosis in C2–C6, indicating a signature stability of different molecular subtypes across patients.
To investigate the potential mechanism associated with the signature, GSEA and GO analyses were conducted. Three gene sets were significantly enriched in low-risk patients. The role of the peroxisome pathway in cancer is controversial. Its inactivation leads to metabolic stress, mTOR inhibition, and
lethality in liver cancer cells.23 However, it protects lymphoma
cells from histone deacetylase inhibitor-mediated apoptosis.24
Fransen et al present potential therapeutic opportunities for
targeting the TCA cycle in cancer cells.25 Moreover, in GO
analysis, 24 genes in the signature were associated with mul-tiple biological processes, including angiogenesis, endothelial cell migration, and T-cell toleration, which have been reported
in tumor carcinogenesis, progression, and metastasis.26–28
Several limitations to our study should be acknowledged. First, this was a retrospective study, rather than a prospective cohort study. Second, in the training set, we considered the microarray data based only on GLP570 and ignored other unusual platforms, which may have led to selection bias. Third, we ignored batch effects caused by other confound-ers, such as genetic background and environmental factors, which may have affected the model coefficients and cut-off value.
Conclusion
Our study identified a novel gene-pair signature for RFS prediction in CC.
Acknowlegment
This study was supported by the Natural Science Foundation of Hubei Province (QZ, No. 2016CFA101).
Disclosure
The authors report no conflicts of interest in this work.
References
1. Torre LA, Siegel RL, Ward EM, Jemal A. Global Cancer Incidence and Mortality Rates and Trends--An Update. Cancer Epidemiol Biomarkers Prev. 2016;25(1):16–27.
2. Seo SI, Lim SB, Yoon YS, et al. Comparison of recurrence patterns between ≤5 years and >5 years after curative operations in colorectal cancer patients. J Surg Oncol. 2013;108(1):9–13.
Figure 8 gene set enrichment analysis.
Enrichment plot: KEGG_PEROXISOME Enrichment plot: KEGG_PYRUVATE_METABOLISM Enrichment plot: KEGG_CITRATE_CYCLE_TCA_CYCLE
Cancer Management and Research downloaded from https://www.dovepress.com/ by 118.70.13.36 on 20-Aug-2020
Dovepress
Cancer Management and Research
Publish your work in this journal
Submit your manuscript here: https://www.dovepress.com/cancer-management-and-research-journal Cancer Management and Research is an international, peer-reviewed open access journal focusing on cancer research and the optimal use of preventative and integrated treatment interventions to achieve improved outcomes, enhanced survival and quality of life for the cancer patient. The manuscript management system is completely online and includes
a very quick and fair peer-review system, which is all easy to use. Visit http://www.dovepress.com/testimonials.php to read real quotes from published authors.
Dove
press
a novel gene-pair signature for relapse-free survival prediction in CC
3. Kawaguchi T, Komatsu S, Ichikawa D, et al. Comparison of prognostic compatibility between seventh AJCC/TNM of the esophagus and 14th JCGC staging systems in Siewert type II adenocarcinoma. Anticancer Res. 2013;33(8):3461–3465.
4. O’Connell JB, Maggard MA, Ko CY. Colon cancer survival rates with the new American Joint Committee on Cancer sixth edition staging.
J Natl Cancer Inst. 2004;96(19):1420–1425.
5. Marisa L, de Reyniès A, Duval A, et al. Gene expression classification of colon cancer into molecular subtypes: characterization, validation, and prognostic value. PLoS Med. 2013;10(5):e1001453.
6. Guinney J, Dienstmann R, Wang X, et al. The consensus molecular subtypes of colorectal cancer. Nat Med. 2015;21(11):1350–1356. 7. Alderdice M, Richman SD, Gollins S, et al. Prospective patient
stratifi-cation into robust cancer-cell intrinsic subtypes from colorectal cancer biopsies. J Pathol. 2018;245(1):19–28.
8. Dai W, Li Y, Mo S, et al. A robust gene signature for the prediction of early relapse in stage I-III colon cancer. Mol Oncol. 2018;12(4):463–475. 9. Tian X, Zhu X, Yan T, et al. Recurrence-associated gene signature
optimizes recurrence-free survival prediction of colorectal cancer. Mol Oncol. 2017;11(11):1544–1560.
10. Xiong Y, Wang R, Peng L, et al. An integrated lncRNA, microRNA and mRNA signature to improve prognosis prediction of colorectal cancer.
Oncotarget. 2017;8(49):85463–85478.
11. Alajez NM. Large-Scale Analysis of Gene Expression Data Reveals a Novel Gene Expression Signature Associated with Colorectal Cancer Distant Recurrence. PLoS One. 2016;11(12):e0167455.
12. Li B, Cui Y, Diehn M, Li R. Development and Validation of an Indi-vidualized Immune Prognostic Signature in Early-Stage Nonsquamous Non-Small Cell Lung Cancer. JAMA Oncol. 2017;3(11):1529–1537. 13. Peng PL, Zhou XY, Yi GD, Chen PF, Wang F, Dong WG. Identification
of a novel gene pairs signature in the prognosis of gastric cancer. Cancer Med. 2018;7(2):344–350.
14. Han LO, Li XY, Cao MM, Cao Y, Zhou LH. Development and valida-tion of an individualized diagnostic signature in thyroid cancer. Cancer Med. 2018;7(4):1135–1140.
15. Wang F, Chang Y, Li J, et al. Strong correlation between ASPM gene expression and HCV cirrhosis progression identified by co-expression analysis. Dig Liver Dis. 2017;49(1):70–76.
16. Bathe OF, Farshidfar F. From genotype to functional phenotype: unraveling the metabolomic features of colorectal cancer. Genes. 2014;5(3):536–560.
17. Cho WC. MicroRNAs: potential biomarkers for cancer diagno-sis, prognosis and targets for therapy. Int J Biochem Cell Biol. 2010;42(8):1273–1281.
18. Tsai HL, Yang IP, Huang CW, et al. Clinical significance of microRNA-148a in patients with early relapse of stage II stage and III colorectal cancer after curative resection. Transl Res. 2013;162(4):258–268. 19. Thompson EM, Keir ST, Venkatraman T, et al. The role of angiogenesis
in Group 3 medulloblastoma pathogenesis and survival. Neuro Oncol. 2017;19(9):1217–1227.
20. Sun L, Liu M, Sun GC, et al. Notch Signaling Activation in Cervical Cancer Cells Induces Cell Growth Arrest with the Involvement of the Nuclear Receptor NR4A2. J Cancer. 2016;7(11):1388–1395. 21. Ishii J, Yazawa T, Chiba T, et al. PROX1 Promotes Secretory
Gran-ule Formation in Medullary Thyroid Cancer Cells. Endocrinology. 2016;157(3):1289–1298.
22. Tauriello DVF, Palomo-Ponce S, Stork D, et al. TGFβ drives immune evasion in genetically reconstituted colon cancer metastasis. Nature. 2018;554(7693):538–543.
23. Cai M, Sun X, Wang W, et al. Disruption of peroxisome function leads to metabolic stress, mTOR inhibition, and lethality in liver cancer cells.
Cancer Lett. 2018;421:82–93.
24. Dahabieh MS, Ha Z, Di Pietro E, et al. Peroxisomes protect lymphoma cells from HDAC inhibitor-mediated apoptosis. Cell Death Differ. 2017;24(11):1912–1924.
25. Fransen M, Nordgren M, Wang B, Apanasets O. Role of peroxisomes in ROS/RNS-metabolism: implications for human disease. Biochim Biophys Acta. 2012;1822(9):1363–1373.
26. Zuazo-Gaztelu I, Casanovas O. Unraveling the Role of Angiogenesis in Cancer Ecosystems. Front Oncol. 2018;8:248.
27. Li L, Li B, Chen D, et al. miR-139 and miR-200c regulate pancre-atic cancer endothelial cell migration and angiogenesis. Oncol Rep. 2015;34(1):51–58.
28. Li F, Zhang R, Li S, Liu J. IDO1: An important immunotherapy target in cancer treatment. Int Immunopharmacol. 2017;47:70–77.
Cancer Management and Research downloaded from https://www.dovepress.com/ by 118.70.13.36 on 20-Aug-2020