Clinical Ophthalmology
Dovepress
O r i g i n A L r e s e A r C h
open access to scientific and medical research
Open Access Full Text Article
Influence of cataract surgery and blood pressure
changes caused by sodium restriction on retinal
vascular diameter
Takatoshi Tano1
Yoshimune hiratsuka2
Koichi Ono1
Akira Murakami1
1Department of Ophthalmology,
Juntendo University School of Medicine, Tokyo; 2national institute
of Public Health, Tokyo, Japan
Correspondence: Takatoshi Tano Department of Ophthalmology, Juntendo University, School of Medicine, 2-1-1 Hongo, Bunkyou-ku, Tokyo, Japan 113-8421
Tel +813 6908 1606 Fax +813 6908 1606
email tanotakatoshi@canvas.ocn.ne.jp
Purpose: To investigate the impact of cataract surgery and blood pressure changes induced by one week of sodium restriction on retinal vascular diameter.
Methods: Fundus photographs of 200 patients were obtained before and one week after cataract surgery. For one week after admission, 100 patients received sodium restriction and 100 patients (ie, the control group) did not receive sodium restriction. The diameter of the retinal vessels and blood pressure were compared between the sodium restriction group and the control group. The vascular diameter was measured using an objective computer-based method.
Results: Neither group had a significant change in the diameter of the retinal vessels after cataract surgery. Although there was no significant change in retinal arterial and venular diameter in the sodium restriction group, one-week sodium restriction significantly reduced mean blood pressure. However, multiple linear regression analyses indicated that an increase in retinal arteriolar diameter was significantly associated with diabetes, hyperlipidemia, and alcohol intake.
Conclusion: Cataract surgery and blood pressure reduction induced by one week of sodium restriction resulted in no significant change in retinal arteriolar diameter.
Keywords: cataract surgery, hypertension, retinal blood vessel diameter, retinal fundus camera, sodium restriction.
Introduction
An excessive sodium intake raises blood pressure by changing arterial function and structure and by expanding intravascular volume and increasing vascular resistance.1–3
In Japan, the guidelines for hypertension treatment recommend restricting sodium intake to 6 g or less per day. However, the mean daily sodium intake of Japanese people is as high as 11 g, which makes sodium restriction for patients with hyperten-sion an important task.4 Because hypertension is a major risk factor for cerebrovascular
disorders, sodium restriction is clearly important.5
The fundus vessels are the only vessels in the human body that can be directly observed noninvasively. This permits evaluation of the retinal vessels. A retinal vascular abnormality is the most important factor in the early detection of hypertension and cerebrovascular disorders, and retinal vascular narrowing is the first fundus change caused by hypertension.6 This has been used to determine the severity of
arterioscle-rosis and hypertension. However, the evaluation is subjective, and methods for more objective measurements are unavailable. Conventional methods using visual inspection to measure the diameter of retinal vessels also tend to overlook early-stage changes. This prevents the identification of cerebrovascular disorders at an early stage.
Clinical Ophthalmology downloaded from https://www.dovepress.com/ by 118.70.13.36 on 21-Aug-2020
For personal use only.
Number of times this article has been viewed
This article was published in the following Dove Press journal: Clinical Ophthalmology
Dovepress
Tano et al
To address this problem, a method has been developed that uses computer software and digital processing to quan-tify retinal arteriolar narrowing.7–9 In this method, a
high-resolution scanner takes digitized fundus photographs, and a software program measures the diameter of retinal arterioles and venules. The software program measures with a greater accuracy and objectivity than is possible with conventional methods.
The cross-sectional Beaver Dam Eye Study used this method and demonstrated that retinal arteriolar diameter decreased by 4.0 µm with each 10 mmHg increase in mean arterial blood pressure. This indicates the potential of this method for evaluating small changes in the diameter of reti-nal vessels that are associated with blood pressure changes.7
Using the same method, the Japanese epidemiologic Funagata study showed a relationship between increases in mean blood pressure and narrowing of retinal arteriolar diameter.10
Previous epidemiologic studies have reported that age, gender, hypertension, systolic and diastolic blood pressures, diabetes mellitus, a history of smoking, total cholesterol level, body mass index (BMI), and a history of alcohol intake impact retinal vessel diameter.11,12 Some research suggests
that retinal arteriolar caliber may be narrower in people with hypertension and hyperlipidemia.11 A large retinal venular
caliber reportedly predicts the progression of retinopathy in people with diabetes. There is evidence that retinal venular caliber may be influenced by systemic inflammation.12
Many studies have shown a relationship between increased blood pressure and narrowing of retinal vascular diameter. However, only a few studies have examined the relationship between a decrease in blood pressure and a change in vascular diameter, including retinal vascular diameter.13,14
Unlike sclerotic changes, which are irreversible, the narrowing of retinal blood vessels appears to be reversible.6
At a clinical site, it is essential to know the minimum dos-ing period for antihypertensive treatment that is needed to improve narrowing of retinal vascular diameter. Predicting this dose accurately will similarly ease the burden on arterioles in the brain and kidney, and therefore may be therapeutically important.
Cataract is the leading cause of blindness worldwide, and cataract surgery is the most frequent surgical procedure in people aged 65 years or older in the Western world, including Japan.15–17 As the Japanese population ages, the prevalence
of visual impairment is projected to increase from 1.35% in 2007 to 2.0% by 2050; hence, visual impairment due to cataract is on the increase.18 Therefore, an important
chal-lenge is assessing the effect of cataract surgery on vascular
changes because the increasing elderly population is directly linked with the rise in the number of cataract patients having systemic chronic diseases, including heart disease, stroke, and diabetes. The invasiveness of cataract surgery induces the production of prostaglandins and other inflammatory cytokines. However, the relationship between these proin-flammatory markers and changes in retinal vascular diameter has not been examined.19
In the current study, patients were treated with sodium restriction for one week after admission. The impact of blood pressure changes induced by sodium restriction on retinal vascular diameter was assessed. Changes in diameter of the retinal vessels before and after cataract surgery were also examined. To our knowledge, this is the first clinical study in Japan to use computerized measurements of retinal vascular diameter.
Patients and methods
retinal assessment
The subjects were 200 patients (92 males, 108 females, mean age ± standard deviation [SD] 76.4 ± 8.0 years) admitted between January 2009 and July 2009 to the Juntendo Tokyo Koto Geriatric Medical Center for cataract surgery. None had a history of renal dysfunction or abnormal blood biochemistry. Patients with renal dysfunction, including renal failure, were excluded because they are often undergoing dialysis, strict fluid restriction, and diet therapy, ie, factors that make them unsuitable for evaluation of the effect of sodium restriction. Patients who had retinal disease, including severe diabetic retinopathy, were considered unsuitable for evaluation of retinal vessel diameter and were therefore excluded.
The control group consisted of 100 patients who all gave informed consent. Before surgery and one week after surgery, the blood pressure of each patient was measured and poste-rior pole retina-centered fundus photographs were obtained. Diameter of the retinal vessels was measured quantitatively, and changes in mean blood pressure and in diameter of the retinal vessels were evaluated. During the week of the study, the control patients received a regular diet with no sodium restriction (ie, 10 g sodium per day).
For one week after admission, the remaining 100 patients received a sodium-restricted diet of 5 g sodium per day (ie, the sodium restriction group). At admission and one week after surgery, each patient’s blood pressure was measured and posterior pole retina-centered fundus photographs were obtained. The diameter of the retinal vessels was measured quantitatively, and the extent of diffuse narrowing of the retinal vascular diameter was evaluated.
Clinical Ophthalmology downloaded from https://www.dovepress.com/ by 118.70.13.36 on 21-Aug-2020
Dovepress Blood pressure and retinal vascular diameter
All patients underwent cataract surgery of both eyes. The procedure utilized phacoemulsification and intraocular lens implantation.
A nonstereoscopic 45° nonmydriatic fundus camera (Nonmyd7, Kowa Inc, Nagoya, Japan) obtained retinal photographs of both eyes for each patient. One field was centered between the macula and optic disc. A retinal pho-tograph was ungradable if more than one arteriole or venule with a diameter greater than 40 µm could not be measured after three attempts. All retinal vessel measurements were obtained from the right eye. A trained grader graded the arteriolar and venular diameters. The grader used a standard-ized protocol with a computer-assisted method having high reproducibility.8 In these analyses, the fundus image covered
a sufficient area in a zone lying 0.5 to 1 disc diameter away from the disc margin (referred to as zone B).
Details of image preparation and grading protocols have been described previously.8,9 A digitized grid was
placed over the image and centered on the optic disc. All vessels passing completely through zone B were measured using image analysis software (Retinal Analysis, Depart-ment of Ophthalmology and Visual Sciences, University of Wisconsin, Madison, WI). The grader identified each vessel as either an arteriole or venule. The software calculated the average width from five equidistant measurements of each vessel. The average retinal arteriolar or venular diameter for each eye was calculated using the Parr–Hubbard formula. They were then summarized as the central retinal arteriolar equivalent (CRAE) or the central retinal venular equivalent (CRVE).20,21
Each subject gave informed consent at the beginning of the examination. This study was conducted in accordance with the recommendations of the Declaration of Helsinki. The Institutional Review Board at Juntendo Tokyo Koto Geriatric Medical Center (Tokyo, Japan) approved the study.
systemic assessment
Using a single mercury sphygmomanometer, the brachial systolic blood pressure (SBP) and diastolic blood pressure (DBP) were measured once at each examination with the patient in a sitting position after a five-minute rest period. Mean arterial blood pressure was calculated as (0.33 × SBP) + (0.67 × DBP).7 The 2003 World Health Organization (WHO)
guidelines were used to classify blood pressure as “normal” for an SBP of 120 mmHg or less and a DBP of 80 mmHg or less; as “high normal” for an SBP of 121 to 139 mmHg or a DBP of 81 to 89 mmHg; as “hypertension Stage I” for an SBP of 140 to 159 mmHg or a DBP of 90 to 99 mmHg; and
as “hypertension Stage II” or above for an SBP of 160 mmHg or greater and a DBP of 100 mmHg or greater.22 Hypertension
was classified in patients who were at Stage I or II or in patients who had received treatment for hypertension.
Diabetes was defined according to WHO guidelines, ie, a fasting glucose level of 126 mg/dL (7.0 mmol/L) or greater, a nonfasting glucose level of 200 mg/dL (11.1 mmol/L) or greater, or a history of or current treatment for diabetes.23
A diagnosis of hyperlipidemia was based on the diag-nostic criteria of the Japan Atherosclerosis Society and was defined as either a total cholesterol level of 220 mg/dL or greater, a low-density lipoprotein cholesterol (LDL-C) level of 140 mg/dL or greater in fasting blood samples; or a history of or current treatment for hyperlipidemia.24 In the US, the
National Cholesterol Education Program (NCEP) has defined hyperlipidemia as a total cholesterol level of 240 mg/dL or more and an LDL-C level of 160 mg/dL or more, based on the relationship between total cholesterol levels and rates of coronary death in the Multiple Risk Factor Intervention Trial.25,26 In Japan, the criteria for hyperlipidemia, ie, a total
cholesterol level of 220 mg/dL or greater and an LDL-C level of 140 mg/dL or greater, are based on an epidemiologic study (NIPPON DATA80).27
The Brinkman Index (ie, daily consumption of cigarettes × years of smoking) was used in the analysis of a patient’s smoking status.28 Based on an interview, a patient’s
alcohol intake (including consumption within the past year) was classified into one of two categories, ie, noncurrent or current intake.
A patient’s BMI was calculated as weight in kilograms divided by the square of height in meters.
statistical analysis
The extent of change in CRAE, CRVE, mean arterial blood pressure, SBP, and DBP in patients in the sodium restriction group and in patients in the control group was compared using paired t-tests. Within the sodium restriction group and the control group, the differences in the CRAE, CRVE, mean arterial blood pressure, SBP, and DBP after surgery were tested by unpaired t-tests. Simple regression analyses and multiple regression analyses were used to examine the association of the differences in CRAE and CRVE between the two groups and background factors (ie, age, gender, mean arterial blood pressure, diabetes mellitus, hyperlipidemia, Brinkman Index, alcohol intake, and BMI).
Three models were used in the multiregression analysis. In model 1, factors with significant differences in single regression analysis were added and analyzed. In model 2,
Clinical Ophthalmology downloaded from https://www.dovepress.com/ by 118.70.13.36 on 21-Aug-2020
Dovepress
Tano et al
the factors used in model 1 and the Brinkman Index (a factor showing no significant difference for retinal venular caliber in single regression analysis but with 0.05 , P , 0.10) were added and analyzed. The Brinkman Index was added to the factors used in model 1 to make the analysis for model 2 because a relationship between smoking and retinal blood vessel diameter has been reported in an earlier epidemiologic study and because a causal relationship between smoking and arterial sclerosis is already proven. In model 3, an analysis was performed for all factors. Each model included age and gender as factors. The significance level was set at P , 0.05. Because patients with hypertension were on treatment and some had normal blood pressure, the mean arterial blood pressure, rather than hypertension itself, was used in the analysis.
All data were stored at Juntendo University and analyzed using SPSS16.0 J for Windows (SPSS Inc, Chicago, IL).
Results
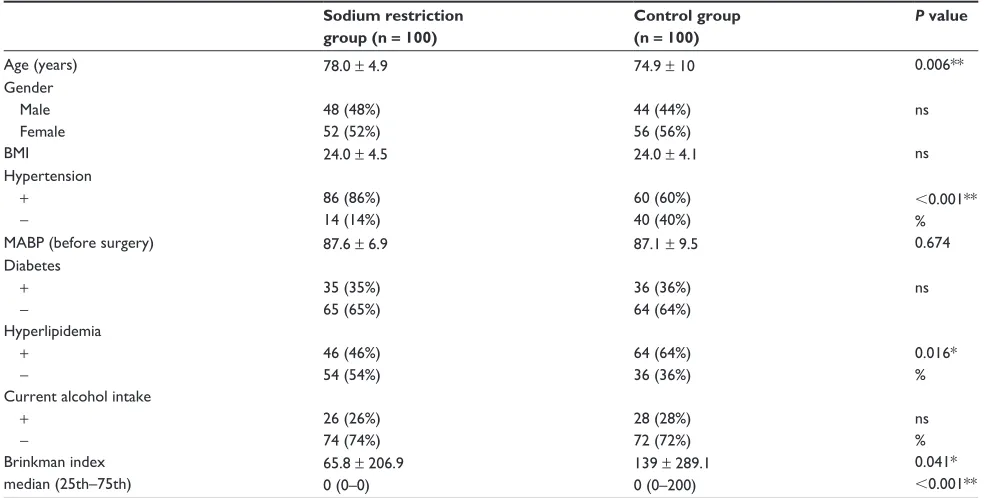
None of the patients had complications after cataract surgery. Table 1 shows the age, gender, BMI, hypertension, mean arterial blood pressure, diabetes mellitus, hyperlipidemia, Brinkman Index, and alcohol intake for patients in the sodium restriction group and in the control group (n = 100 in each group). The association between age, BMI, mean arterial blood pressure, and Brinkman Index was analyzed by an
unpaired t-test; all other characteristics were analyzed by the χ2 test. Most background factors were similar in the
two groups, but the age of the sodium restriction group (78.0 ± 4.9 years) was higher than that of the control group (74.9 ± 10 years). The rate of hypertension was also higher in the sodium restriction group. The rates of hyperlipidemia and Brinkman Index were higher in the control group.
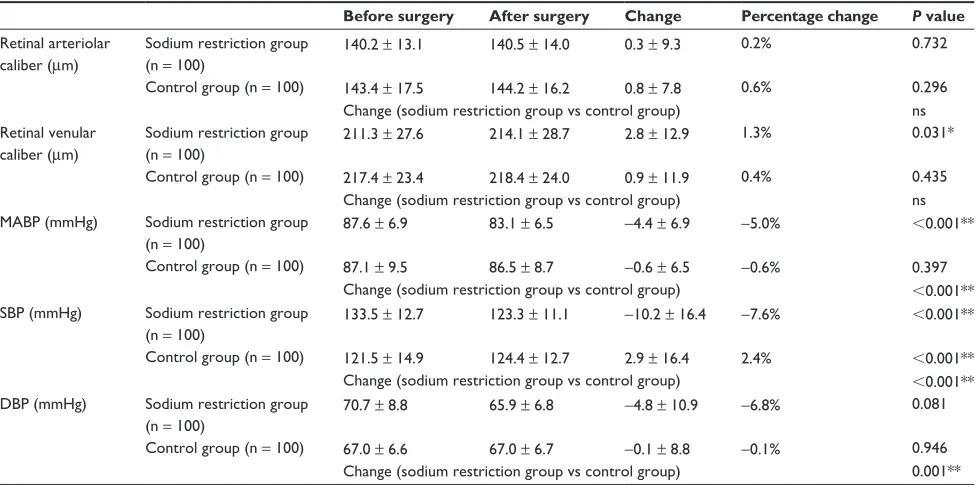
In the sodium restriction group, CRAE values before and after surgery were 140.2 ± 13.1 µm and 140.5 ± 14.0 µm, respectively; and in the control group, 143.4 ± 17.5 µm and 144.2 ± 16.2 µm, respectively. The increase in CRAE after surgery was not significant in the sodium restriction and control groups (0.3 ± 9.3 µm and 0.8 ± 7.8 µm, respectively, Table 2).
CRVE values before and after surgery were 211.3 ± 27.6 µm and 214.1 ± 28.7 µm, respectively, in the sodium restriction group, and were 217.4 ± 23.4 µm and 218.4 ± 24.0 µm, respectively, in the control group. The 2.8 ± 12.9 µm increase in CRVE after surgery in the sodium restriction group was significant. The 0.9 ± 11.9 µm increase in CRVE after surgery in the control group was not significant.
Mean arterial blood pressure before and after surgery was 87.6 ± 6.9 and 83.1 ± 6.5 mmHg, respectively, in the sodium restriction group; the −4.4 ± 6.9 mmHg decrease after surgery was significant. In the control group, the mean arterial blood pressure values before and after surgery were
Table 1 Characteristics of the sodium restriction group and the control group Sodium restriction
group (n = 100)
Control group (n = 100)
P value
Age (years) 78.0 ± 4.9 74.9 ± 10 0.006**
gender Male Female
48 (48%) 52 (52%)
44 (44%) 56 (56%)
ns
BMi 24.0 ± 4.5 24.0 ± 4.1 ns
hypertension
+ −
86 (86%) 14 (14%)
60 (60%) 40 (40%)
,0.001** %
MABP (before surgery) 87.6 ± 6.9 87.1 ± 9.5 0.674
Diabetes
+ −
35 (35%) 65 (65%)
36 (36%) 64 (64%)
ns
hyperlipidemia
+ −
46 (46%) 54 (54%)
64 (64%) 36 (36%)
0.016* % Current alcohol intake
+ −
26 (26%) 74 (74%)
28 (28%) 72 (72%)
ns % Brinkman index
median (25th–75th)
65.8 ± 206.9 0 (0–0)
139 ± 289.1 0 (0–200)
0.041*
,0.001**
Notes: Data are shown as n (%) or as the mean ± standard deviation; *P based on the unpaired t-test (for age [Welch’s t-test], BMI, MABP, and Brinkman Index), the Wilcoxon signed rank test (for the median Brinkman Index), and the χ2 test (for all characteristics, except for age, BMI, MABP, and Brinkman Index. *P, 0.05; **P, 0.01). Abbreviations: BMI, body mass index; MABP, mean arterial blood pressure; ns, not significant.
Clinical Ophthalmology downloaded from https://www.dovepress.com/ by 118.70.13.36 on 21-Aug-2020
Dovepress Blood pressure and retinal vascular diameter
Table 2 Change in blood pressure and retinal vessel caliber before and after cataract surgery in the sodium restriction group and in the control group
Before surgery After surgery Change Percentage change P value
retinal arteriolar caliber (µm)
sodium restriction group (n = 100)
Control group (n = 100)
140.2 ± 13.1
143.4 ± 17.5
140.5 ± 14.0
144.2 ± 16.2
0.3 ± 9.3
0.8 ± 7.8
0.2%
0.6%
0.732
0.296 Change (sodium restriction group vs control group) ns retinal venular
caliber (µm)
sodium restriction group (n = 100)
Control group (n = 100)
211.3 ± 27.6
217.4 ± 23.4
214.1 ± 28.7
218.4 ± 24.0
2.8 ± 12.9
0.9 ± 11.9
1.3%
0.4%
0.031*
0.435 Change (sodium restriction group vs control group) ns MABP (mmhg) sodium restriction group
(n = 100)
Control group (n = 100)
87.6 ± 6.9
87.1 ± 9.5
83.1 ± 6.5
86.5 ± 8.7
−4.4 ± 6.9
−0.6 ± 6.5
−5.0%
−0.6%
,0.001**
0.397 Change (sodium restriction group vs control group) ,0.001** sBP (mmhg) sodium restriction group
(n = 100)
Control group (n = 100)
133.5 ± 12.7
121.5 ± 14.9
123.3 ± 11.1
124.4 ± 12.7
−10.2 ± 16.4
2.9 ± 16.4
−7.6%
2.4%
,0.001**
,0.001** Change (sodium restriction group vs control group) ,0.001** DBP (mmhg) sodium restriction group
(n = 100)
Control group (n = 100)
70.7 ± 8.8
67.0 ± 6.6
65.9 ± 6.8
67.0 ± 6.7
−4.8 ± 10.9
−0.1 ± 8.8
−6.8%
−0.1%
0.081
0.946 Change (sodium restriction group vs control group) 0.001**
Notes: *P, 0.05; **P, 0.01. The before vs after cataract surgery association was analyzed by paired t-test. The sodium restriction group vs the control group association was analyzed by unpaired t-test; the amount of change was determined by the formula: change = after surgery − before surgery; percentage of change was determined by the formula: percentage change = (after surgery − before surgery) ÷ before surgery.
Abbreviations: DBP, diastolic blood pressure; MABP, mean arterial blood pressure; SBP, systolic blood pressure; ns, not significant.
87.1 ± 9.5 mmHg and 86.5 ± 8.7 mmHg, respectively; the −0.6 ± 6.5 mmHg decrease was not significant.
In the sodium restriction group, SBP before and after surgery was 133.5 ± 12.7 mmHg and 123.3 ± 11.1 mmHg, respectively; the −10.2 ± 16.4 mmHg decrease after surgery was significant. In the control group, the SBP before and after surgery was 121.5 ± 14.9 mmHg and 124.4 ± 12.7 mmHg, respectively; the 2.9 ± 16.4 mmHg increase after surgery was significant.
Both groups had no significant change in DBP before and after surgery. In the sodium restriction group, DBP decreased by −4.8 ± 10.9 mmHg after surgery, having been 70.7 ± 8.8 mmHg before surgery and 65.9 ± 6.8 mmHg after surgery. In the control group, the DBP decreased after surgery by 0.1 ± 8.8 mmHg, having been 67.0 ± 6.6 mmHg before surgery and 67.0 ± 6.7 mmHg after surgery. The changes in mean arterial blood pressure, SBP, and DBP in the sodium restriction group differed significantly from their respective changes in the control group.
Simple regression analyses were used to examine the association of differences in CRAE and in CRVE before and after cataract surgery (with a one-week hospitalization) in relation to age, gender, mean arterial blood pressure, diabetes mellitus, hyperlipidemia, Brinkman Index, alcohol intake, and BMI. The analyses demonstrated that an increase
in CRAE was significantly associated with gender, diabetes mellitus, hyperlipidemia, alcohol intake, and BMI (Table 3), that an increase in CRVE was significantly associated with age, and that a decrease in CRVE was significantly associated with hyperlipidemia (Table 4).
Multiple regression analyses were used to examine the association of differences in CRAE and CRVE before and after cataract surgery and a one-week hospitalization with the factors listed earlier. The analyses revealed that an increase in CRAE was significantly associated with diabe-tes mellitus, hyperlipidemia, and alcohol intake (Table 3), that an increase in CRVE was significantly associated with age and Brinkman Index, and that a decrease in CRVE was significantly associated with hyperlipidemia (Table 4). In multiregression analysis, the analysis results in models 1 and 2 were the same as those in model 3 (a saturated model with all factors included). Furthermore, hyperlipidemia in this study was analyzed based on the Japanese diagnostic criteria. However, performing an analysis based on the criteria of the NCEP produced the same results (results not shown).
Discussion
Epidemiologic surveys and interventional trials have shown that an excessive intake of sodium causes hypertension and
Clinical Ophthalmology downloaded from https://www.dovepress.com/ by 118.70.13.36 on 21-Aug-2020
Dovepress
Tano et al
Table 3
Results of single and multiple regression analyses on the association of background factors with differences in retinal arteriolar diameters before and after sodium restriction
Single regression analysis
Multiple regression analysis model 1 Multiple regression analysis model 2 Multiple regression analysis model 3
B
P
value (95% CI)
B
P
value (95% CI)
B
P
value (95% CI)
B
P
value (95% CI)
− 16.445 0.008** ( − 28.549, − 4.341) − 16.418 0.008** ( − 28.544, − 4.293) − 21.865 0.012* ( − 38.881, − 4.850) g
roup sodium restriction group Control group 0.817 −0.496 0
0.343 ( − 0.878, 2.513) 0.684 ( − 2.894, 1.901)
– −0.104 0 – ns (
−
2.374, 2.165)
– −0.195 0 – ns (
−
2.491, 2.100)
– −0.285 0 – ns (
− 2.590, 2.020) Age − 4.640 0.068 0.426 ( − 16.109, 6.830) 0.369 ( − 0.081, 0.217) – 0.140 – ns (
−
0.008, 0.287)
– 0.135 – ns (
−
0.013, 0.284)
– 0.146 – ns (
−
0.004, 0.296)
g
ender Male Female
−
1.606 4.729 0
0.045* ( − 3.175, − 0.037) ,
0.001** (2.416, 7.043)
– 1.906 0 – ns (
−
0.593, 4.405)
– 2.053 0 – ns (
−
0.501, 4.608)
– 2.517 0 – ns (
−
0.409, 4.723)
Diabetes + −
−
0.484 2.968 0
0.517 (
−
1.957, 0.988)
0.019* (0.496, 5.439)
– 5.538 0 – 0.001** (1.613, 6.472) – 5.657 0 – 0.001** (2.497, 8.817) – 5.867 0 – ,0.001** (2.672, 9.062)
h
yperlipidemia
+ −
−
0.984 2.825 0
0.272 (
−
2.748, 0.779)
0.020* (0.446, 5.203)
– 4.042 0 – 0.001** (2.410, 8.665) – 4.053 0 – 0.001** (1.619, 6.487) – 4.007 0 – 0.001** (1.570, 6.445)
Current alcohol intake + −
−
0.624 4.420 0
0.369 (
−
1.991, 0.742)
0.001* (1.791, 7.050)
– 5.419 0 – ,0.001** (2.648, 8.191) – 5.477 0 – ,0.001** (2.694, 8.261) – 5.580 0 – ,0.001** (2.785, 8.374)
BM
i
−
8.078 0.361 0.224
0.018* (
−
14.781,
−
1.376)
0.010* (0.085, 0.636) 0.732 (
−
1.064, 1.511)
– −0.005 – – ns (
−
0.313, 0.302)
–
– 0.009 – – ns (
−
0.303, 0.321)
–
– −0.037 – – ns (
−
0.364, 0.291)
–
Brinkman index MABP (bef
or
e surger
y)
0.003 −3.807 0.050
0.161 ( − 0.001, 0.008) 0.556 ( − 16.523, 8.909) 0.496 ( − 0.095, 0.195) – – – – – – −
0.001 – –
ns (
−
0.006, 0.003)
– –
−
0.002 – 0.065
ns (
−
0.006, 0.003)
– ns (
− 0.077, 0.207) Notes: Retinal arteriolar caliber (before – after surgery, one-week hospitalization) * P , 0.05; ** P , 0.01. Model 1: adjusted for age, gender, diabetes mellitus, hyperlipidemia, alcohol intake, and BMI. Model 2: adjusted for age, gender,
diabetes mellitus, hyperlipidemia, Brinkman Index, alcohol intake, and BMI. Model 3: a saturated model, adjusted for all factors. Abbreviations:
BMI, body mass index; CI, confidence interval; MABP, mean arterial blood pressure; ns, not significant.
Clinical Ophthalmology downloaded from https://www.dovepress.com/ by 118.70.13.36 on 21-Aug-2020
Dovepress Blood pressure and retinal vascular diameter
Table 4
Results of single and multiple regression analyses on the association of background factors with differences in retinal venular diameters before and after sodium restriction
Single regression analysis
Multiple regression analysis model 1 Multiple regression analysis model 2 Multiple regression analysis model 3
B
P
value (95% CI)
B
P
value (95% CI)
B
P
value (95% CI)
B
P
value (95% CI)
− 19.500 0.018* ( − 35.648, − 3.351) − 22.666 0.006** ( − 38.751, − 6.58) − 14.349 0.265 ( − 39.671, 10.973) g
roup sodium restriction group Control group 0.934 1.903 0
0.453 ( − 1.518, 3.386) 0.280 ( − 1.564, 5.371)
– −0.150 0 – ns (
−
3.573, 3.273)
– 0.538 0 – ns (
−
2.874, 3.949)
– 0.460 0 – ns (
− 2.970, 3.890) Age − 24.755 0.348 0.003** ( − 40.990, − 8.520)
0.001** (0.137, 0.560)
– 0.326 – 0.003** (0.115, 0.537) – 0.358 – 0.001** (0.149, 0.567) – 0.341 – 0.003** (0.117, 0.564)
g
ender Male Female 2.036 −0.326 0
0.091 ( − 0.330, 4.402) 0.854 ( − 3.815, 3.163)
– −0.357 0 – ns (
−
3.700, 2.987)
– −1.897 0 – ns (
−
5.388, 1.594)
– −0.544 0 – ns (
−
4.362, 3.274)
Diabetes + − 1.835 0.144 0
0.096 ( − 0.330, 4.000) 0.938 ( − 3.490, 3.778)
– – 0 – – – – 0 – – – −2.492 0 – ns (
−
7.427, 2.262)
h
yperlipidemia
+ −
5.387 −6.365 0
,
0.001** (2.880, 7.893)
, 0.001** ( − 9.744, − 2.985)
– −5.998 0.000 – 0.001 (
−
9.393,
−
2.603)
– −5.742 0 – 0.001** (
−
9.092,
−
2.392)
– −6.575 0 – ,0.001 (
−
10.203,
−
2.948)
Current alcohol intake + − 2.428 −2.009 0 0.019* (0.399, 4.458) 0.312 (
−
5.916, 1.897)
– – 0 – – – – 0 – – – −1.996 0 – ns (
−
6.154, 2.162)
Brinkman index
1.199 0.007 2.502
0.205 (
−
0.659, 3.058)
0.054 (0.000, 0.054) 0.618 (
−
7.378, 12.383)
– – – – – – – 0.009 – – 0.009** (0.002, 0.016) – – 0.011 – – 0.003** (0.004, 0.018) –
BM i MABP (bef or e surger y) −
0.026 5.795 −0.045
0.901 ( − 0.431, 0.380) 0.536 ( − 12.655, 24.245) 0.675 ( − 0.255, 0.166) – – – – – – – – – – – – −
0.205 – −0.011
ns (
−
0.693, 0.282)
– ns (
− 0.222, 0.200) Notes: * P , 0.05; ** P , 0.01. Retinal venular caliber (before – after surgery, one-week hospitalization) Model 1: adjusted for age, gender, and hyperlipidemia. Model 2: adjusted for age, gender, hyperlipidemia, and the Brinkman Index.
Model 3: a saturated model, adjusted for all factors. A reference category is 0, B is the regression coefficient, and intercept B is the partial regression coefficient. Abbreviations:
BMI, body mass index; CI, confidence interval; MABP, mean arterial blood pressure; ns, not significant.
Clinical Ophthalmology downloaded from https://www.dovepress.com/ by 118.70.13.36 on 21-Aug-2020
Dovepress
Tano et al
that high blood pressure is a risk factor for ischemic heart disease and cerebrovascular disorders.5,29–31 The INTERSALT
study has demonstrated that the sodium intake of Japanese people was about 12 g/day (based on 24-hour urine collection) and that subjects consuming 3 g or less per day of salt equivalent (based on sodium excretion) had lower blood pressure.32 An increase in sodium intake of 100 mmol/day
(equivalent to about 6 g/day) has been shown to raise SBP by 6 mmHg (by about 3 mmHg adjusted by weight). This reveals a correlation between sodium intake and blood pressure.32
The DASH-Sodium Trial also indicates that sodium intake influences blood pressure, and that a lower sodium intake is associated with a lower blood pressure.33
A hypertensive fundus change (ie, narrowing of the retinal vessels occurring at an early stage) is an important risk factor for the onset of cerebrovascular disorders.6 The
relationship between antihypertensive drugs and changes in the retinal vessels has been evaluated, but the relationship between sodium restriction and retinal vascular diameter has not been examined.13 Therefore, in this study we
evalu-ated changes in the diameter of retinal vessels and changes in mean blood pressure due to sodium restriction for one week. This short period of sodium restriction significantly reduced mean arterial blood pressure in our study, and this finding has previously been demonstrated.33 The change in
mean arterial blood pressure before and after cataract surgery also differed significantly between the sodium restriction and control groups. Sodium restriction also significantly reduced SBP. DBP was not reduced significantly, but the change after surgery differed significantly between the two groups.
It is generally understood that an excessive intake of sodium increases the volume of circulating blood, raises blood pressure, and changes arterial parameters such as vascular resistance without affecting blood pressure.1–3 The
decrease in blood pressure in our study probably occurred through reduction of the circulating blood volume and vascular resistance due to sodium restriction.
In the sodium restriction group, there was only a mild decrease in CRAE after surgery. However, multiple regres-sion analyses showed that an increase in CRAE was sig-nificantly associated with diabetes mellitus, hyperlipidemia, and alcohol intake. Diabetes mellitus and hyperlipidemia are important risk factors for vascular disorders caused by arte-rial sclerosis, and the onset frequencies of cerebrovascular disorders and ischemic cardiac diseases increase markedly when diabetes mellitus and hyperlipidemia are both present.34
Hypertension is similarly a well-defined risk factor for
arterial sclerosis. Studies in the US and Europe, such as the Framingham Study, have indicated that hypertension is a risk factor for coronary artery disease.35 In Japan, the Hisayama
Study also shows that a blood pressure of 140/90 mmHg or greater significantly increases the frequency of cerebral infarction.36 Pathologic conditions, such as diabetes mellitus,
hyperlipidemia, and hypertension, may also be closely related to metabolic syndrome, when viewed from the perspective of insulin resistance and fat accumulation around organs. Insulin resistance is a predictor of metabolic syndrome. Compared with subjects with normal blood pressure, patients with hypertension have insulin resistance,37,38 which may be
due to increased visceral fat.39
Based on these findings, the improvement of insulin resistance, due to correction of diet and establishing of a controlled diet during hospitalization, may have increased CRAE in patients with diabetes mellitus and hyperlipidemia. Diabetes mellitus apparently influences retinal arteriolar diameter because previous epidemiologic surveys have reported significantly larger retinal arteriolar diameters in people with diabetes mellitus.12
We also note that long-term alcohol intake results in elevation of blood pressure.40 A reduction in alcohol intake
lowers blood pressure by 80% within one to two weeks.41
Because the hospitalized patients were unable to drink alco-hol, an antihypertensive effect due to reduced alcohol intake may also have contributed to the increase in CRAE.
An increase in CRVE was associated with the Brink-man Index. It has been noted that smoking causes transient blood pressure elevation, but a method for evaluating the chronic effect of smoking on blood pressure has not been established.42 Previous studies have shown that CRVE is
significantly higher in smokers than in nonsmokers. However, it is unclear if the increase in CRVE in smokers results from a decreased blood pressure, results from compensation by the nervous system due to changes in body fluid volume, or is affected by smoking itself.12
The relationship between the decrease in CRVE and hyperlipidemia may be connected with an increase in HDL-C, correction of diet during hospitalization, and establishing a controlled diet.12
The relationship between a slight increase in CRVE and age may be connected with aging and presence of cataracts in the subjects. The resolution of the fundus photographs was low. The larger diameter of retinal venules compared with the diameter of retinal arterioles may have produced smaller errors that resulted in significant differences for CRVE.
Clinical Ophthalmology downloaded from https://www.dovepress.com/ by 118.70.13.36 on 21-Aug-2020
Dovepress Blood pressure and retinal vascular diameter
In addition, hospitalization could lead to a more regular regimen, regarding factors such as diet and drug administration, compared with a patient’s ordinary life. These factors may influence the diameter of retinal vessels. There-fore, in a future study we will also measure additional factors, including amount of sodium intake, insulin resistance, and various cholesterol levels.
Blood pressure control for one year is associated with an improvement in retinal arteriolar narrowing.13 Sodium
restric-tion for nine weeks has been shown to increase the diameter of the radial artery.14 Dollery et al reported that hypertension
treatment did not significantly alter vessel diameter after half an hour, as measured manually from projections of retinal images.43 However, our study indicated that sodium restriction
for one week caused a reduction of blood pressure and no sig-nificant change in retinal arteriolar diameter. Because retinal arteriolar narrowing is believed to reflect structural dam-age due to chronic hypertension,11 the effect of a one-week
sodium restriction may not be measurable because vascular architecture changes may not have occurred within that time. Multiple regression analyses indicated that diabetes mellitus, hyperlipidemia, and alcohol intake are significantly associ-ated with an increase in retinal arteriolar diameter. Sodium restriction and reducing blood pressure are important in terms of their relationship with cerebral vascular disorders. Sodium restriction for a longer period may show much clearer changes in retinal arteriolar diameter and may also cause similar changes in arterioles in the brain and kidney.
An original research study on sodium restriction should be performed in patients with hypertension without the loading of cataract surgery and sodium restriction (as in our study), but with the loading of sodium restriction only. However, in an actual clinical site, it is very difficult to find a group of patients with hypertension but without the loading of cataract surgery. In the future, original studies involving various internal medicine departments, as well as long-term research and population-based research, are required to inves-tigate vascular changes under larger blood pressure changes. A study of hospitalized patients and a population-based study may also be required in the future.
In the analysis of diameter of the retinal vessels, the present study excluded patients with severe cataracts and invisible fundus. The results also seem to be affected by such a selection bias.
Using diabetes mellitus, hyperlipidemia, and alcohol-ism as analysis factors, the patients with and without these diseases were evaluated. However, the actual extent of
the diseases was not evaluated. In the future, factors such as blood glucose level, glycosylated hemoglobin level, cholesterol level, and amount of alcohol consumption need to be calculated in detail and analyzed.
The sodium restriction group and the control group had significantly different average ages. The SBP responses to sodium intervention increased with age.44 Lower blood
pres-sure in the sodium restriction group may have been influenced by age. In the Blue Mountains Eye Study, the association of increased blood pressure with arteriolar narrowing dimin-ished with increasing age.45 In both groups, the subjects were
about 75 years of age or older, but the difference between each group’s average ages may have affected the results.
The computer-based method for measuring the diameter of retinal vessels permits quantification with greater accuracy and smaller errors, compared with previous methods. This method is not a subjective evaluation based on visual inspec-tion, but is an objective method using digital processing.8
Although no report exists concerning intraoperator correlation coefficients, the accuracy of the method is at the micron level; the interoperator correlation coefficients are 0.99 for arterial diameters and 0.94 for venous diameters, which demonstrates superior reproducibility and validity.20 The cross-sectional
Beaver Dam Eye Study used this method and demonstrated that the retinal arteriolar diameter decreased by 4.0 µm with each 10 mmHg increase in mean arterial blood pressure.7
Using the same method, the Funagata study showed that each 10 mmHg increase in mean arterial blood pressure was associ-ated with a 2.8 µm reduction in arteriolar diameter.10
This method will allow further examination of the relation-ship between sodium restriction and hypertension. Based on minute changes in the diameter of retinal vessels, this method may also be useful in detecting systemic diseases such as hypertension and arteriosclerosis. It may also be useful for monitoring the effect of antihypertensive drug treatment.
Acknowledgment
This study was supported by the 36th Mitsukoshi medical research grant.
Disclosure
The authors report no conflicts on interest in this work.
References
1. Sibazaki S, Shimada K. Sodium and cerebral vascular disorders. Blood
Press. 2007;14:989–993.
2. Schmieder RE, Messeri FH, Garavaglia GE, Nunez BD. Dietary salt intake. A determinant of cardiac involvement in essential hypertension.
Circulation. 1988;78:951–956.
Clinical Ophthalmology downloaded from https://www.dovepress.com/ by 118.70.13.36 on 21-Aug-2020
Dovepress
Tano et al
3. Adam W, Gillies A, Wilson M, Morgan G, Carney S. Hypertension treated by salt restriction. Lancet. 1978;1:227–230.
4. Summary of results of the National Health and Nutrition Survey (2006). Available at: http://www.mhlw.go.jp/houdou/2008/04/dl/h0430-2a.pdf. Accessed 2008 Jun 12.
5. Arima H, Tanizaki Y, Kiyohara Y, et al. Validity of the JNC VI recom-mendations for the management of hypertension in a general popula-tion of Japanese elderly: The Hisayama study. Arch Intern Med. 2003; 163:361–366.
6. Matuyama S. Hypertension and the eye, pathological conditions and significance of major hypertensive fundus lesions. In: Irinoda K, Matuyama S, editors. Ophthalmologic Book 06. Tokyo, Japan: Kanehara and Co; 1979.
7. Wong TY, Knudtson, Klein R, Klein BE, Meuer SM, Hubbard LD. Computer-assisted measurement of retinal vessel diameters in the Beaver Dam Eye Study: Methodology, correlation between eyes, and effect of refractive errors. Ophthalmology. 2004;111:1183–1190. 8. Hubbard LD, Brothers RJ, King WN, et al. Methods for evaluation of
reti-nal microvascular abnormalities associated with hypertension/ sclerosis in the Atherosclerosis Risk in Communities Study. Ophthalmology. 1999;106:2269–2280.
9. Sherry LM, Wang JJ, Rochtchina E, et al. Reliability of computer- assisted retinal vessel measurement in a population. Clin Exp Ophthalmol. 2002; 30:179–182.
10. Kawasaki R, Wang JJ, Rochtchina E, et al. Cardiovascular risk factors and retinal microvascular signs in an adult Japanese population: The Funagata study. Ophthalmology. 2006;13:1378–1384.
11. Wong TY, Islam FM, Klein R, et al. Retinal vascular caliber, car-diovascular risk factors, and inflammation: The Multi-Ethnic Study of Atherosclerosis (MESA). Invest Ophthalmol Vis Sci. 2006;47: 2341–2350.
12. Sun C, Liew G, Wang JJ, et al. Retinal vascular caliber, blood pressure, and cardiovascular risk factors in an Asian population: The Singapore Malay Eye Study. Invest Ophthalmol Vis Sci. 2008;49:1784–1790. 13. Hughes AD, Stanton AV, Jabbar AS, Chapman N, Martinez-
Perez ME, McG Thom SA. Effect of antihypertensive treatment on retinal microvascular changes in hypertension. J Hypertens. 2008; 26:1703–1707.
14. Benetos A, Xiao YY, Cuche JL, Hannaert P, Safar M. Arterial effects of salt restriction in hypertensive patients. A 9-week, randomized, double-blind, crossover study. J Hypertens. 1992;10:355–360. 15. Resnikoff S, Pascolini D, Etya’ale D, et al. Global data on visual
impair-ment in the year 2002. Bull World Health Organ. 2004;82:844–851. 16. Ellwein LB, Urato CJ. Use of eye care and associated charges among
the Medicare population: 1991–1998. Arch Ophthalmol. 2002;120: 804–811.
17. Ministry of Health, Labour, and Welfare: Comprehensive Survey of
Living Conditions of the People on Health and Welfare. Tokyo, Japan:
Statistics and Information Department, Minister’s Secretariat, Ministry of Health; 1996.
18. Yamada M, Hiratsuka Y, Roberts CB, et al. Prevalence of visual impair-ment in the adult Japanese population by cause and severity and future projections. Ophthalmic Epidemiol. 2010;17:50–57.
19. Nishi O, Nishi K, Imanishi M, Tada Y, Shirasawa E. Effect of the cytok-ines on the prostaglandin E2 synthesis by lens epithelial cell of human cataracts. Br J Ophthalmol. 1995;79:934–998.
20. Sharrett AR, Hubbard LD, Cooper LS, et al. Retinal arteriolar diameters and elevated blood pressure: The Atherosclerosis Risk in Communities Study. Am J Epidemiol. 1999;150:263–270.
21. Parr JC, Spears GF. General caliber of the retinal arteries expressed as the equivalent width of the central retinal artery. Am J Ophthalmol. 1974;77:472–477.
22. World Health Organization, International Society of Hypertension Writing Group. 2003 World Health Organization (WHO)/ International Society of Hypertension (ISH) statement on management of hypertension. J Hypertens. 2003;21:1983–1992.
23. Alberti KG, Zimmet PZ. Definition, diagnosis and classification of diabetes mellitus and its complications. Part 1: diagnosis and classifi-cation of diabetes mellitus. Provisional report of a WHO consultation.
Diabet Med. 1998;15:539–553.
24. Japan Atherosclerosis Society. Guidelines for Diagnosis and
Preven-tion of Atherosclerotic Cardiovascular Diseases. Tokyo, Japan; Japan
Atherosclerosis Society; 2007:5–10.
25. MRFIT Research Group [personal communication, 1989]. Reported in: National Cholesterol Education Program. Report of the Expert Panel on Population Strategies for Blood Cholesterol Reduction. Circulation. 1991;83:2154–2232.
26. National Cholesterol Education Program. Second report of the expert panel on detection, evaluation, and treatment of high blood cholesterol in adults (Adult Treatment Panel II). Circulation. 1994;89:1333–1445. 27. Nakamura Y, Yamamoto T, Okamura T, et al. Combined
cardiovascu-lar risk factors and outcome: NIPPON DATA80, 1980–1994. Circ J. 2006;70:960–964.
28. Iiyama K, Nagano M, Nagano N, et al. Risk factors related to the wall thickness of carotid artery assessed by ultrasonography. Nippon Ronen
Igakkai Zasshi. 1994;4:303–309.
29. Ueshima H. Explanation for the Japanese paradox: Prevention of increase in coronary heart disease and reduction in stroke. J Atheroscler
Thromb. 2007;14:278–286.
30. Lawes CM, Rodgers A, Bennett DA, et al; Asia Pacific Cohort Studies Collaboration. Blood pressure and cardiovascular disease in the Asia Pacific region. J Hypertens. 2003;21:707–716.
31. Tanizaki Y, Kiyohara Y, Kato I, et al. Incidence and risk factors for subtypes of cerebral infarction in a general population: The Hisayama study. Stroke. 2000;31:2616–2622.
32. INTERSALT Cooperative Research Group. Intersalt: An interna-tional study of electrolyte excretion and blood pressure. Results for 24-hour urinary sodium and potassium excretion. BMJ. 1988;297: 319–328.
33. Sacks FM, Svetkey LP, Vollmer WM, et al; DASH-Sodium Collaborative Research Group. Effects on blood pressure of reduced dietary sodium and the Dietary Approaches to Stop Hypertension (DASH) diet. N Engl
J Med. 2001;344:3–10.
34. American Diabetes Association. Role of cardiovascular risk factors in prevention and treatment of microvascular disease in diabetes. Diabetes
Care. 1989;12:573–579.
35. Kannel WB. Fifty years of Framingham Study contributions to under-standing hypertension. J Hum Hypertens. 2000;14:83–90.
36. Yazaki Y, Kiyohara H, Fujushima M. Relations between JNC VI blood pressure classification and the incidence of different types of cerebral infarction in Hisayama-cho. Blood Press. 2001;8:737–740.
37. Facchini FS, Hua N, Abbasi F, Reaven GM. Insulin resistance as a predictor of age-related disease. J Clin Endocrinol Metab. 2004;86: 3574–3578.
38. Sironi AM, Gastaldelli A, Mari A, et al. Visceral fat in hypertension: Influence on insulin resistance and β-cell function. Hypertension. 2004; 44:127–133.
39. Banerji MA, Lebowitz J, Chaiken RL, Gordon D, Kral JG, Lebovitz HE. Relationship of visceral adipose tissue and glucose disposal is inde-pendent of sex in black NIDDM subjects. Am J Physiol. 1997;273: E425–E432.
40. Nakamura K, Okamura T, Hayakawa T, et al; NIPPON DATA90 Research Group. The proportion of individuals with alcohol-induced hypertension among total hypertensive in a general Japanese population: NIPPON DATA90. Hypertens Res. 2007;30:663–668.
41. Puddey IB, Beilin LJ, Vandogen R. Regular alcohol use raises blood pressure in treated hypertensive subjects. A randomised controlled trial.
Lancet. 1987;329:647–651.
42. Appel LJ, Brands MW, Daniels SR, Karanja N, Elmer PJ, Sacks FM; American Heart Association. Dietary approaches to prevent and treat hypertension: A scientific statement from the American Heart Association. Hypertension. 2006;47:296–308.
Clinical Ophthalmology downloaded from https://www.dovepress.com/ by 118.70.13.36 on 21-Aug-2020
Clinical Ophthalmology
Publish your work in this journal
Submit your manuscript here: http://www.dovepress.com/clinical-ophthalmology-journal Clinical Ophthalmology is an international, peer-reviewed journal covering all subspecialties within ophthalmology. Key topics include: Optometry; Visual science; Pharmacology and drug therapy in eye diseases; Basic Sciences; Primary and Secondary eye care; Patient Safety and Quality of Care Improvements. This journal is indexed on
PubMed Central and CAS, and is the official journal of The Society of Clinical Ophthalmology (SCO). The manuscript management system is completely online and includes a very quick and fair peer-review system, which is all easy to use. Visit http://www.dovepress.com/ testimonials.php to read real quotes from published authors.
Dovepress
Dovepress
Blood pressure and retinal vascular diameter
43. Dollery CT, Hill DW, Hodge JV. The response of normal retinal blood vessels to angiotensin and noradrenaline. J Physiol. 1963;165: 500–507.
44. He J, Gu D, Chen J, et al. Gender difference in blood pressure responses to dietary sodium intervention in the GenSalt Study. J Hypertens. 2009; 27:48–54.
45. Kaushik S, Kifley A, Mitchell P, et al. Age, blood pressure, and retinal vessel diameter: Separate effects and interaction of blood pressure and age. Invest Ophthalmol Vis Sci. 2007;48:557–561.
Clinical Ophthalmology downloaded from https://www.dovepress.com/ by 118.70.13.36 on 21-Aug-2020