Author(s): M. J. Gordon
Source: The Review of Economics and Statistics, Vol. 41, No. 2, Part 1 (May, 1959), pp. 99-105 Published by: The MIT Press
Stable URL: http://www.jstor.org/stable/1927792 Accessed: 26/10/2009 09:25
Your use of the JSTOR archive indicates your acceptance of JSTOR's Terms and Conditions of Use, available at
http://www.jstor.org/page/info/about/policies/terms.jsp. JSTOR's Terms and Conditions of Use provides, in part, that unless you have obtained prior permission, you may not download an entire issue of a journal or multiple copies of articles, and you may use content in the JSTOR archive only for your personal, non-commercial use.
Please contact the publisher regarding any further use of this work. Publisher contact information may be obtained at
http://www.jstor.org/action/showPublisher?publisherCode=mitpress.
Each copy of any part of a JSTOR transmission must contain the same copyright notice that appears on the screen or printed page of such transmission.
JSTOR is a not-for-profit service that helps scholars, researchers, and students discover, use, and build upon a wide range of content in a trusted digital archive. We use information technology and tools to increase productivity and facilitate new forms of scholarship. For more information about JSTOR, please contact support@jstor.org.
The MIT Press is collaborating with JSTOR to digitize, preserve and extend access to The Review of Economics and Statistics.
DIVIDENDS, EARNINGS, AND STOCK PRICES
M. J. Gordon*
T
HE three possible hypotheses
with respect
to what an investor pays for when he ac- quires a share of common stock are that he is buying (i) both the dividends and the earnings,(2) the dividends, and (3) the earnings. It may
be argued that most commonly he is buying the price at some future date, but if the future price will be related to the expected dividends and/or earnings on that date, we need not go beyond the three hypotheses stated. This paper will critically evaluate the hypotheses by deriving the relation among the variables that follows from each hypothesis and then testing the the- ories with cross-section sample data. That is, price, dividend, and earnings data for a sample of corporations as of a point in time will be used to test the relation among the variables predict- ed by each hypothesis.
The variation in price among common stocks is of considerable interest for the discovery of profitable investment opportunities, for the guid- ance of corporate financial policy, and for the understanding of the psychology of investment behavior.' Although one would expect that this interest would find expression in cross-section statistical studies, a search of the literature is unrewarding.
Cross-section studies of a sort are used ex- tensively by security analysts to arrive at buy and sell recommendations. The values of certain attributes such as the dividend yield, growth in sales, and management ability are obtained and compared for two or more stocks. Then, by some weighting process, a conclusion is reached from this information that a stock is or is not an
attractive buy at its current price.2 Graham and Dodd go so far as to state that stock prices should bear a specified relation to earnings and dividends, but they neither present nor cite data to support the generalization.3 The distin- guished theoretical book on investment value by J. B. Williams contains several chapters de- voted to the application of the theory, but his empirical work is in the tradition of the invest- ment analyst's approach.4 The only study along the lines suggested here that is known to the writer is a recent one on bank stocks by David Durand.5
In contrast with the dearth of published stud- ies the writer has encountered a number of unpublished cross-section regressions of stock prices on dividends, earnings, and sometimes other variables. In these the correlations were high, but the values of the regression coefficients and their variation among samples (different industries or different years) made the eco- nomic significance of the results so questionable that the investigators were persuaded to aban- don their studies. There is reason to believe that the unsatisfactory nature of the findings is due in large measure to the inadequacy of the theory employed in interpreting the model, and it is hoped that this paper will contribute to a more effective use of cross-section stock price studies by presenting what might be called the elementary theory of the variation in stock prices with dividends and earnings.
Before proceeding, it may be noted that there have been some time series studies of the varia- tion in stock prices with dividends and other variables. The focus of these studies has been the relation between the stock market and the business cycle6 and the discovery of profitable
* The research for this paper was supported by the Sloan Research Fund of the School of Industrial Management at Massachusetts Institute of Technology. The author has benefited from the advice of Professors Edwin Kuh, Eli Shapiro, and Gregory Chow. The computations were done in part at the M.I.T. Computation Center.
'Assume that the hypothesis stock price, P f (xi, X2,...),
is stated so that it can be tested, and it is found to do a good job of explaining the variation in price among stocks. The model and its coefficients thereby shed light on what investors consider and the weight they give these variables in buying common stocks. This information is valuable to corporations insofar as the prices of their stocks influence their financial plans. It is also true that a stock selling at a price above or below that predicted by the model deserves
special consideration by investors.
2 Illustrations of this method of analysis may be found in texts on investment analysis such as: Graham and Dodd,
Security Analysis, 3rd ed. (New York, i95i); and Dowrie
and Fuller, Investments (New York, I94I).
' Graham and Dodd, op. cit., 454 ff.
'The Theory of Investment Value (Cambridge, I938).
5Bank Stock Prices and the Bank Capital Problem, Occa- sional Paper 54, National Bureau of Economic Research
(New York, I957).
'J. Tinbergen, "The Dynamics of Share-Price Forma-
tion," this REVIEW, XXi (November I939), 153-60; and
Paul G. Darling, "A Surrogative Measure of Business Con- [99]
investment opportunities.7 They have not been concerned with explaining the variation in price among stocks, and it is questionable whether such data can be effectively used for this pur- pose. Auto-correlation in the time series would impair the significance of the regression coeffi- cients for many of the variables. Possibly even more important, the use of time series assumes that the coefficient of a variable is constant over time but different among stocks. The exact op- posite is assumed in any attempt to explain preference among investment opportunities.
The Sample
To test each of the theories, price, dividend, and earnings data were obtained for four in- dustries and two years, so that there are eight samples in all. The years chosen were I95I and I954, and the industries and number of cor-
porations for each industry are Chemicals, 32;
Foods, 52; Steel, 34; and Machine Tools, 46.
Including only those corporations which con- formed to a narrow definition of the industries mentioned did not provide samples of adequate size. Therefore, certain fringe classifications were included in each category. For instance, Chemicals includes pharmaceutical manufac- turers, and Steel includes forging manufacturers and certain other fabricators of steel as well as the basic steel producers. In general, while the corporations included in each sample can be considered to come under the label, there is con- siderable variation among them in such attri- butes as size, profitability, structure of the mar- kets in which they buy and sell, and investor
status.8
The use of eight samples rather than one provides a more rigorous test of the hypotheses. The industry and year selection of the data has the further advantage of allowing the use of a priori economic knowledge in evaluating the regression statistics. For instance, if the divi-
dend coefficient is considered an estimate of the rate of profit, we want to know whether the estimate is reasonable on grounds broader than statistical significance. Good preferred stocks sold in these years at dividend yields of four to five per cent, and companies acquired in merg- ers were purchased for about five times their earnings before income taxes. Therefore, we would expect the rate of profit on common stocks to fall between four and ten per cent and the coefficient in question to fall between ten and twenty-five. Further, we would expect a particular rank in the coefficients. Corporations in the chemical industry are considered to have the advantages of, size, growth, and stability; foods represent an industry that is considered stable; steels represent an industry with large corporations which are considered vulnerable to cyclical fluctuations; and machine tools repre- sent an industry of comparatively small cor- porations which are also vulnerable to the busi- ness cycle. Accordingly, one might expect the rate of profit to vary among the industries in the order just given. Further, I95I was a year
of war profits with the outlook for the future somewhat uncertain. By contrast, while there was some talk of recession in I954, there was
little evidence that the high level of income ex- tending back a number of years would fall sharply in the near future. Accordingly, one might expect that the coefficients would differ in a predictable manner between the two years.
Dividends and Earnings
Given the task of explaining the variation in price among common stocks, the investigator may observe that stockholders are interested in both dividend and income per share and derive immediately from this observation the model:
P = ao + a,D + a2 Y (I)
where P = the year-end price, D = the year's
dividend, and Y = the year's income. The equation may be considered of interest solely for the multiple correlation between the actual and predicted price, in which case no meaning can be given to the regression coefficients. Al- ternatively, the equation may be read to mean that the coefficients a, and a2 represent the value the market places on dividends and earnings respectively, a possible objective being the
fidence and Its Relation to Stock Prices," Journal of Finance, x (December I955), 442-58.
'The outstanding example of this is The Value Line In- vestment Survey. In addition, numerous articles in the Analysts Journal and the Journal of Finance analyze the change over time of price with other variables. A paper of some interest is D. Harkavy, "The Relation Between Re- tained Earnings and Common Stock Prices for Large, Listed Corporations," Journal of Finance, viii (September I953), I83-97.
'A list of the corporations and a description of how they were selected may be obtained from the writer on request.
measurement of the relative importance of the two variables. However, a share of stock like any other asset is purchased for the expected future income it provides. This income may be the dividend or it may be the earnings per share, but it cannot be both. The model is therefore conceptually weak.
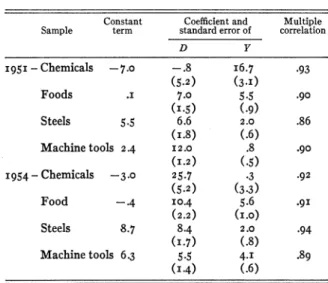
The unfortunate consequence of this prag- matic approach to the measurement of the vari- ation in stock prices with dividend and earnings is illustrated by the data of Table i. The divi-
dend coefficient for chemicals in I95I is nega- tive and machine tools has the highest coeffi- cient. Between I95I and I954 the chemicals
coefficient changes from approximately zero to
25. Many of the dividend coefficients are ma-
terially below ten, and in I954 the highest co-
efficient is five times the lowest. The income coefficients, with the exception of chemicals in
I95I, are extraordinarily low as measures of
the price the market is willing to pay for earn-
ings.
Machine tools in I95I and chemicals in I954
have income coefficients that are not significant- ly different from zero, and three of the other coefficients are materially below five. Armed only with the theory just stated, it would be most difficult to infer from the data the exist- ence of a logical structure in the pricing of common stocks.
The Dividend Hypothesis
The hypothesis that the investor buys the dividend when he aquires a share of stock seems intuitively plausible because the dividend is literally the payment stream that he expects to receive. In implementing the hypothesis it must be recognized that the stockholder is interested in the entire sequence of dividend payments that he may expect and not merely the current value. For the purpose of arriving at an opera- tional model we may represent this infinite se- quence by two quantities, one the current divi- dend and the other a measure of the expected growth in the dividend.
Among the events which will lead to an in- crease in a corporation's dividend are: success- ful trading on its equity, an increase in its return on investment, and selling additional common stock when the rate of profit the corporation can earn is above the rate at which its stock is sell- ing. However, there is no doubt that the most important and predictable cause of growth in a corporation's dividend is retained earnings. For those interested in a more rigorous argument it has been shown that if a corporation is expected to earn a return r on investment and retain a fraction b of its income, the corporation's divi- dend can be expected to grow at the rate br.9 If the investment or book value per share of com- mon stock is B, then
br Y-D y Y-D (2)
Y B B(2
Investors are interested in growth and not rate of growth, since a high rate of growth starting with a low initial value will pay off in the heavi- ly discounted distant future, and it will not be as attractive as a lower rate of growth starting from a higher initial value. Therefore, in a model where price and dividend are absolute quantities, it is likely that retained earnings per share without deflation by book value is a better measure of growth than the rate of growth. The previous discussion has provided the economic rationale for using the equation
P = ao + a,
D
+ a2 (Y-D) (3)TABLE I.- MODEL I, REGRESSION OF PRICE ON DIVIDEND AND INCOME
Constant Coefficient and Multiple Sample term standard error of correlation
D Y I95I-Chemicals -7.0 -.8 I6.7 .93 (5.2) (3.I) Foods .J 7.0 5.5 .90 (I-5) (.9) Steels 5.5 6.6 2.0 .86 (i.8) (.6)
Machine tools 2.4 I2.0 .8 .90
(I.2) (.5)
I954- Chemicals -3.0 25.7 .3 .92
(5.2) (3.3)
Food -4 I0.4 5.6 .9I (2.2) (I.0)
Steels 8.7 8.4 2.0 *94
(I -7) (.8)
Machine tools 6.3 5.5 4.I .89 (I-4) (.6)
'The argument is developed more fully in M. J. Gordon and Eli Shapiro, "Capital Equipment Analysis: The Re- quired Rate of Profit," Management Science, DiI (October I956), I02-IO.
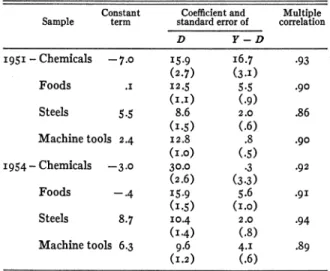
to represent the hypothesis that the investor buys the dividend when he acquires a share of stock. The reciprocal of the dividend coefficient may be looked on as an estimate of the rate of profit the market requires on common stocks without growth, and the retained earnings co- efficient is the estimate of what the market is willing to pay for growth.
Table 2 presents the eight sample estimates
of the model's coefficients. The I95i dividend
coefficients are considerably superior to those of Model I under the criteria stated earlier for their absolute and relative values. Only the machine tools coefficient appears comparatively high. The I954 coefficients vary among the in-
dustries as expected and they fall within the expected range. The spread in the coefficients is only one-half the range of those in Model I, but it still seems quite large. In particular one might wonder at the high chemicals-I954 co- efficient, the low steels-i95I and machine tools-
I954 values, and the strong inverse correlation
between the coefficients and the constant terms. Turning now to the retained earnings coeffi- cients, what would we expect of them? Since they represent the price the market is willing to pay for growth in the dividend, with retained earnings serving as an index of growth, the only statement with respect to their values that fol- lows from the theory is that they should be positive. It may be thought nonetheless that their values seem low, and the absence of sta- tistical significance at the five per cent level for two coefficients, machine tools-I95I and chem- icals-Ig954, is particularly disturbing. The really surprising result is the negative chemicals co- efficients for I954. On the other hand there is
some a priori credibility in the findings. Growth is most uncertain and it becomes quantitatively important by comparison with the current divi- dend in the distant future. Also, apart from the
I954 chemicals there is a rough correspondence
between the rank of the coefficients and notions as to the comparative stability of earnings among the industries.
The reader may have noted (i) the multiple
correlation coefficients in Tables i and 2 are the
same for each industry year, (2) the earnings
and retained earnings coefficients, a2 and a2 are the same, and (3) the dividend coefficient a, = a, + a2. On the first point, in both equations price
is a linear function of the same variables, so that they both yield the same correlation coefficients. The earnings and retained earnings coefficients are the same, since the change in earnings is the same as the change in retained earnings when the dividend is held constant. The difference in the dividend coefficients is due to the fact that in equation (i) the increase in dividend involves
a corresponding reduction in retained earnings, whereas in equation (3) retained earnings is held constant.
The dividend hypothesis provides a more reasonable interpretation of equation (i) than
the interpretation given in the previous section. If growth is valued highly, an increase in the dividend with a corresponding reduction in re- tained earnings will not increase the value of a share as much as when a low value is placed on growth. There is some tendency for the a, co- efficients to vary among industries accordingly. Another point to be noted is that the standard error of a, is below that for a,. This combined with the higher values of the former coefficients means that the change in price with the divi- dend can be predicted with much greater accu- racy when retained earnings are held constant than when the increase comes out of retained earnings.
The Earnings Hypothesis
The third hypothesis is that the investor buys the income per share when he acquires a share
TABLE 2. - MODEL II, REGRESSION OF PRICE ON DIVIDEND AND RETAINED EARNINGS
Constant Coefficient and Multiple Sample term standard error of correlation
D Y-D
I 95 I-Chemicals -7.0 I5.9 I6.7 .93 (2.7) (3 .)
Foods .1 I 2.5 5-5 .90
(I.I) (.9)
Steels 5.5 8.6 2.0 .86
(I.5) (.6)
Machine tools 2.4 I2.8 .8 .90 (I.0) (.5)
I954- Chemicals -3.0 30.0 .3 .92
(2.6) (3-3)
Foods -.4 I5.9 5.6 .9I (I.5) (I.0)
Steels 8.7 I0.4 2.0 .94 (I -4) (.8)
Machine tools 6.3 9.6 4.I .89
of stock. The rationale is that regardless of whether they are distributed to him the stock- holder has an ownership right in the earnings per share. He receives the dividend in cash and the retained earnings in a rise in the share's value, and if he wants additional cash he can always sell a fraction of his equity. In short, the corporate entity is a legal fiction that is not material with respect to his rights in the cor- poration or the value he places on them.'0 One can argue further that the different tax treat- ment of dividends and capital gains creates a stockholder preference for retained earnings.
The hypothesis may be tested by reference to the data of Table 2. If the investor is indiffer-
ent to the fraction of earnings distributed, the dividend and retained earnings coefficients of Model II should be the same. However, with the exception of chemicals-I95 I the difference between the coefficients is statistically signifi- cant. Durand's bank stock study presents the same picture on this question."
Since the proposition that the rate of profit at which a common stock sells is independent of the dividend rate has some intuitive merit, a theoretical explanation of the statistical findings presented above is of interest. The first point to be noted is that the dividend hypothesis is cor- rect regardless of whether the earnings hypoth- esis is correct. The only point at issue is whether the dividend hypothesis is unnecessary. Can one study the pricing of common stocks and related questions without considering the frac- tion of income paid in dividends? It is therefore possible to investigate the problem by using a more rigorous formulation of the dividend hy- pothesis to establish the condition for the valid- ity of the earnings hypothesis.
Let k be the rate of profit at which a stock is selling, Yt the income expected in year t, b the fraction of income the corporation is expected to retain, and r the rate of profit it is expected to earn on investment. The corporation's divi- dend is expected to grow at the rate br, and the price of the stock at t = o is:
00 Po = I (I-b)Yte ktdt 0 f C (I-b)Yoebrte-ktdt. (4) 0
The price of the share is finite and the integra- tion may be carried out if k > br, in which case
= (I-b) Y? (5)
k -br
It may be noted that if k = r, equation (5) reduces to
Po = i Y?' (6)
but this is not relevant to the question at issue. For the earnings hypothesis to be valid, it is necessary that k be independent of b. That is, the rate of profit required by the market should be independent of the fraction of income re- tained.
We could reason as follows. A necessary con- dition for the price of a stock to be finite is
k
> br. This condition is most easily satisfied if k is an increasing function of br, and if this is true we would also expect that k will vary with b. Other things equal, the rate of profit required on a common stock will vary for a corporation and among corporations inversely with the dividend rate.An argument with considerably more the- oretical content can be derived from the two following assumptions, both of which appear reasonable. (i) The rate at which a future pay-
ment is discounted increases with its uncertain- ty; and (2) the uncertainty of a future payment
increases with the time in the future at which it will be received. It follows that the rate of profit at which a stream of expected payments is discounted is really an average of rates, each weighted by the size of the payment. The larger the distant payments relative to the near pay- ments, the higher the average rate that equates the stream of payments with the price, the latter obtained by discounting each future payment at its appropriate rate. The relative size of the distant payments will of course vary with the rate of growth. Therefore, given the current earnings, the rate of profit required on a share increases with the fraction of income retained. The same reasoning provides an explanation for the tendency of interest rates on bonds to in-
'LThis appears to be a widely held point of view in the economics literature. See for example Lutz and Lutz, The Theory of Investment of the Firm (Princeton, I95I). The question is nowhere considered explicitly, but it is implicit in the material treated on pages 155 f.
crease, other things being the same, with the maturity of the bond.
Refinements in the Model
Equation (3) is an extremely simple and crude expression of the dividend hypothesis, and in- sofar as the values of the coefficients are suspect, it may be due to limitations of the model. In this section we shall discuss the more important limitations, suggest how they may be dealt with, and then present data for a model that attempts to overcome some of these limitations.
i. Correlation between the variables and
variation in the coefficients among industries is due in part to the scale factor. The problem may be stated as follows. Assume a sample of n corporations for all of which the dividend is the same, the price differs among the shares, and the average of the prices is higher than the dividend. There is no correlation between divi- dend and price. However, if n numbers are selected at random and the price and dividend of each share is multiplied by one of these num- bers, correlation between the variables will be created. Further, if each of the n random num- bers is first multiplied by a constant greater than one, the correlation and the regression co- efficient will be larger the larger the value of this constant. The presence of so-called high- priced and low-priced stocks in a sample reflects in some part this scale factor. It is possible that by deflating the data, say by book value, and/or using logs we will moderate the influence of scale
on the coefficients.
2. The independent variables in equation (3)
are the current values of dividends and retained earnings. These quantities are of interest, how- ever, only because they represent the latest available information for the prediction of fu- ture dividends. Insofar as these current values depart from averages over some prior period for extraordinary reasons, investment analysts main- tain that the changes should be discounted to arrive at what might be considered normal values. This suggests that some combination of current values and averages over a prior period for dividends and retained earnings would pro- vide a superior explanation of the variation in price among shares.
3. The value the market places on a dividend expectation derived from past dividends and
retained earnings may be expected to vary among corporations with the confidence in the dividend stream. This would suggest that the price of a share varies with other variables such as the size of the corporation, the relation of debt to equity, and the stability of its earning record. Insofar as the values of these variables vary among industries, failure to include them intro- duces variation and error in the dividend and retained earnings coefficients.
4. In the present model the variation in price with growth in the dividend is estimated by using an index of growth, retained earnings, as the independent variable. A model in which it is possible to use the rate of growth itself might yield better results. More important, the defini- tion of the rate of growth has considerable the- oretical merit to date nothing superior has been proposed but there are empirical prob- lems involved in using it. Variation in account- ing practice among firms makes the use of book value as a measure of return on investment questionable. Also, the instability of corporate retained earnings and the possibility that they vary over time differently among industries may make the use of past values to predict the future an heroic assumption. This is particularly true if investors give considerable weight, rationally or otherwise, to other variables in predicting future earnings.
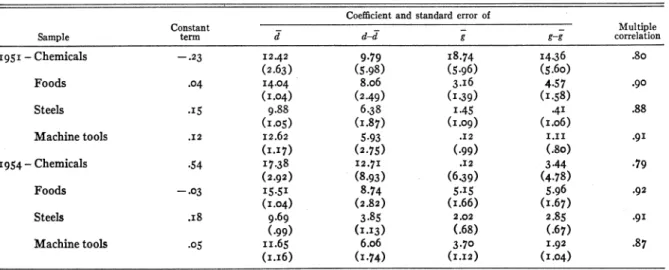
Table 3 presents the regression statistics for the following model
P=po+/ d+ 32 (d-d)
+/33g+34 (g-g). (7)
In this equation:
P = year-end price divided by book value, d = average dividend for the prior five years
divided by book value,
d = current year's dividend divided by book value,
g = average retained earnings for the prior five
years divided by book value,
g = current year's retained earnings divided by
book value.
The deflation by book value was undertaken to eliminate the scale effect discussed previous- ly.'2 The objective was only partially accom- plished, since correlation exists between the
'The use of deflated variables in regression analysis is a
I05
TABLE 3. REGRESSION OF PRICE ON DIVIDEND, RETAINED EARNINGS, CHANGE IN DIVIDEND, CHANGE IN RETAINED EARNINGS, ALL DEFLATED BY BOOK VALUE
Coefficient and standard error of
Constant _ _ - Multiple Sample term d d-d g g-g correlation
I95I - Chemicals -.23 I2.42 9.79 I8.74 I4.36 .8o
(2.63) (5.98) (5.96) (5.6o)
Foods .04 I4.04 8.o6 3.I6 4.57 .90
(I .04) (2.49) (I.3 9) (I .58)
Steels .I5 9.88 6.38 I.45 .4I .88 (I.05) (I.87) (I.09) (i.o6)
Machine tools .I2 I2.62 5.93 .I2 I.II .9I
(I.I7) (2.75) (.99) (.80)
I954-Chemicals .54 I7.38 I2.7I .I2 3.44 .79
(2.92) (8.93) (6.39) (4.78)
Foods -.03 I5.5I 8.74 5.15 5.96 .92
(I.04) (2.82) (I.66) (I.67)
Steels .I8 9.69 3.85 2.02 2.85 *9I
(.99) (I.I3) (.68) (.67)
Machine tools .05 II.65 6.o6 3.70 I.92 .87 (I.I6) (I.74) (I.I2) (I.04)
deflated and undeflated variables. For instance, correlation between P and p for the eight samples ranged from zero to .65 and was more than .4 for six of the samples.
The use of d and (d- d) assumes that the investor values a stock on the basis of the aver- age dividend during the prior five years and the amount by which the current value differs from this average. The same reasoning applies to g and (g- g), which by the way should be inter- preted as deflated retained earnings and not as growth rates in the context of this model. The coefficients ,8 may be interpreted as follows:
1/3 = /2 (or /3 = 4) implies that the investors
ignore the average dividend for the prior five years and consider only the current dividend; 2 = o implies that the current dividend is ig-
nored; ,81
> A32implies that investors adjust to
a change in the dividend with a lag,'3 i.e., the elasticity of expectations is less than one. The opposite is true if
83,
</32.Turning to the data of Table 3 we see that five of the eight multiple correlation coefficients are lower than in Table 2, and for some the
difference is large. This is due to the deflation by book value. For dividends, deflation and/or
the use of both the average value and the de- parture from average appears to have done some good. The range of the dividend coeffi- cient has been reduced by comparison with Table 2, and the change in dividend coefficient
is interesting. All but the chemicals coefficients are significant at the five per cent level, and they all are less than the d coefficients. There- fore, as expected, a rise in the dividend is dis- counted until the average has risen to the new level.
The growth coefficients, however, are disap- pointing. First, the values for g are if anything poorer than the values for Y- D in Table 2.
Second, three of the eight coefficients are not statistically significant at the five per cent level. Third, for some of the samples 34 3, which
means that investors are either indifferent to past performance or prefer a share for which retained earnings has increased to one for which it has fallen.
The performance of the model just discussed in explaining the variation in price among stocks is far superior to the simple empirical approach presented earlier. However, considerable room for improvement remains. The lines along which it will be realized appear to be a more effective representation of growth and the rec- ognition of variables which influence the valua- tion of a dividend expectation. Solution of the scale problem through a different structural re- lation among the variables may also be of value.
Edwin Kuh and John R. Meyer, "Correlation and Regres- sion Estimates when the Data are Ratios," Econometrica, xxin (October 955), 400-i6.
'We are talking about an unexpected change in the dividend, since d is the percentage that the dividend bears to book value. A rise in the dividend proportional to the rise in book value counts as no change in the dividend.