Document downloaded from:
This paper must be cited as:
The final publication is available at
Copyright
http://dx.doi.org/10.1016/j.infsof.2014.01.003
http://hdl.handle.net/10251/50721
Elsevier
Fernández Diego, M.; González-Ladrón-De-Guevara, F. (2014). Potential and limitations of
the ISBSG dataset in enhancing software engineering research: A mapping review.
Potential and Limitations of the ISBSG Dataset in Enhancing Software
Engineering Research: A Mapping Review
Marta Fernández-Diego*, Fernando González-Ladrón-de-Guevara Business and Economics Department,
Universitat Politècnica de València, Camino de Vera, s/n, 46022 Valencia, Spain. *
Corresponding author. Tel.: +34 96 387 76 85. Fax: +34 96 387 97 79
E-mail address: [email protected] (Marta Fernández-Diego), [email protected] (Fernando González-Ladrón-de-Guevara)
Abstract
Context: The International Software Benchmarking Standards Group (ISBSG) maintains a software development repository with over 6,000 software projects. This dataset makes it possible to estimate a project‟s size, effort, duration, and cost.
Objective: The aim of this study was to determine how and to what extent, ISBSG has been used by researchers from 2000, when the first papers were published, until June of 2012.
Method: A systematic mapping review was used as the research method, which was applied to over 129 papers obtained after the filtering process.
Results: The papers were published in 19 journals and 40 conferences. Thirty-five percent of the papers published between years 2000 and 2011 have received at least one citation in journals and only five papers have received six or more citations. Effort variable is the focus of 70.5% of the papers, 22.5% center their research in a variable different from effort and 7% do not consider any target variable. Additionally, in as many as 70.5% of papers, effort estimation is the research topic, followed by dataset properties (36.4%). The more frequent methods are Regression (61.2 %), Machine Learning (35.7%), and Estimation by Analogy (22.5%). ISBSG is used as the only support in 55% of the papers while the remaining papers use complementary datasets. The ISBSG release 10 is used most frequently with 32 references. Finally, some benefits and drawbacks of the usage of ISBSG have been highlighted.
Conclusion: This work presents a snapshot of the existing usage of ISBSG in software development research. ISBSG offers a wealth of information regarding practices from a wide range of organizations, applications, and development types, which constitutes its main potential. However, a data preparation process is required before any analysis. Lastly, the potential of ISBSG to develop new research is also outlined.
Keywords
Systematic mapping study Research methods
Software engineering ISBSG
*Manuscript
Software effort estimation Software cost prediction 1. Introduction
The International Software Benchmarking Standards Group [1] designed and currently maintains two international public repositories: Software Development & Enhancement with over 6,000 software projects and Maintenance & Support with over 470 software applications. The repository contains more than 150 data fields collected from a wide range of countries, organizations, application types, and development types.
The goal of ISBSGis to help any type of organization (business, public, or non-profit) improve their IT resource management through the use of these datasets by performing their own analyses, estimations, comparisons, or benchmarking.
The ISBSG dataset for software development is organized by releases. The current version (since 2013) is release 12, which includes over 6,000 projects distributed between years 1989 and 2013. Such a dataset makes it possible to estimate a project‟s size, effort, duration, and cost. Furthermore, ISBSG enables users to check project specification completeness, reduce project risk, control software development, plan infrastructure development, and benchmark performance. But ISBSG suffers from two major problems: the heterogeneity of data, i.e., the combining of data from heterogeneous sources [2], and most of the variables have a lot of missing values.
ISBSG implements two fields in its datasets, which can be used to filter out low quality cases from the analysis and help handle data validation and rating issues [S105]. Each project submitted to the ISBSG repository is validated against specific quality criteria and rated in four categories. As pointed out in Liebchen and Shepperd [3], the classification is primarily guided by the completeness of the software projects, which means that low quality data are interpreted as possessing high levels of missing values.
A mapping study can be considered as a secondary study that reviews articles related to a specific research topic. Such a study provides an overview of a research area to assess the existing evidence [4] and can identify gaps in the set of primary studies, where new or better primary studies are required. Mapping studies also pinpoint specific realms of knowledge where there may be an opportunity for more complete systematic literature reviews to be undertaken [5,6].
Ultimately, a mapping study aims at providing a classification, conducting a thematic analysis, or presenting publication channels [7]. Petticrew and Roberts [5] also suggest that this type of study “involves a search of the literature to determine what sorts of studies addressing the systematic review question have been carried out, where they are
published, in what databases they have been indexed, what sorts of outcomes they have assessed, and in which populations.” These studies require a rigorous searching process as well as detailed inclusion and exclusion criteria that are clearly defined in the research
protocol and presented in the results report [8]. The main difference between a mapping study and a systematic literature review is the formulation of the research questions and the analysis of the available information [6].
The purpose of this study was to determine to what extent and how ISBSG has been the support for a group of researchers in software engineering. Thereby, systematic mapping has been performed to “map out” papers that have used this dataset in an attempt to identify the topics, estimation methods, complementary datasets, and other issues that have been dealt with in research questions. In this way, a picture portraying the potential and limitations of ISBSG as a research facility has been obtained. Additionally, the investigation into the set of papers related to ISBSG and their classification are valuable results [9].
The rest of this paper will be organized as follows: Section 2 will describe the mapping process, Section 3 will report the mapping results, Section 4 will discuss the limitations of the study, and finally, Section 5 will outline the main conclusions obtained and future work lines.
2. Research methodology
Systematic mapping studies are a type of systematic literature review that aims to collect and classify research papers related to a specific topic [5–7,10,11].
This section provides an overview of the steps involved in the process of mapping review following Petersen et al. [7] including the formulation of the research questions, the search strategy for primary studies, the inclusion and exclusion criteria, and the data collection process.
2.1. Research questions
The primary goal addressed by this study is to analyze the use of the ISBSG dataset by the research community and to consider its potential to undertake the appropriate scientific research. A number of issues and their rationales were considered:
Research question number 1 (RQ1): Which and how many journals and conferences include ISBSG-based research papers? The main purpose of this question is to provide a list of journals and conferences interested in such studies and to assess the relevance of papers based on ISBSG. To acknowledge the prestige associated with each journal and conference, their rankings are discussed. Furthermore, the temporal evolution of paper publications based on ISBSG as primary data was also taken into account for the most relevant journals and conferences.
RQ2: To what extent are researchers working with the ISBSG dataset aware of other works also using the ISBSG dataset? By examining the citations between papers, it is possible to assess the awareness of researchers to the ISBSG body of
knowledge and their ability to contribute to this body of knowledge. By scrutinizing the citations, it is possible to analyze the evolution of received citations over time. RQ3: What are the most investigated research topics and their trends over time?
The motivation behind this question is to provide an update on the contents of ISBSG-related research. Furthermore, by analyzing the evolution of the topics, both emerging issues and obsolete issues can be identified.
RQ4: What are the effort estimation methods and what are their trends over time? The goal here is to provide insight as to which effort estimation methods
(regression, machine learning methods, estimation by analogy, etc.) have been used in identified references and to determine their usage intensity over a period of time.
RQ5: Is ISBSG data a valuable source of data for the research undertaken in the paper? This question can be answered by examining whether and why ISBSG is used alone or in combination with other datasets. These other datasets have been identified through a detailed analysis. Additionally, the ISBSG release number used by the researchers was identified. When compiled, this information can provide an indication of what advantges and limitations may exist when the ISBSG dataset is used.
2.2. Search for primary studies strategy
The following four bibliographic databases were used to make a general search for relevant papers in journals and conference proceedings: IEEE Xplore (all IEEE online publications), ACM Digital Library (ACM journals, newsletter articles, and conference proceedings), ScienceDirect (Elsevier Reference Works), and Web of Knowledge. These databases were selected because they are the major search engines and digital libraries most frequently used in systematic literature reviews performed by the software
engineering community [12].
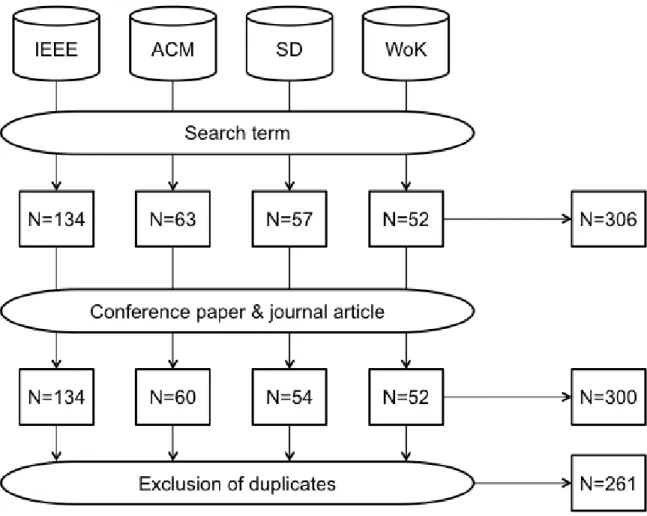
The search term “ISBSG” was used as the input for these search engines. This resulted in 134, 63, 57, and 52 results respectively. Since only conference papers and journal articles were considered, three items from ACM and three from SD were eliminated. Following this elimination, 300 references were obtained before identifying and deleting duplicate records. The search was completed in June 2012.
Next, duplicate articles in these searches were eliminated. There were 37 duplicate articles and one article in triplicate from the four databases. In the end, 261 references remained. The overall primary study selection process is summarized in Fig. 1.
Figure 1: Search process for the selection of studies.
To make the search as inclusive as possible, no limits were placed on the date of
publication and the number of restrictions was minimized. Therefore, no logical operators were used and the unique search term („ISBSG‟) was applied not only to the title and abstract of the paper, but also to the body of the text. The search, however, within the full document record was not possible in papers indexed in the Web of Knowledge.
Consequently, an additional search was performed within the journals only indexed in the Web of Knowledge using their publisher‟s search engine. As a result, 21 additional papers were included and the set of analyzed papers increased to 282. These 21 additional papers were published in Empirical Software Engineering (10, Springer), the Software Quality Journal (6, Springer), the International Journal of Software Engineering and
Knowledge Engineering (2, Word Scientific), and the Journal of Software Maintenance and Evolution-Research and Practice (3, Wiley).
2.3. Inclusion and exclusion criteria
Inclusion and exclusion criteria are required to assess each potential primary study. During the process, two false records were detected from the set of papers and two more were excluded since they were not written in English, resulting in 278 useable primary studies.
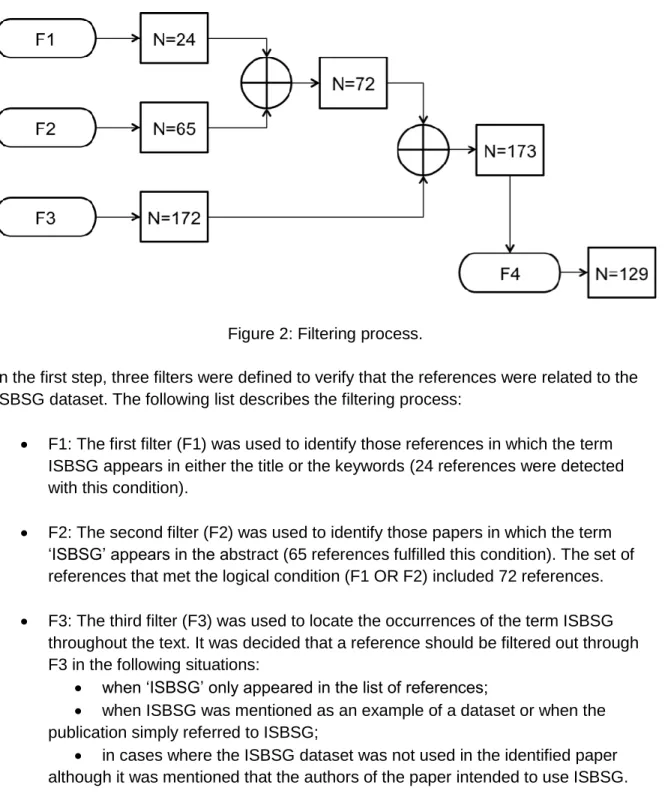
In order to improve its reliability, the filtering process based on inclusion and exclusion criteria was performed by the two authors who completed the research explained in this publication. All conflicts were resolved via discussion. How the filtering procedure was performed on 278 items and resulted in a final subset of 129 papers is presented in Fig. 2. A cross-check of the selected articles has been carried out.
Figure 2: Filtering process.
In the first step, three filters were defined to verify that the references were related to the ISBSG dataset. The following list describes the filtering process:
F1: The first filter (F1) was used to identify those references in which the term ISBSG appears in either the title or the keywords (24 references were detected with this condition).
F2: The second filter (F2) was used to identify those papers in which the term „ISBSG‟ appears in the abstract (65 references fulfilled this condition). The set of references that met the logical condition (F1 OR F2) included 72 references. F3: The third filter (F3) was used to locate the occurrences of the term ISBSG
throughout the text. It was decided that a reference should be filtered out through F3 in the following situations:
when „ISBSG‟ only appeared in the list of references;
when ISBSG was mentioned as an example of a dataset or when the publication simply referred to ISBSG;
in cases where the ISBSG dataset was not used in the identified paper although it was mentioned that the authors of the paper intended to use ISBSG. With the resulting 173 papers that satisfy the logical condition (F1 OR F2 OR F3), a second check was completed to verify whether data from the ISBSG dataset was used for the research undertaken in the paper. Articles where the ISBSG data was not the unique
data source were still included. To summarize, whenever the ISBSG dataset is used in any way, the article passed the F3 filter. Since the use of ISBSG as a primary data source is of interest, an additional filter (F4) was created:
F4: This final filter has been proposed to categorize how ISBSG was used: if ISBSG is used as a dataset, then F4=1, otherwise F4=0.
2.4. Data collection
After the filtering process, the most relevant information was obtained from each of the 129 remained studies. This includes both general information and data addressing the five research questions [7,13]. After reading each paper, the data was extracted and stored in a spreadsheet using the data extraction form presented in Table 1. Note that the first RQ could be answered by processing just the general information collected for each paper.
Table 1: Data extraction form to collect information from each identified paper.
Research
Question Field
RQ1 - Only general information: Title, author(s), type, source, year, keywords, abstract. RQ2 - Received citations.
- Number of received citations in Google Scholar*. RQ3 - Research topic.
- Dependent variable. RQ4 - Estimation method. RQ5 - ISBSG release.
- ISBSG used alone (Y/N).
- Identification of complementary datasets (if any). - Justification for the use of complementary datasets. - Advantages and limitations of ISBSG dataset. * Complementary information obtained from external sources.
The extraction form includes 17 fields for each paper. During data extraction, short notes were captured within the appropriate columns related to the topic, proposed methods, and complementary datasets. The description, the source, and whether they are public, limited, or private are examples of what was included in the notes. The goal of these notes was to capture as much information as possible in order to respond properly to the proposed research questions.
The results of the systematic mapping study are presented following each of the research questions.
3.1. RQ1
Which and how many journals and conferences include ISBSG-based research papers? Of the 129 remaining papers, 62 are journal articles and 67 are conference papers. As many as 19 journals with ISBSG-based research papers were found and are displayed in Table 2 with the corresponding number of identified papers per journal, proportion of identified papers compared to the total number of identified papers in the journals listed, and cumulative proportions of papers. The column titled “Ranking” in Table 2 shows the ranking of each journal in the category Computer Science, Software Engineering within the Journal Citation Report. If a journal does not belong to this category, the best quartile position in any category is shown followed by an asterisk.
Three journals, Journal of Systems and Software, Information and Software Technology, and Empirical Software Engineering, include 48.4% of all identified journal papers, with 11, 10, and 9 papers respectively. They belong to the third, second, and first quartile
correspondingly in the Computer Science, Software Engineering category. This category is the most common among the journals listed. All journals except SIGSOFT, which provides a forum for informal articles and other information about software engineering, are indexed within the Journal Citation Report.
Table 2: Journal type publication sources of selected papers.
Journal Number Proportion %
Cumulative
proportion % Ranking
Journal of Systems and Software 11 17.7 17.7 Q3
Information and Software Technology 10 16.1 33.9 Q2
Empirical Software Engineering 9 14.5 48.4 Q1
Software Quality Journal 7 11.3 59.7 Q4
International Journal of Software Engineering and
Knowledge Engineering 3 4.8 64.5 Q4
Journal of Software Maintenance and
Evolution-Research and Practice 3 4.8 69.4 Q3
Information & Management 2 3.2 72.6 Q1*
Journal of Computer Science and Technology 2 3.2 75.8 Q3
Software Engineering, IEEE Transactions on 2 3.2 82.3 Q1
Software, IEEE 2 3.2 85.5 Q1
Software, IET 2 3.2 88.7 Q4
ACM Trans. Softw. Eng. Methodol. 1 1.6 90.3 Q2
Annals of Operations Research 1 1.6 91.9 Q3*
Commun. ACM 1 1.6 93.5 Q1
Computing and Informatics 1 1.6 95.2 Q4*
Expert Systems with Applications 1 1.6 96.8 Q1*
Information Processing Letters 1 1.6 98.4 Q4*
Science of Computer Programming 1 1.6 100.0 Q3
* Quartile in category other than Computer Science, Software Engineering.
The 67 conference papers that were selected came from 40 different conferences. Table 3 shows the conferences with two or more ISBSG-based research papers (13), the number of papers, share, cumulative share and tier ranking in the CORE (Computing Research and Education Association of Australasia) conference list. These conferences include 59.7% of all identified conference papers. Between them, the most relevant conferences in terms of number of papers published related to the ISBSG dataset, are PROMISE
(International Conference on Predictive Models in Software Engineering) and METRICS (International Software Metrics Symposium), which are not ranked by [14] administered by the Australian Research Council. They are followed by ESEM (International Symposium on Empirical Software Engineering and Measurement), which joined together ISESE and METRICS in 2007.ESEM and all other conferences with the exception of one are ranked in the CORE conference list. ESEM is the only conference in Table 3 with an “A” ranking. The most common field for the listed conferences is Computer Software. If a conference does not belong to this field, the tier ranking in its field is shown followed by an asterisk. Note that one of the conferences appears with a single paper. The reason for this is because it is a joint conference of an international workshop and conference that does appear in the row above with two papers.
Table 3: Conference type sources with two or more selected papers.
Conference Acronym Number Proportion %
Cumulative
proportion % Ranking International Conference on Predictive
International Software Metrics
Symposium METRICS 6 9.0 20.9
International Symposium on Empirical Software Engineering and
Measurement ESEM 4 6.0 26.9 A
Asia-Pacific Software Engineering
Conference APSEC 3 4.5 31.3 C
International Conference on Computer
and Information Technology CIT 3 4.5 35.8 C*
International Symposium on Empirical
Software Engineering ISESE 3 4.5 40.3 B
International Computer Software and
Applications Conference COMPSAC 2 3.0 43.3 B
Euromicro Conference on Software Engineering and Advanced
Applications SEAA 2 3.0 46.3 C
International Conference on Tools
with Artificial Intelligence ICTAI 2 3.0 49.3 B*
International Conference on Software
Process and Product Measurement MENSURA 2 3.0 52.2 C* Joint Conference of International
Workshop on Software Measurement and International Conference on Software Process and Product Measurement
IWSM-MENSURA 1 1.5 53.7 C*
Symposium on Applied Computing SAC 2 3.0 56.7 B*
World Academy of Science,
Engineering and Technology 2 3.0 59.7
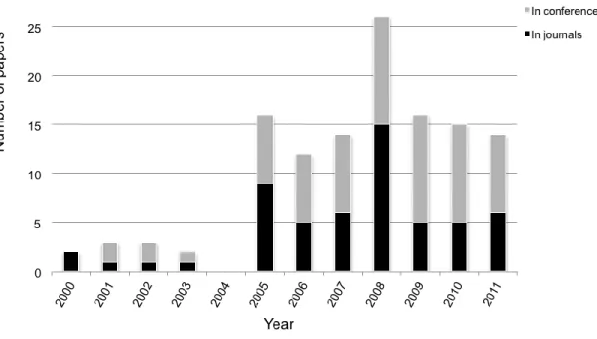
Figure 3: Number of papers in journals and conferences over time. Fig. 3 shows that since an initial period with a slight acknowledgement of the ISBSG dataset and a full disappearance in 2004, there has been a period of time from 2005 to 2011 with a nearly constant presence of these types of research either in conferences or in journals (average = 16 references) with a maximum in 2008 (26 references). The number of references published in conferences is usually greater than the number of papers published in journals.
A similar behavior can be observed in Fig. 4, which shows the progression of the number of papers published in Journal of Systems and Software, Information and Software Technology, and Empirical Software Engineering that together represent 48.4% of the identified papers. In 2000, two papers appeared in Information and Software Technology and again in 2005, after a gap of several years, two additional papers were published. A peak can be observed in 2008 with four papers. Since 2010, however, no more papers have been published. In the other two journals, a more uniform trend can be detected from 2005 to 2011, with a peak also corresponding to year 2008.
Figure 4: Number of papers published per year.
The distribution of conference papers over the years is more dispersed. Accordingly, PROMISE is a young conference, which began in 2005, that gives priority to empirical studies based on publicly available data repositories. PROMISE published three papers in 2008, one in 2010, and four in 2011. It currently holds 142 datasets, which are usually used to cross-check with several analyses. Moreover, METRICS published two papers in 2001 based on the ISBSG dataset and four in 2005 in its most recent edition.
3.2. RQ2
To what extent are researchers working with the ISBSG dataset aware of other works that also use the ISBSG dataset?
The best measure of awareness of research findings published in academic journals is the degree to which these journals or a specific paper within a journal are read. This
information, however, is difficult to obtain and even some academics may obtain their information about specific research through secondary and tertiary distributors.
Alternatively, the degree of awareness can be based on the number of times the identified papers have been cited by other papers [15]. Despite limitations, this indicator can provide some valuable information regarding the spread of scientific ideas over time.
Therefore, the number of citations that the 129 identified papers have received within the journal papers (62) of this same set have been considered. There are 44 identified papers (35.8%) in the period from 2000 to 2011 that have received at least one citation in journals. Twenty-seven of these cited papers are journal papers. All in all, the identified papers have
received 134 citations, which is an average of 1.04 citations per paper. Within these 44 cited papers, an average of 3.05 citations with a standard deviation of 3.5 have been received.
Within the 62 journal papers, the average number of citations is 33.2 with a standard deviation of 18.6 and a maximum value of 108 citations [S51]. The variable that describes the number of citations that have received the papers in the set by the papers also
included in this set that have been published in journal papers (62) has a mean value of 2.2 with a standard deviation of 2.2 and a maximum value of 9 references that have been cited [S19]. Considering the ratio of citations that are received by the identified articles to the citations included in the journal papers, an average of 7.2% of citations used by journal papers are received by the articles identified in the set.
On the other hand, the list of papers that have received six or more citations from the journal papers subset is shown in Table 4. Additionally, Table 4 displays the source of the paper and the received citations delivered by Google Scholar.
Table 4: Top-cited identified papers with at least 6 citations.
Ref. Source Year
Number of received citations Received citations Google Scholar [S125] METRICS 2001 15 145 [S40] METRICS 2001 14 91 [S4] Information and Software Technology 2000 13 126 [S114] Information and Software Technology 2005 10 78 [S23] Information and Software Technology 2000 6 57
Only five papers received six or more citations. The two conference papers came from METRICS and the three other papers were published in the Information and Software Technology journal. Since four out of five of the most cited papers corresponded to the beginning of the time period (2000-2001), it was decided that conducting a temporal analysis would be valuable. This is presented in Table 5 and Fig. 5.
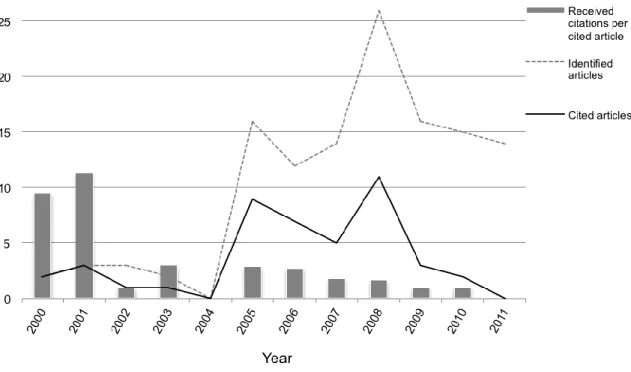
Year Identified articles Cited articles Number of received citations Identified cited articles % Received citations per identified article Received citations per cited article Received citations on Google Scholar 2000 2 2 19 100.0 9.5 9.5 183 2001 3 3 34 100.0 11.3 11.3 275 2002 3 1 1 33.3 0.3 1.0 38 2003 2 1 3 50.0 1.5 3.0 37 2004 0 0 0 0.0 0.0 0.0 - 2005 16 9 26 56.2 1.6 2.9 222 2006 12 7 19 58.3 1.6 2.7 175 2007 14 5 9 35.7 0.6 1.8 150 2008 26 11 18 42.3 0.7 1.6 176 2009 16 3 3 18.7 0.2 1.0 55 2010 15 2 2 13.3 0.1 1.0 26 2011 14 0 0 0.0 0.0 0.0 - Total 123 44 134 35.8 1.1 3.0 1337
Fig. 5 shows that during the initial period from 2000 to 2001, the five articles that were cited received 53 citations from papers within the set published in journals. This means an important share (39.5%) of the sum of received citations, with an average of 10.6 citations per article. Therefore, it is apparent that the impact of these articles is greater than the impact for the remaining identified articles.
Figure 5: Number of identified and cited articles and received citations per cited article. During the following period from 2002-2004, the published articles received significantly less acknowledgement: only two articles out of five were cited with a total number of four citations. The period from 2005-2008 experienced an increase in the number of published articles and correspondingly, the number of these articles that received citations also increased (32 out of 68). This resulted in an increase of the number of citations (72) with an average of 2.2 per cited article. Finally, the most recent period (2009-2011) presents five articles that have each been cited once. Essentially, it can be said that the trend of acknowledgement measured as the number of citations per article referenced in journals has been declining steadily over time. However, this trend could be explained by the lag between the moment a paper is published and when citations, especially citations
referenced in journals, start to appear. A similar behavior can be observed when analyzing the last column of Table 5, which shows the received citations of the 44 cited articles collected from Google Scholar. The cited articles have received an average of 30.4 citations in Google Scholar with a standard deviation of 30.9.
3.3. RQ3
What are the most investigated research topics and their trends over time?
Before answering this question, an analysis concerning the target variable of the research has been performed previously. As many as 91 papers (70.5%) focus on the effort variable, which usually becomes the dependent variable of the analysis. From them, only seven
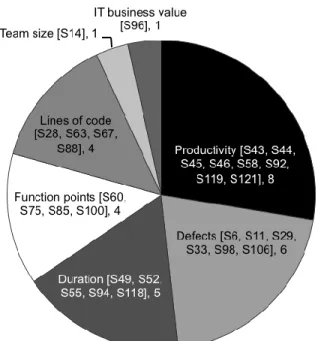
papers (5.4%) share this focus with another target variable (three papers share with duration and the other four papers share with size, productivity, defects, and team size). Fig. 6 presents the distribution of papers (29 papers, 22.5%) that do not focus on effort and instead center their research in a construct or variable different from effort, such as productivity, defects, duration, etc. Conversely, nine papers (7%) do not focus on any target variable.
Figure 6: Further considered variables apart from effort.
ISBSG is more suitable for research related to effort and productivity rather than defects for several reasons. The ISBSG dataset describes software quality in terms of the number of defects delivered and reported in the first 30 days of operation of the software. This total number is broken down into three columns corresponding to minor, major, and extreme defects [S6]. Since other defects might have been reported after the first month, the use of only a 30 day interval after the release may constitute the first limitation. Finally, the variable defect density is defined as the defects delivered in a software unit. These
variables, however, contain a significant number of missing values, substantially more than for effort-related variables. To overcome this, some authors have worked with the sum of minor, major, and extreme defects recorded [S98] and a successful improved methodology based on the k-NN multiple imputation, Monte Carlo simulation, and stepwise regression has been reported [S29, S33, S106]. Another limitation is the lack of normality of these variables, even after log-transformation, which requires the use of non-parametric methods. In any case, some learning algorithms (i.e. Regression via Classification) have been
employed to generate comprehensible models of software defects [S98]. This way, the nature of the data about defects in the ISBSG dataset may explain, to some extent, the reduced number of defect-related papers in the set of analyzed papers compared to those dealing with variables effort or productivity.
Taking into account that a paper can be classified in more than one research topic, Table 6 shows the distribution of topics following the classification of Jorgensen and Shepperd in [15]. With respect to this classification, the category Phase effort estimation has been included (originally in Other topics) due to its relevance in the set of papers analyzed. Effort distribution by phase is an important aspect in the cost estimation process [16]. Table 6 suggests that the most common research topic is Estimation methods (70.5%). A paper that shows effort estimations has been classified in this category. Considering that 29 out of 129 papers focus their research on a variable different from effort, this
percentage could be even higher if only the papers that focus on effort were taken into account (100%).
Table 6: Number and proportion of papers for each research topic.
Research topic Number of papers Proportion % Estimation methods 91 70.5 Dataset properties 47 36.4 Calibration of models 32 24.8 Production functions 18 13.9 Size measures 15 11.6 Organizational issues 11 8.5
Measures of estimation performance 6 4.6
Phase effort estimation 4 3.1
Effort uncertainty assessments 2 1.5
Other topics 21 16.3
The second largest category is Dataset properties with 47 papers (36.4%). It has been generally recognized that preliminary data analysis is necessary for software cost estimation [17] because the effectiveness of historical datasets in the generation of estimation models depends critically on the nature of the data within the dataset. For this reason, how to analyze datasets for the purpose of estimation methods when based on a historical dataset is an important issue. In this regard, most of the identified references try to somehow tackle this problem before working with an estimation method. Nevertheless, the category Dataset properties includes articles that are specially devoted to data
missing values, unbalanced datasets, etc., on the quality of any statistical or data mining technique applied to these type of repositories [S58].
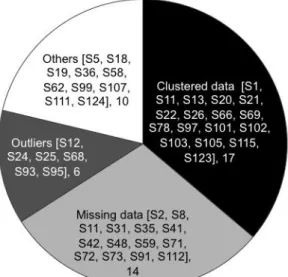
In more detail, clustered data and missing data are the most investigated issues in this category as can be seen in Fig. 7. The category Clustered data includes papers that generally try to reduce the heterogeneity of the datasets identifying subsets of project data with a clustering approach in order to form consistent project groups defined by several project properties (even chronologically) to predict the effort. By using this approach, a set of segmented models could be specifically tailored for each of these project clusters. The group Missing data includes papers (14 papers, 29.8%) that deal with imputation methods (k-NN -Nearest Neighbour Model, modified k-NN, Monte-Carlo simulation, ensemble imputation methods, etc.) to solve this quality data problem. Another subgroup is formed by papers (6 papers, 12.8%) focused on the outliers treatment, such as the procedures used to eliminate these outliers and in general identifying the impact of this type of dataset noise on the performance and robustness of the estimation methods. Finally the Others category (10 papers, 21.3%) collects topics that include the identification and selection of dominant factors and more specifically those papers that present several treatments in dataset preprocessing making it difficult to consider a predominant one.
Figure 7: Dataset properties.
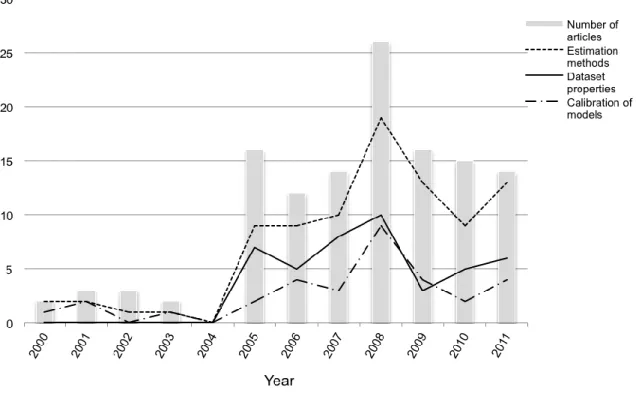
Finally, Fig. 8 shows the evolution over time of the three predominant topics, Estimations methods, Dataset properties, and Calibration of models, listed accordingly in Table 6.
Figure 8: Evolution over time of the three most frequent topics. In the first period (2000-2004) with a very limited number of articles (10), the two predominant topics Estimation of methods (6 papers throughout the period) and
Calibration of models (4 papers) encompass all of the references with no papers classified in the group Dataset properties. The category Dataset properties begins to noticeably appear starting in the year 2005 and appears to have even more relevance than the topic Calibration of models. During the period from 2005 to 2011, the most common research topic is by far Estimation methods, followed by Dataset properties, and then Calibration of models. During 2010, there is a renewed interest by researchers in estimation methods and dataset properties.
3.4. RQ4
What are the most investigated estimations methods and trends over time?
Table 7 presents the methods that have been used in ISBSG data analyses and the number of references in which such methods appear, considering that a single paper may have used several methods. Seventy-nine articles of the set have used regression making it the most frequently used method. This result is consistent with other authors and this method is considered to provide good accuracy ([S15], [15]). The Regression group includes a wide range of regression-based estimation models including linear regression, multiple linear regression, ordinary least-squares (OLS) regression, stepwise regression, robust regression, ordinal, categorical and logistic regression, multivariate adaptive regression, ANOVA, and ANCOVA to name a few. Occasionally, this method is used to
contrast the results that have been obtained by other methods. Another group that has been identified as predominant is made up of the machine learning oriented methods, which have been used with at least one of these techniques by 46 references (35.7%). The third method is Estimation by Analogy (EbA). Together with case-based reasoning estimation methods, both may be viewed as a systematic development of the expert opinion through experience learning and exposure to analogue case studies. The aim is to compare the software project being developed with similar historical projects for deriving software effort estimates [18,19, S63]. This group includes 29 references representing 22.5% of total.
The category Combination of Estimates includes studies on the combination of estimates from different sources (13.2%). Additionally, there is a group where the estimation method used has not been relevant (7 references) due to the goals and procedures of these papers. A new group defined as Fuzzy has been included. This group was included in the Others category for the Jorgensen and Shepperd classification [15]. Papers belonging to that group have used estimation methods based on fuzzy systems. A fuzzy system usually consists of a combination of a set of logical expressions with fuzzy sets used to deal with linguistic terms that derived after partitioning a dataset to a number of intervals and provide a representation scheme for dealing with uncertain, imprecise, and vague concepts [20,21]. For example in [S103], fuzzy clustering is used for segmented models. Fuzzy methods are usually used in combination with other methods.
Finally, there is also a group that includes an extensive variety of methods with 18 papers (13.9%) called Others that conveys the high diversity of estimation approaches [15]. This category includes survival analysis, multiple criteria linear programming, production function analysis, sequential quadratic programming, case studies, etc.
In contrast to Jorgensen and Shepperd results [15], no papers have been found dealing with the following methods: Expert Judgment, Work Breakdown, and Theory based-estimation approaches. This is because ISBSG does not include attributes that would support such types of research. It should be mentioned that it is valuable to complement the information obtained from data driven techniques with expert judgment in order to develop estimation methods that take into consideration the expertise component. Usually, methods that make use of all information available in organizations make practical and economic sense [S124]. For example, Dalmazo et al. [S82] merge data from ISBSG with information provided by a group of experienced IT project managers to overcome the missing data problem when building a Bayesian model.
Table 7: Number and proportion of papers for each estimation method.
Method Number of
papers
Proportion %
Machine Learning 46 35.7 Estimation by Analogy 29 22.5 Combination of Estimates 17 13.2 Function Point 8 6.2 Fuzzy 8 6.2 Simulation 3 2.3 Not relevant 7 5.4 Others 18 13.9
If the machine learning methods are analyzed in detail, this family of methods includes the approaches described in Table 8.
Table 8: Machine Learning estimation methods.
Machine Learning method Number of papers Proportion % Neural Networks (NN) 18 13.9 Model tree 10 7.7 Classification and
Regression Trees (CART)
9 7.0
Genetic Algorithms (GA) 7 5.4
Support Vector Machines (SVM) 6 4.6
Bayesian Networks (BN) 5 3.9
Association Rules (AR) 3 2.3
Others 16 12.4
Many references have used more than one of these methods and therefore, the total sum exceeds the 46 references mentioned above in Table 6. Within the Machine Learning category, the most frequently used method is Neural Networks, followed by Model Tree, Classification and Regression Trees, and Genetic Algorithms. A significant number of methods related to this category could not be classified conveniently so they were placed in the group Others. It should be mentioned that two papers within this group have used ensembles of Learning Machines.
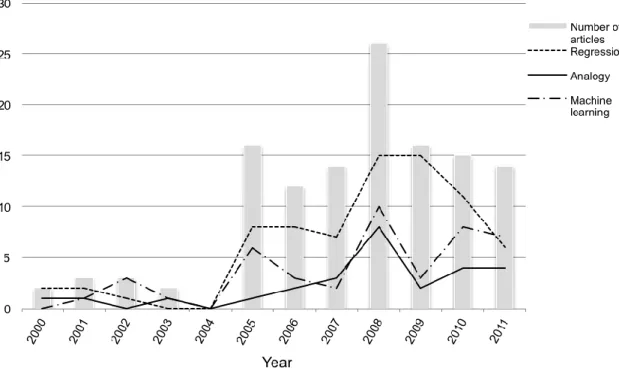
Figure 9: Evolution over time of the three most frequent estimation methods used. Fig. 9 shows the trend over time of the three main groups of estimation methods:
Regression, Machine Learning, and Estimation by Analogy methods (EbA). The estimation methods are superimposed over the number of articles published each year. It is important to note the predominance of regression methods over time, although a slight decline can be observed since 2009. Also, a boom of EbA methods during the 2007-2008 period (30.8% of the published papers) with a subsequent decline can be observed [15]. Lastly, the increasing presence of Machine Learning-based methods that also have a peak within the 2007-2008 time period (38.5%) and consolidate their presence in the identified
references can be seen.
Further analysis has been performed trying to relate trends in the usage of the more relevant estimation methods with ISBSG data to trends of these methods in the broader field of empirical software engineering. Hence, the abstract and citation database, Scopus, has been used to track the number of papers that have dealt with these estimation
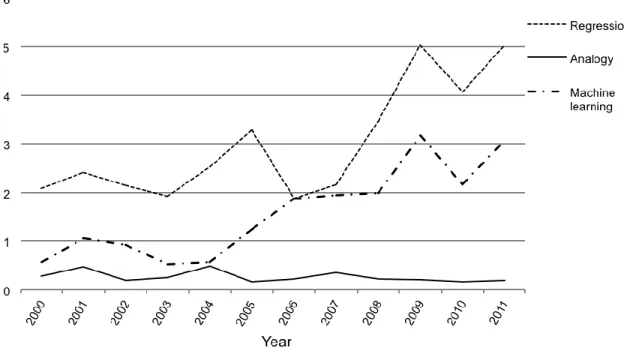
methods in all 19 journals included in Table 2. The analysis of these journals enables us to get a valid perspective on the field of empirical software engineering. The terms searched in the article title, abstract, or keywords were: “regression,” “analogy,” and “machine learning.” The results obtained are shown in Fig. 10.
Figure 10: Evolution over time of the three most frequently used estimation methods in journals with ISBSG-based research papers.
Fig. 10 depicts the percentage of papers that have worked with these methods over the total number of papers published in the mentioned journals. The trends of the more relevant estimation methods with ISBSG data somehow follow the trends obtained in the broad research field. Regression is the predominant method followed by machine learning and analogy-based estimation. There is a rising trend in regression and machine learning methods with a maximum value occurring around 2009 while analogy-based estimation methods show a more constant behavior. As an aside, the relative presence of analogy-based methods is less relevant in the realm of empirical software engineering than in ISBSG-based research. Moreover, Fig.9 shows a decrease in the use of Regression and Machine Learning methods, which is not observed in the field of empirical software engineering.
3.5. RQ5
Is ISBSG data a valuable source of data for the research undertaken in the paper? Seventy-one identified references (55%) support their research exclusively with ISBSG data while 58 papers use additional data. Fig. 11.a shows the development of the ISBSG dataset from release 4 (1997) to release 12 (2013) as well as the date each release was delivered. It is apparent that the usual interval of appearance for each release is fewer than three years except for R9 and R11, which were in place for three and four years respectively. The repository has grown from 2,000 projects out of 16 countries in 2003 (R8) to 6,006 projects included in release 12 [1,22]. The number of references that have used each ISBSG release is presented in Fig. 11.b. The most frequently used ISBSG
release is release 10 with 32 references, but release 7 (25), release 8 (22), and release 9 (23) are also oftenly used. To interpret the results of release 11 (5), it is important to keep in mind that the papers were collected until the end of June 2012.
Figure 11: ISBSG releases and the evolution of the number of papers using a specific release of ISBSG. (a): ISBSG releases over time. (b): Evolution of the number of papers using a specific release of ISBSG.
Most of the papers (43) that use additional data only employ other datasets that are in the public domain or have a limited usage [23]. Datasets with a limited usage do not allow researchers to publish the dataset in its entirety or give the dataset to other parties without the owner‟s consent because organizations pay an annual fee to gain access to the data. This is the case for the Finnish (also called the Experience dataset) or CSBSG datasets. To summarize, as many as 30 datasets are used, but only 13 are used more than once. Table 9 shows information about the most referenced datasets including the number of papers that use them, their source, whether they are public or of limited usage, and whether or not they are included in the PROMISE repository. It is worth noting that ISBSG has agreed to include some of its data in the PROMISE repository with one small subset appearing in late 2012.
Table 9: Other datasets used apart from ISBSG.
Dataset acronym Source
Number of papers Public / Limited PROMISE Desharnais [24] 20 P Y Cocomo81 [25] 14 P Y STTF = Bank63 [17] 14 P Y Kem87 [26] 13 P Y
Albrecht (& Gaffney) [27] 12 P N
Nasa93 = Cocnasa [28] 8 P Y
USP05 [S5] 7 P N
Mendes03 [29] 5 P N
Finnish = Experience [30] 4 L N
Sdr [28,31] 4 P Y
Abran & Robilard [32] 3 P N
CSBSG [33] 2 L N
On the other hand, only 15 of 58 papers make use of private data. Some use a few projects such as case studies [S70, S88, S14] while [S37] and [S126] use data from leading information technology companies and organizations, Commercial off-the-shelf (COTS) package builders, academic and professional books, and technical reports. Other authors use private datasets such as the Israeli dataset, which consists of projects from several high-tech (mostly software) companies [S47]; the Teletel dataset from a Greek telecom software company [S39], the Megatec dataset from an Australian software developer [S4], the Bank dataset from the Turkish subsidiary of a multinational bank [S20] and the Bank dataset from a financial company located in Korea [S24, S78]. In [S82] a synthetical project dataset, known real data is merged with information provided by a group of experienced IT project managers.
Only two papers combine private data with other datasets apart from ISBSG. Therefore, 45 papers use ISBSG with other non-private datasets. Within this set, 46.7% of the papers use two datasets including ISBSG, 51.1% use between three and nine datasets, and one paper uses twelve datasets.
3.5.1. Reasons for the usage of complementary datasets
The motivation behind the usage of these complementary datasets is summarized in the following:
To evaluate the performance of an estimation method [S2, S70, S114] and identifying the datasets that favor such method. In software effort estimation models, the characteristics of datasets affect the results and the overall procedure. These characteristics are considered major factors in assessing the performance of the proposed techniques [S43, S45, S76, S83]. Consequently, the structure of the dataset itself should be taken into account before judging which dataset is suitable for a particular method [S71]. For example, the predictive accuracy and the model fitting depend on the type (quantitative or non-quantitative) and number of project attributes [S3, S86], the sample size [S30, S66], or the missing data [S3, S48, S59, S73]. Consistently, 32.8% (19 out of 58) of the papers that have used
complementary datasets were previously classified in the category Dataset
Properties when the research topic was considered (RQ3) and 40.4% of the papers in this category have used other datasets to assess the influence of the nature of their data in the performance of software estimation models.
To confirm or disprove the hypothesis that there is a difference in accuracy between estimates derived from multi-company data such as the ISBSG dataset and estimates derived from company-specific data [S4, S24, S99]. Furthermore, it is necessary to gain more insight into heteroscedasticity (non-uniform variance); a problem that affects datasets that combine data from heterogeneous sources [S21, S96].
To confirm the reliability of the proposed method [S9, S12, S68, S76, S86]. A wider application to more datasets could generalize the results and reveal more insight
into the methods. Indeed, papers that make use of fewer datasets consider this as a limitation and propose to prevent this weakness by applying the method to other datasets and comparing their effects [S19, S24, S25, S30, S72, S78, S107]. Furthermore, there are some obvious reasons to use complementary datasets that are not usually explicit in the papers, but should also be considered. For example, complementary datasets should be used when they have been used by previous studies with a similar goal [S46, S77] or simply because complementary datasets are available to the authors.
3.5.2. Advantages and limitations related to the usage of ISBSG
The ISBSG data can be used for different purposes, such as evaluating the benefits of changing a software or hardware development environment, improving practices and performance, or estimation [S12, S51]. The ISBSG dataset has been used by many studies focused on the issue of software estimation in spite of the diversity of its data elements [S24, S65]. The main advantage obtained from the use of the ISBSG dataset is that it offers a wealth of information regarding practices, tools, and methodologies
accompanied by process and product data to be used in benchmarking, monitoring, control quality, and performance management purposes during the software development process [S80]. Besides, the dataset holds data for projects that address feasibility,
planning, and requirements analysis and for projects that do not address the complete life-cycle [S14].
External validity is the ability to generalize obtained findings outside the specifications of the study ([S66], [34]). External validity suffers from some restrictions that include the degree to which the selected attributes describe the projects and the representative capacity of datasets [S72]. ISBSG contains an analysis of software costs for a group of completed projects that come from a broad cross section of industry which differ in size, effort, platform, language, and development techniques data [S12, S41, S90, S107]. As a consequence, the ISBSG dataset covers a wide range of possible project attributes [S3] and application environments. Some public datasets, still widely used for comparison purposes, are too old to be used in software cost estimation because they represent nonrelevant software development approaches and technologies [S111]. This is not the case with the ISBSG dataset, which continues to grow over time to provide valuable
information. This dataset, however, represents the more productive projects in the industry, rather than industry standards, because participant organizations are considered to be among the best software development houses [S41] and also, they may have chosen to only submit their best projects rather than typical ones [S90]. Therefore, the projects have not been selected randomly and the dataset is more than likely subject to biases [S107]. Public dataset repositories provide an opportunity for diminishing data collection costs that are an expensive and time-consuming process for individual organizations [S4]. Besides, cross-company datasets are beneficial for the small-sized companies that are not
experienced in data measurement [S99]. This way, a company can select, isolate, and analyze suitable data and projects, and estimate its own new projects based on its needs
[S39]. Furthermore, datasets that are not publicly available make studies unreproducible ([S51], [35]).
There is a debate over whether multi-organizational data is valuable for estimation [S4, S24, S99]. The ISBSG data is collected from various worldwide organizations with dissimilar backgrounds, business cultures, levels of personnel experience, and
development maturity [S5, S21, S67, S107]. As a result, the dataset is widely scattered and inconsistent, which effectively presents the problem of divergences of variances [S21, S71]. This portrays a clear limitation of data repositories such as the ISBSG dataset. This large variation of data distribution, however, is also one of the characteristics of the data collected from single-company with an unstable software process [S24]. In any case, heterogeneity makes it difficult to obtain accurate predictions [S4, S24, S77, S78]. On the other hand, cost estimation includes many statistical methods (regression, ANOVA, etc.) whose basic assumption is the independence of projects. This premise is satisfied in large cross-organizational datasets since projects come from different companies around the world [S17].
Experiments with ISBSG enable the comparison between estimation method
performances [S2]. Since ISBSG projects used for calibrating estimation models may be different than the types of projects under consideration, this may be a potential source of error [S87]. Furthermore, multi-organizational datasets are not easily usable for non-contributing companies to establish their effort estimation models [S80]. In case it is necessary to predict effort by using the ISBSG repository for a non-contributing company, OLS regression should be considered rather than analogy [S4]. Besides, models
occasionally would need to be recalibrated on newly collected data, as relationships between attributes can change over time [S51].
The effectiveness of historical datasets in the generation of prediction models is critically dependent on the nature of the data within the dataset [S84, S124]. Therefore, the dataset quality and variance are influential factors. Since the ISBSG repository is a large
heterogeneous dataset, a data preparation process is required to obtain the appropriate subset for analysis [S24, S49, S98, S114]. This is consistent with the ISBSG guidelines that suggest basing the analysis on a suitable subset of projects [S11, S19, S83].
First of all, the dataset should undergo a data cleaning process based on quality criteria. Fortunately, project entries in the dataset are validated by the ISBSG organization against specific quality criteria [S4] for completeness and integrity. A quality rating for the
credibility of each project is given in order to achieve the grade of usefulness of the data for various analyses [S30, S107]. Usually the projects with low data quality ratings, i.e. C or D, are excluded from analysis [S87, S88].
Next, the most representative data should be identified and selected while attributes and projects with no direct or apparent effect on software estimation are ignored [S45, S107]. For example, in [S21], the size measurements are considered the main driver of project effort, so the dataset is cleaned for homogeneity for this aspect. This selection process
can be supported by the normality and correlation test and data normalization [S24]. In most cases, features are selected using brute-force and other forms of search heuristics. Since this requires a large amount of computing power and time, it is especially
problematic when dealing with large datasets [S65]. Moreover, generally, learning from a smaller dataset, containing a limited set of highly predictive attributes, is easier than learning from a bigger, noisier dataset containing many redundant or irrelevant attributes. This way, the resulting models will contain less attributes and will be also more stable since potential collinearity between attributes will be reduced. Thus, a more concise model is easier to interpret and preferred over a more complex model [S51].
ISBSG is a dataset with projects characterized mostly by a mixture of categorical [S87, S114], continuous, and discrete attributes [S41]. The dataset contains many missing and outlier values [S76]. Handling incomplete data is an important issue faced by researchers who use industrial and research datasets. This is the case within ISBSG, which suffers from a large amount of missing data requiring imputation and other missing value
techniques [S44, S65, S114]. Listwise deletion, however, has been the most common way of dealing with missing data. Projects that have missing values for any effort driver are usually excluded from the dataset for modeling [S90]. In ISBSG, the large number of missing values in almost all of the important variables can result in a significant reduction of the data used to build the model [S19, S114], leading to a severe loss of statistical power. It is also argued that removing projects with missing values could risk losing valuable information [S76].
On the other hand, a multi-company dataset such as ISBSG also suffers from the
presence of more outliers in comparison to a single-company dataset [S24]. In general, the presence of outliers in a dataset tends to increase the value of the standard error of
estimation [S47]. Furthermore, there is neither data related to the experience of the software developers, nor any parameter that identifies the company or gives information about the organization type of the company in the repository [S4]. Consequently, it is more difficult to form homogeneous subsets which can result in significantly more accurate estimates.
Ultimately, data partitioning is considered necessary in preprocessing due to data variance [S43]. In this sense, the high number of projects makes it possible to prune the ISBSG dataset into subsets with several requirements [S2, S21, S73, S90]. For example, in [S24], the authors consider it better to use the dataset after categorization according to similar characteristics, such as business domain, in order to obtain a more accurate estimation result. In [S9], a new cross-domain dataset is formed from the ISBSG dataset by selecting the projects whose application types are not embedded. Although homogenous datasets can be formed from the original one, projects in the ISBSG dataset still have greater variation in system size, development effort, and productivity [S70]. Furthermore, the estimation results obtained from the ISBSG model are not so promising when compared to organization's own estimation model results [S80]. To overcome the effect of heterogeneity, some authors have eliminated extreme points [S21].
4. Discussion
This section summarizes the principal findings of this systematic mapping. It also includes the limitations of the study and discusses the implications for researchers and practitioners. 4.1 Principal findings
This study shows the extent to which and how ISBSG has been used by software engineering researchers until June of 2012. Thereby, the papers that have worked with this dataset have been identified and classified by answering a set of research questions. This systematic mapping review conveys a picture of the potential and limitations of ISBSG as a research facility.
The search term “ISBSG” was the input for four bibliographic databases: IEEE Xplore, ACM Digital Library, ScienceDirect, and Web of Knowledge. This resulted in 134, 63, 57, and 52 results respectively. A complementary search was performed within the journals only indexed in the Web of Knowledge, and as a result, 21 additional papers were included. The search was completed in June 2012. After the elimination of duplicates and the
filtering process, the most relevant information was obtained from each of the 129 remaining studies.
Sixty-two of the remaining 129 papers are articles published in 19 journals. Forty-eight percent (48.4%) of papers are included in the Journal of Systems and Information (11 papers), Information and Software Technology (10 papers), and Empirical Software Engineering (9 papers) journals. The conference papers (67) were presented in 40 conferences. PROMISE, METRICS, and ESEM encompass 26.9% of the identified conference papers. The first papers were published in the year 2000 and following an introductory period, there was a period from 2005 to 2011 with a nearly constant total presence of this type of research either in conferences or journals, with an average of 16 publications, reaching a maximum of 26 references in 2008.
There are 44 identified papers (35.8%) in the period 2000-2011 that have received at least one citation in journals. Only five papers have received six or more citations. All in all, they have received 134 citations. ISBSG holds a list with the research papers that have used, or refer to, the ISBSG repositories. This list contains as many as 45 references. Only 12 papers of the total 129, however, have been submitted to the ISBSG list. Besides, it can be noted that some references listed have not been retrieved in the collecting process explained in this paper. This fact is justified because the references that have not been retrieved are, in most cases, documents that were not considered here, i.e., PhD thesis. Greater efforts should be completed to promote and update the ISBSG list. Also,
researchers should always contact ISBSG after publishing any relevant work.
As many 91 papers (70.5%) focus on effort variable and in a few cases (5.4%) they share the focus with another target variable. Twenty-two percent (22.5%) of the papers center their research in a construct or variable different from effort and 7% do not focus on any
target variable. The most common research topic is Estimation methods (70.5%). The second largest category is Dataset properties (36.4%), which begins to appear noticeably from the year 2005. In more detail, clustered data and missing data are the most
investigated issues in this category. From 2010, there is a renewed interest of researchers in estimation methods and dataset properties.
In regards to the estimation methods, it is important to note the predominance of regression methods over time (61.2%) followed by machine learning (35.7%) and estimation by analogy (22.5%) estimation methods. These final two methods present a renewed presence since 2008 meanwhile the interest in regression methods seems to have declined slightly. Within the Machine Learning category, the most used methods are Neural Networks, followed by Model Tree, Classification and Regression Trees, and Genetic Algorithms.
Finally, 71 identified references (55%) support their research exclusively using ISBSG and 58 papers also use additional data. The most used ISBSG release is release 10 with 32 references. Most of the papers (43) that use additional data, employ other datasets that are in the public domain or have a limited usage. All in all, as many as 30 datasets are used, but only 13 are used more than once. On the other hand, only 15 out of 58 papers make use of private data. The principal reasons, derived from the analysis of these 58 papers, for the motivation behind the usage of complementary datasets are: to compare the performance of an estimation method, to confirm or disprove the hypothesis that there is a difference in accuracy between estimates derived from multi-company data and estimates derived from company-specific data, and to confirm the reliability of the proposed method. Additionally, in many papers (32.8%), complementary datasets have been used to deal with problems related to the dataset data properties.
Public dataset repositories provide an opportunity to diminish data collection costs that are an expensive process for individual organizations. The main benefit obtained from the use of the ISBSG dataset is that it offers a wealth of information regarding practices, tools, and methodologies accompanied by process and product data to be used in benchmarking, monitoring, control quality, and performance management purposes during the software development process. This body of knowledge enables learning from experience through analysis and research, and disseminating the lessons learned.
Some of the ISBSG drawbacks include that the best projects have been selected and the dataset most probably is subject to biases. Since the ISBSG repository is a large
heterogeneous dataset, a data preparation process is required to obtain the appropriate subset for analysis. First, the dataset should undergo a data cleaning process and the most representative data should be selected [36]. ISBSG also suffers from a large number of missing data which requires imputation and other missing value techniques. Ultimately, the partitioning of data is considered necessary in preprocessing due to the variance of data.
It is important to consider that the results obtained from a systematic mapping study could be affected by the researchers conducting the review, by the selected search term, and by the chosen time frame [13]. Some limitations of this systematic mapping have been
identified and are discussed below.
The first limitation concerns the search strategy employed. In an attempt to address this limitation, detailed information regarding the specific search term and databases used was reported previously in Section 2.2. On one hand, this work is based on automatic searches performed using the native database search engines, which means some papers might have been lost. This threat, however, was mitigated by selecting search engines which have been considered as the most important scientific sources and therefore are
supposed to contain a majority of the relevant studies [37]. The searches were also cross-checked by the authors of this study. To further mitigate this threat, references of each document in the set of selected papers should have been considered using the ISBSG dataset.
On the other hand, a broad overview of the research area was desired, thus no limits were placed on date of publication and the number of restrictions was minimized on primary study selection to be as inclusive as possible. No logical operators were used and the unique search term („ISBSG‟) was applied not only to the papers title and abstract, but also to the body of the text. By using this method, it is likely that most of the relevant papers have been included. At this point, it is appropriate to clarify that the search within the full document record was not possible in papers indexed in the Web of Knowledge.
Consequently, an additional search was performed within the journals only indexed in the Web of Knowledge, using their publisher‟s search engine. Then, further work was
performed to dismiss those articles that only mention ISBSG or use it as an example and in turn, select only the papers that use ISBSG as a primary source of data (i.e., dataset) as was mentioned in the detailed description of inclusion and exclusion criteria.
It is important to mention that some more recent studies may be missing because the search engines may not have indexed them. Furthermore, the articles were only collected until the end of June 2012. Finally, exclusion of papers written in a language other than English may have lead to a bias in the selection process. This could not be avoided due to the impossibility of the revision team to address these languages.
The second limitation concerns bias in the data collection. The first information collected was about the identification and general details of the paper such as the title, its authors, the paper type, the source where it was published, year of publication, abstract, and keywords. Zotero, a bibliographic management system, was used to collect data and later this information was exported to a standard worksheet format using SQL (Structured Query Language).
Difficulties extracting relevant information from the papers were encountered since many did not provide substantial information in the abstract or keywords to facilitate the analysis
of the mapping process. In those cases, it was necessary to also read the introduction and conclusion sections and sometimes, even other sections of the primary study, to properly fulfill the data collection form. The data was extracted by the two authors and an additional cross-check was performed.
Another limitation is in regards to the classification of the primary studies. In an attempt to limit this constraint, existing classifications were reused as much as possible. The
research topic and estimation method classifications were based on Jorgensen and Shepperd work [15], but it was necessary to adapt them especially for the estimation methods to ensure the latest methods would be included.
Despite using this precaution, the problem still remained and in order to reduce the risk of introducing a bias in paper classification, the classification was performed by the two authors to reach an agreement in problematic cases. It should also be mentioned that English is not the native language of the authors involved in this research.
There is also a limitation concerning research question 2 (RQ2), which presents the
number of citations that the papers have received in the dataset because only the citations received in the journals in the dataset have been considered. This problem has been mitigated by contrasting this information with the number of citations that appear in Google Scholar. The fact that some studies were classified in more than one category appears as a potential problem for the descriptive statistics in RQ3. In addition, some of the authors of the identified references used diverse terms to identify the estimation methods because there is no standard terminology (RQ4).
4.3. Implications for research and practice
The findings of this systematic mapping study have implications for both researchers who are planning new studies using ISBSG and for practitioners working in the software engineering field.
This study can help researchers make informed decisions about the trending topics, most commonly used variables, and promising methods. This information will help them to assess the originality and potential value of a research proposal. Further, the selected set of papers constitutes a useful background to contrast and learn from previous perspectives. Researchers are also provided with the journals and conferences that, by now, can help them to disseminate their results. In this line, the ISBSG dataset remains interesting and offers potentially valuable research possibilities.
Certainly, the most studied ISBSG variable is effort followed by productivity, defects, and duration. With this in mind, the nature of the data in ISBSG may explain the reduced number of defect-related papers. Also, the most common research topic is by far estimation methods, followed by the study of dataset properties and the calibration of models. In fact, there is a need to continue studying the data nature (ambiguities, wrongly recorded values, missing values, unbalanced datasets, etc.) and their preliminary analysis