DOCUMENT RESUME
ED 424 807 HE 031 602
AUTHOR Xiao, Beiling
TITLE Factors Influencing Master's Degree Attainment in Business,
Engineering, Health and Human Sciences, and Visual and Performing Arts. AIR 1998 Annual Forum Paper.
PUB DATE 1998-05-00
NOTE 24p.; Paper presented at the Annual Forum of the Association
for Institutional Research (38th, Minneapolis, MN, May
17-20, 1998).
PUB TYPE Reports Research (143) Speeches/Meeting Papers (150)
EDRS PRICE MF01/PC01 Plus Postage.
DESCRIPTORS *Age Differences; Art Education; Business Education;
*Educational Attainment; Engineering Education; *Graduate Students; Graduate Study; Higher Education; *Intellectual Disciplines; *Masters Degrees; Medical Education;
Universities
IDENTIFIERS *AIR Forum
ABSTRACT
This study examined factors influencing master's degree attainment in various disciplines. Discrete-time survival analysis was used to examine the records of 3,189 graduate students in business, engineering, health and human sciences, and visual and performing arts at a large
midwestern university for 6 years. It was found that 2,070 students had received a master's degree within 6 years. Students in business tended to receive their master's degrees later than did students in the other three areas, while students in health and human sciences received their degrees more quickly. Older graduate students took more time to receive their degrees
than younger students. It was also found that first-semester grade-point average had a significant positive effect on degree attainment, while gender, Graduate Record Examination (GRE) scores, and Graduate Management Admission Test (GMAT) scores had no impact on master's degree attainment. Five data
tables and four figures appended. (Contains 19 references.) (MDM)
******************************************************************************** Reproductions supplied by EDRS are the best that can be made
from the original document.
.0
Factors Influencing Master's Degree Attainment
in Business,
Engineering, Health and Human
Sciences, and Visual and Performing Arts
Bei ling Xiao
Research Associate, Institutional Research
Northern Illinois University
Mailing Address: Institutional Research
Northern Illinois University
De Kalb, IL 60115
Telephone Number: (815)753-6008
BEST COPY AVAILABLE
2
1U.S. DEPARTMENTOF EDUCATION
Office of Educational Researchand Improvement
EDUCATIONAL RESOURCESINFORMATION
CENTER (ERIC)
O This document hasbeen reproduced as received frorn the person or organization originating it.
O Minor changeshave been made to improve reproduction quality.
Points of view or opinionsstated in this document do not necessarily represent official OERI position orpolicy.
PERMISSION TO REPRODUCE AND DISSEMINATE THIS MATERIAL HAS
BEEN GRANTED BY
A1P.
TO THE EDUCATIONAL RESOURCES INFORMATION CENTER (ERIC)
AR
for Management Research, Policy AnalysZs, and PlanniV
This paper was presented at the Thirty-Eighth Annual Forum
of the Association for Institutional Research held in
Minneapolis, Minnesota, May 17-20, 1998.
This paper was reviewed by the AIR Forum Publications
Committee and was judged to be of high quality and of
interest to others concerned with the research of higher
education. It has therefore been selected to be included
in the ERIC Collection of AIR Forum Papers.
Dolores Vura
Editor
Factors Influencing master's Degree Attainment in Business, Engineering,
Health and Human Sciences, and Visual and Performing Arts
ABSTACT
The present study examined factors influencing master's degree attainment process by following a
sample of 3,189 graduate students
in Colleges of Business, Engineering and Engineering Technology, Health and Human Sciences, and Visual and Performing Arts in a large Midwestuniversity for six years. Discrete-Time Survival Analysis was used in the analysis. Two hundred
and seventy-six students were censored due to follow-up time limitation. Twenty hundred and
seventy students (71.1%) received a master's degree within six years. Eight hundred and
forty-three students (28.9%) dropped out of graduate school or transferred to another institution.
Master's degree attainment progress was significantly different among colleges. Students in
Business tended to receive their master's degree slower than students in the other colleges in the
sample. Students in Health and Human Sciences tended to receive their master's degree faster than
students in the other three colleges. Older graduate students took more time to get their master's
degree than younger students. First semester cumulative GPA had a significant effect on the degree
attainment process. Overall, gender, GRE Verbal score, GRE Quantitative score, GRE Verbal
score and GRE Quantitative score combined, and GMAT score had no impact on the master's
degree attainment process.
FACTORS INFLUENCING MASTER'S DEGREE ATTAINMENT
Factors Influencing master's Degree Attainment in Business, Engineering,
Health and Human Sciences, and Visual and Performing Arts
Survival analysis techniques (Cox, 1972; Cox & Oakes, 1984; Miller, 1981) have been developed for studying the occurrence and timing of events. Survival analysis can easily handle data with censored
observations. Increasing number of studies applied survival analysis in educational research in recent years (Singer & Willett, 1993; Singer, 1993; Braun & Zwick, 1993; Willett & Singer, 1995; DesIardins & Pontiff, 1997; DesJardins, Ahlburg, & McCall, 1997; Xiao, 1997). Several studies (e.g., Zwick, 1991; Zwick & Braun, 1988) applied discrete-time survival analysis to examine the graduate school careers of students in various academic programs, for instance, at what pace does students reach milestones (e.g., advancement to candidacy, attainment of the Ph.D. degree) in their graduate careers. Civian (1990) used survival methods to study degree progress among students at the Harvard University Graduate School of Education. Ronco (1996) applied discrete-time survival analysis to study undergraduates' enrollment behavior--graduating, transferring, or dropping out. The study found that ethnicity (Hispanic vs. Non-Hispanic) was the only time-invariant variable significantly associated with graduating, transferring, or dropping out. Moore (1994) emphasized the role of discrete-time survival analysis in higher education enrollment management to identify who would need retention intervention, and when these students needed the intervention. Xiao (1997) found that gender, age, the first semester
cumulative GPA, and GRE Verbal score had an impact on the Master of Science degree attainment process. Females tended to earn degrees faster than male students. Older students took more time to get their degree than their younger counterparts. The first semester cumulative GPA had positive effect on degree conferring.
However, GRE verbal score had negative effect on degree conferring progress.
The present study intended to examine factors influencing master's degree attainment process in several discipline areas, and to examine whether college in which students chose to enroll had an impact on master's degree attainment. Demographic variables (such as college, gender and age) were included as independent
variables that might influence degree attainment process. Some academic background and admission test variables (GPA, GRE/GMAT scores) were also included as independent variables in the analysis.
Method
Students
The present study followed 3,189 students in four colleges---Business (BUSI), Engineering and Engineering Technology (ENGR), Health and Human Sciences (H&HS), and Visual and Performing Arts (V&PA), who started graduate programs in the fall semesters of 1987 through 1994 in a large Midwest public university. The students were followed for up to six years. There were 1,586 in BUSI, 269 in ENGR, 751 in H&HS, and 583 in V&PA when the students started their graduate programs; there were 1,566 male students and
1,623 female students. The median age of the students when they started their graduate program was 27 years.
Data
Each student's record contained demographic information, admission test scores (GRE-V, GRE-Q, GRE-V&Q, or GMAT), academic grades in the present graduate program, and persistence and degree conferred information for up to six academic years. Data in summer semesters were combined with data in fall semesters. Degrees conferred in the summer semesters were treated as if they were conferred in the spring semester. Thus in the present study each academic year consisted of two semesters. Students' persistence and degree conferred information was recorded for up to 12 semesters.
Analysis Strategies
Discrete-Time Survival Analysis using SAS LOGISTIC procedure (Singer & Willett, 1993) was used in the present study to examine the master's degree attainment process. The original person data was converted into person-period data (Figure 3 in Singer & Willett, 1993). In the new person-period data set, the ith person has J, records, where J was the last period a person experienced. The time period in the present research was
"semester". Nine discrete-time hazard models were developed to examine the master's degree conferring
3
FACtORS INFLUENCING MASTER'S DEGREE ATTAINMENT
progress. The dependent variable was the logic of the hazard of conferring a master's degree. The independent
variables were the time indicators, and the time indicators and each of eight variables assumed to affect the degree
conferring process: college, gender, age, cumulative GPA at the end of the first semester, GMAT score, GRE-V score, GRE-Q score, and GRE-V and GRE-V&Q scores. The eight models are:
Model A: Logite(h) = a,D,u + a2D21 + + a,Dju
Model B: LogitAhd = (a,Diu + a2D2u + + a,D4) + bi(GOLLEGE)u
Model C: Logite(hu) = (a1D111 + a2D2u + + + b,(GENDER)u
Model D: Logit,(h) = (a,D,u + a2D21 + + + b,(AGE)u
Model E: Logit,(hu) = (a,D,u + a2D2u + + ap,u) + b,(GPA)u
Model F: Logit,(hu) = (a1D,u + a2D2u + + a,Dju) + b,(GMAT)u
Model G: Logit,(hi) = (a,D,u + a2D2u + + a,D,u) + b,(GRE-V)u
Model H: LogitAd = (a1D1u + a2D2u + + alp,u) + b,(GRE-Q)u
Model I: Logit,(hu) = (a1D,u + a2D2u + + a,D,u) + b,(GRE-V&Q)u
where D, are a sequence of dummy variables indexing time periods. The J refers to the last time period observed
for anyone in the sample. The a, and b, are the parameters. Variables COLLEGE, GENDER, AGE, GPA, GMAT, GRE-V, GRE-Q, and GRE-V&Q are all categorical-variables in the above models. Each of the continuous variables is coded into two categories: AGE: Age < 24, and Age> = 24; GPA: GPA < 3.0, and
GPA > = 3.0; GMAT: GMAT < 500, and GMAT > = 500; GRE-V: GRE-V < 470, and GRE-V > = 470;
GRE-Q: GRE-Q < 510, and GRE-Q > = 510; GRE-V&Q: GRE-V&Q < 990, and GRE-V&Q > =990.
The hazard probability is calculated according to the following formula:
4
7
1
=
1+e-
(criD,u+a,D,y4 ajD,j+fliZ,y)where Z1 is any one of the independent variables other than the tinge indicators, and the survival probability is estimated using the following formula:
A S=
k=1
1 hk)
Model A examines the relationship between hazard to receive a degree and the semester time indicators, which serves as the baseline for determining whether other variables influence the event (receiving a master's degree). Model B through Model I are different from Model A in that each of them has included one more independent variable into the model. The change in the goodness-of-fit statistics (-2 log Likelihood) between Model B, C, D, E, F, G, H, I and the baseline model A tests the main effect of college, gender, age, GPA, GMAT, GRE-V, GRE-Q, and GRE-V&Q on degree conferring process, respectively.
Results
Results of the discrete-time survival analysis showed that college, age, and the first semester cumulative GPA had an impact on the master's degree attainment process. Students in Business tended to receive their master's degree slower than students in other colleges in the sample. Students in Health and Human Sciences tended to receive their master's degree faster than students in the other three colleges. Older students took more time to get their degree than their younger counterparts. The-first semester cumulative GPA had positive effect on degree conferring process. The present study found that after 2.4 years in their graduate programs, 50% of students received a master's degree. It also found that students were most likely to receive a master's degree at the fourth and the sixth semester in graduate program.
Table 1 lists gender and college break down of the whole sample when students started their graduate programs. Table 2 shows the number of students who received their first master's degree by gender and college.
FACTGRS INFLUENCING MASTER'S DEGREE ATTAINMENT
During the six academic years, 2,070 students received their first master's degree (71.1%), 843 students dropped out or transferred to other institutions (28.9%). Two hundred and seventy-six were censored due to follow-up time limit.
Insert Table 1 and Table 2 about here
Degree Attainment
When examining the degree attainment process, students who dropped out of graduate school or students who were still in graduate program but had not received a master's degree when the data collection ended were treated as censored. Table 3 shows the master's degree attainment process for the combined sample. The third column of Table 3 lists the number of students who received a master's degree during each time period (semester). The numbers of dropouts and censored due to time limitations are also listed in the table. The number of degrees
conferred was larger for the fourth through sixth semesters in the graduate programs. The last column of Table 3
lists the proportion of students who were still in school and had not yet received a master's degree at the beginning of a semester, but subsequently received a master's degree during that semester. The proportion was
larger for the fourth and the sixth semesters. For the whole students sample, the proportions were 38.0% for the
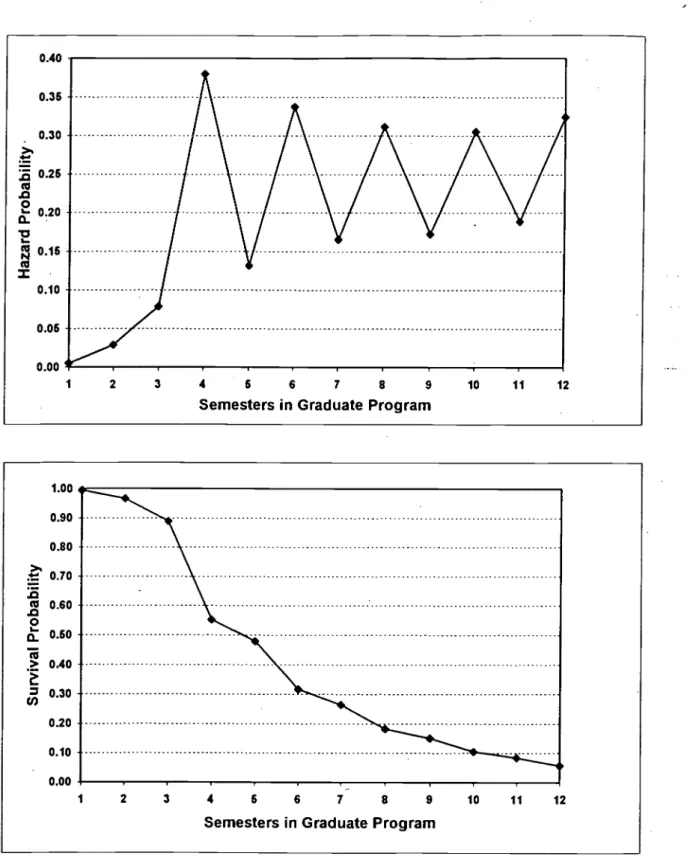
fourth semester and 33.8% for the sixth semester. Figure 1 shows the fitted Hazard probability and survival probability curves for the whole sample. The hazard probability shows the probability that a student still in graduate program receiving a master's degree in a particular time period (semester). The survival probability
curve in Figure 1 shows the probability of students in the sample having not received a master's degree. The opposite of the survival probability (one minus the survival probability) is the probability of students having
received degree.
Insert Table 3 about here
EST COIPY MAMA LE
Insert Figure 1 about here
Factors Influence degree Attainment Process Other Than Time Indicators
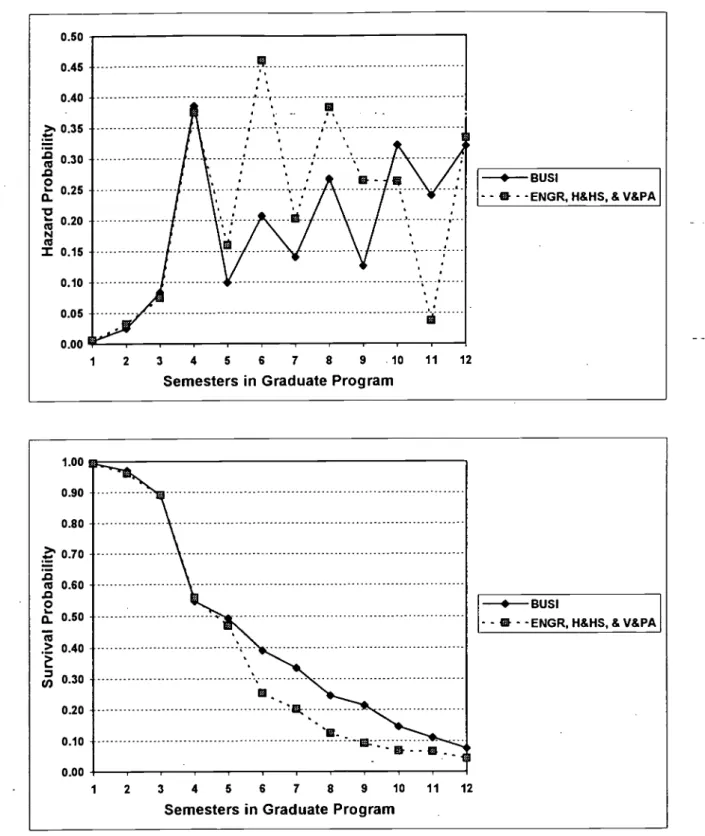
Table 4 lists results for examining the significance of factors assumed to influence the master's degree attainment process for the whole sample. It shows the goodness-of-fit statistics for the hazard models fitted to the master's degree attainment data for Models B, C, D, and F. Column 2 of Table 4 lists the -2 logL values of Model Athe baseline model that tests the effect of the time indicators alone. Column 3 lists the -2 logL values of Model B, C, D, and Ethe models that test the effect of the time indicators and college, gender, age, and GPA, respectively. The last two columns of Table 4 lists the x2 test results (change in -2 LogL from the baseline models to the models that a main effect was added) to test the main effect of college, gender, age, and GPA. Students in BUSI used longer time to receive a master's degree than students in ENGR, H&HS, and V&PA (p < .0001). While students in H&HS finished their master's degree faster than the other three colleges (BUSI,
ENGR, and V&PA) < .0001). Figures 2a and 2b show fitted hazard and survival functions containing the
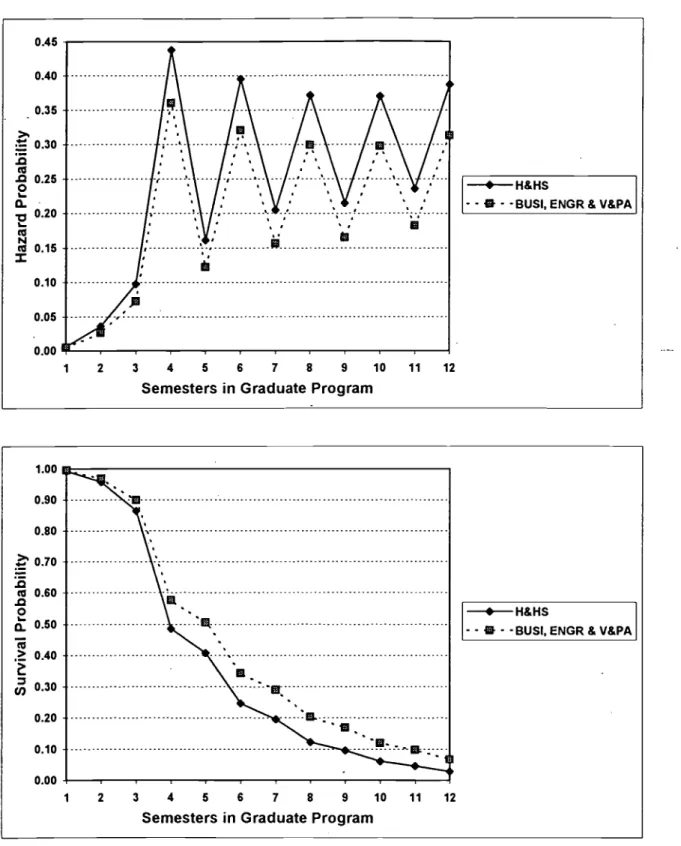
main effect of the time indicators and college: BUSI vs. the other three collegesENGR, H&HS, and V&PA (Figure 2a); and H&HS vs. the other three collegesBUSI, ENGR, and V&PA (Figure 2b). AGE and GPA had an impact on the degree attainment process. Younger students took less time to finish their master's degree than their older counterparts (p < .0001). Higher GPA students took less time to finish their degree than lower GPA students (p < .05). Figure 3 shows the fitted hazard and survival functions describe the degree attainment process containing the main effect of the time indicators and AGE. Figure 4 shows the fitted hazard and survival
functions describe the degree attainment process containing the main effect of the time indicators and GPA. Gender did not significantly influence the degree attainment process.
Insert Table 4, Figures 2a, 2b, Figure 3, and Figure 4 about here
FACTORS INFLUENCING MASTER'S DEGREE ATTAINMENT
Similar to Table 4, Table 5 lists results for examining the significance of factors assumed to influence the
master's degree attainment process for each of the four collegesBUSI, ENGR. H&HS, and V&PA. Column 2
of Table 5 lists the -2 logL values of the baseline model that test the effect of the time indicators alone. These
values are different even within one college. This was because a few students did not have a GRE or GMAT
scores and were excluded from the analysis when calculating the baseline model for testing the GRE/GMAT
effect. As can be seen in the last column of Table 5, AGE played an important role in influencing the degree
attainment process for students in BUSI and H&HS, but was not significant for students in ENGR and V&PA.
The impact of GPA on degree attainment process was no longer significant in any of the four colleges. Gender
had no significant effect on degree attainment process for three colleges (ENGR, H&HS, and V&PA). The
gender variable had significant effect in BUSI (p < .05) in which male students received a master's degree faster
than female students. None of the GRE variables had significant effect on master's degree attainment process,
except for in ENGR, in which GRE-V and GRE-V&Q had significantly negative effect on degree attainment process (p < .05). In ENGR, students who had higher GRE-V or higher GRE-V&Q scores took more time to
receive their master's degree than students who had lower GRE-V or lower GRE-V&Q scores.
Insert Table 5 about here
The Median Lifetime to Receive a Master's Degree
In Figure 1, if one draws a horizontal line from the 0.50 point of the survival probability, it intersects the
survival probability curve. That intersect point corresponds to 4.7 semesters (semesters in program). After an
average 4.7 semesters, 50% of the students would still have not received a master's degree. In other words, in
4.7 semesters, 50% of the students had already received a master's degree. This is called the median Lifetime.
When the sample survival function equals .50, half students had received a master's degree and half had not. The
estimated median lifetime to receiving a master's degree was 4.7 semesters, or 2.3 years for the whole sample.
The estimated values of the median lifetime for BUSI, ENGR, H&HS, and V&PA were 4.9, 4.7, 4.0, and 4.6
11
semesters, respectively. The estimated median lifetime was 3.8 semesters for students younger than 24 years old and was 5.1 semesters for students whose age was at least 24 years old. The estimated median lifetime was 5.4 semesters for students whose GPA was less than 3.0 and was 4.7 semesters for students whose GPA was at least 3.0.
Discussion
The present study examined the master's degree attainment process using discrete-time survival analysis and demonstrated that Discrete-Time Survival Analysis was a useful tool for analyzing event occurrence in educational research. The results of the present study founded several demographic factors (age, gender) and several academic background factors (college enrolled, first semester cumulative GPA) that influenced master's degree attainment process. The kudy also found that the GRE/GMAT scores had no significant influence on students' degree attainment process.
Survival analysis is useful for analyzing student career data. By constructing hazard models of students' progress, it can examine student's degree attainment process. By using these techniques, one can determine at which stage students tend to finish their degree. One can also analyze the dropping out patterns of students. As Willett and Singer (1991) pointed out, "survival methods offer educational researchers much more than just a sophisticated data analytic approach--they offer a unified framework for appropriately modeling the many paths real students take through real schools" (p.427). The present survival analysis used only time-invariant variables such as gender, age, GRE scores. The invariant variables are constant over time periods. However, time-varying predictors (such as the amount of financial aid, part-time or full-time status, and educational or psychological interventions) usually vary over time periods and can easily be included in discrete-time survival analysis (Singer & Willett, 1993).
Many studies have examined the effect of GPA and GRE scores on degree completion behavior. Onasch (1994) studied a sample of 100 students who received an M.S. degree in Geology found that the results did not show any strong relation between undergraduate GPA, GRE scores, and degree completion time. However,
FACTORS INFLUENCING MASTER'S DEGREE ATTAINMENT
students with higher undergraduate GPA took less time to receive their degrees than those with low undergraduate GPA. Higher GRE scores predicted a longer time to receive an M.S. degree. Onasch (1994) suggested that awarding financial aid based primary on applicants' undergraduate GPA, not GRE scores. House and Joimson (1992) failed to find any significant relationship between GRE scores and the time needed to complete a master's degree in psychology. Sternberg and Williams (1997) found that the GRE did not predict second-year grades or any of the other indicators of graduate school successthe ability to think analytically, creativity, and practically, the capacity to teach and conduct research, and the quality of one's dissertation. The present study did not find any significant influence of GRE/GMAT scores on degree attainment process. The present study also confirmed Xiao's (1997) study in that age and the first semester cumulative GPA had significant influence on degree attainment process. However, The present study did not consider whether students enrolled as full-time or part-time in their graduate programs. The difference in degree attainment process might partially due to full-part-time/part- full-time/part-time status. Future studies will need to control students' enrollment status. The findings from the present study also have implications for selecting graduate applicants in these discipline areas.
13
References
Braun, H. I. & Zwick, R. Z. (1993). Empirical Bayes analysis of families of survival curves: Applications to the analysis of degree attainment. Journal of Educational Statistics, 18, 285-303.
Civian, J. T. (1990). Using proportional hazard models to examine time to doctorate. Unpublished doctoral dissertation, Harvard University, Cambridge, MA.
Cox, D. R. (1972). Regression models and life tables. Journal of the Royal Statistical Society, Series B, 34,
187-202.
Cox, D. R., & Oakes, D. (1984). Analysis of survival data. London: Chapman & Hall.
DesJardins, S. L.& Pontiff, H. (1997, May). Tracking University of Minnesota-Twin Cities "Dropouts". Paper presented at the Association for Institutional Research 37th Annual Forum, Lake Buena Vista, Florida. DesJardins, S. L., Ahlburg, D. A., & McCall, B. P. (1997, May). Using Event History Methods to Model the Different Modes of Student Departure from College. Paper presented at the Association for Institutional Research 37th Annual Forum, Lake Buena Vista, Florida.
House, J. D., & Johnson, J. J. (1992). Predictive validity of graduate record examination scores and
undergraduate grades for length of time to completion of degree. Psychological Reports, 71, 1019-1022.
Miller, R. G. (1981). Survival analysis. New York: Wiley.
Moore, P. S. (1994). The role of discrete-time survival analysis in higher education enrollment management. Unpublished doctorate dissertation, University of South Carolina, Columbia, SC.
Onasch, C. (1994). Undergraduate grade point average and Graduate Record Exam scores as predictors of length of enrollment in completing a master of science degree. (ERIC No: ED375739).
Ronco, S. L. (1996). How enrollment ends: Analyzing the correlates of student graduation, transfer and dropout with a competing risks model. The Association for Institutional Research Professional File, 61 Summer. Singer, J. D. (1993). Are special educators' career paths special?: Results from a 13-year longitudinal study.
Exceptional Children, 59, 262-279.
1
FACTORS INFLUENCING MASTER'S DEGREE ATTAINMENT
Singer, J. D. & Willett, J. B. (1991). Modeling the days of our lives: Using survival analysis when designing and analyzing longitudinal studies of duration and the timing of events. Psychological Bulletin, 110(2), 268-290.
Singer, J. D. & Willett, J. B. (1993). It's about time: Using discrete-time survival analysis to study duration and timing of events. Journal of Educational Statistics, 18, 155-195.
Sternberg, R. J., & Williams, W. M. (1997). Does the Graduate Record Examination predict meaningful success in the graduate training of Psychologists? A case study. The American Psychologist, 52, 630.
Willett, J. B., & Singer, J. D. (1995). It's déjà vu all over again: Using multiple-spell discrete-time survival analysis. Journal of Educational Statistics, 20, 41-67.
Xiao, B. (1997, May). Using Discrete-Time Survival Analysis to Examine Time to master of Science Degree Attainment. Paper presented at the Association for Institutional Research 37th Annual Forum, Lake
Buena Vista, Florida.
Zwick, R. (1991). An analysis of graduate school careers in three universities: Differences in attainment patterns across academic programs and demographic groups (GRE Board Professional Report No.
86-21p, ETS Research Report No. 91-17). Princeton, NJ: Educational Testing Service.
Zwick, R., & Braun, H. I. (1988). Methods for analyzing the attainment of graduate school milestones: A case study (GRE Board Professional Report No. 86-3p, ETS Research Report No. 88-30). Princeton, NJ:
Educational Testing Service.
1 5
Table 1
Gender and initial colleges of students pursuing master's degree in Business,
Engineering and Engineering technology, Health and Human Sciences, and Visual and
Performing Arts in a Midwest university
(Fall 1987 through Fall 1994 cohorts combined)
Engineering Health Visual
and and and Engineering Human Performing
Business Technology Sciences Arts Total
Female 1,022 223 71 250 1,566 Male 564 46 680 333 1,623
Total 1,586 269 751 583 3,189
Table 2
The first master's degree conferred for students of Fall 1987 through Fall 1994
cohorts combined in a Midwest university during six academic years follow-up,
by gender and college
Engineering Health Visual
and and Liberal and Engineering Human Arts and Performing
Business Education Technology Sciences Sciences Arts Total
Female 305 13 22 507 14 213 1,074 Male 640 1 135 47 18 155 996
Total 945 14 157 554 32 368 2,070
1.6
FACTORS INFLUENCING MASTER'S DEGREE ATTAINMENT
Table 3
Master's degree conferring process of students in a Midwest university
(Fall 1987 through Fall 1994 cohorts combined)
Semes-ter Headcount at the beginning of semester Censored Proportion of Received degree Dropped out Censored due to time limit Total censored Not received degree Received degree Receiving degree 1 3,189 16 280 0 280 0.995 0.005 0.005 2 2,893 83 209 0 209 0.966 0.034 0.029 3 2,601 205 87 0 87 0.890 0.110 0.079 4 2,309 877 81 141 222 0.552 0.448 0.380 5 1,210 159 44 0 44 0.480 0.520 0.131 6 1,007 340 30 64 94 0.318 0.682 0.338 7 573 95 22 0 22 0.265 0.735 0.166 8 456 142 15 38 53 0.182 0.818 0.311 9 261 45 10 0 10 0.151 0.849 0.172 10 206 63 4 33 37 0.105 0.895 0.306 11 106 20 9 0 9 0.085 0.915 0.189 12 77 25 52 0 52 0.057 0.943 0.325 Total 2,070 843 276 1,119
17
14Table 4
Goodness-of fit statistics for hazard model fitted to the degree conferring
process for variables other than the time indicators for students in Business,
Engineering and Engineering Technology, Health and Human Sciences, and
Visual and Performing Arts in a Midwest university
(Fall 1987 through Fall 1994 cohorts combined)
-2 Log L
Independent variables in model
Time indicators
only
Time
indicators
plus another Change in -2 Log L variable df
B. Time indicators plus college:
BUSI vs. other three colleges 11180.29 11207.12 1 26.84**
ENGR vs. other three colleges 11180.29 11180.31 1 0.02
H & HS vs. other three colleges 11180.29 11209.26 1 28.97**
V & PA vs. other three colleges 11180.29 11180.67 1 0.39
C. Time indicators plus gender 11180.29 11181.40 1 1.11 D. Time indicators plus age 11180.29 11280.35 1 100.06**
E. Time indicators plus GPA 11180.29 11186.82 1 6.53*
*p < .05 **13 < .0001
BEST COPY AVAELABLE
FACTORS INFLUENCING MASTER'S DEGREE ATTAINMENT
Table 5
Goodness-of fit statistics for hazard model fitted to the degree conferring
process for variables other than the time indicators by college
(Fall 1987 through Fall 1994 cohorts combined)
Independent variables in model
Time Time indicators
indicators plus another Change in -2 Log L only variable cif Z2 Business
C. Time indicators plus gender 5826.99 5832.47 1 5.48*
D. Time indicators plus age 5826.99 5891.37 1 64.38**
E. Time indicators plus GPA 5826.99 5827.73 1 0.74
F. Time indicators plus GMAT 5543.06 5544.41 1 1.35 Engineering and Engineering Technology
C. Time indicators plus gender 872.74 874.32 1 1.58
D. Time indicators plus age 872.74 874.24 1 1.49 E. Time indicators plus GPA 872.74 874.70 1 1.95
G. Time indicators plus GRE-V 829.23 833.21 1 3.98*
H. Time indicators plus GRE-Q 829.23 830.02 1 0.79
I. Time indicators plus GRE-V&Q 829.23 835.24 1 6.00*
Health and Human Sciences
C. Time indicators plus gender 1646.32 1646.33 1 0.01
D. Time indicators plus age 1646.32 1700.36 1 54.04"
E. Time indicators plus GPA 1646.32 1649.06 1 2.74
G. Time indicators plus GRE-V 1618.78 1619.77 1 0.99
H. Time indicators plus GRE-Q 1618.78 1621.72 1 2.94
I. Time Indicators plus GRE-V&Q 1618.78 1619.45 1 0.68
Visual and Performing Arts
C. Time indicators plus gender 2041.30 2041.54 1 0.23
D. Time indicators plus age 2041.30 2042.78 1 1.48
E. Time indicators plus GPA 2041.30 2044.56 1 3.26
G. Time indicators plus GRE-V 1734.66 1734.69 1 0.04
H. Time indicators plus GRE-Q 1734.66 1737.66 1 3.01
I. Time indicators plus GRE-V&Q 1734.66 1734.98 1 0.32
*p < .05 "p < .0001
1 9
4 5 6 7 8 9 Semesters in Graduate Program
1.00 0.90 0.80 0.70 .0co 0.60 0 0.50 , 111 > 0.40 E 2 0.30 Ct) 0.20 0.10 0.00 1 2 3 4 5 6 7 8 9 10 11 12
Semesters in Graduate Program
Figure 1
.Fitted harzard and survival functions describe the degree
attainment process, from a hazard model containing the main effect of
the time indicators.
2 0
FACTORS NFLUENCING MASTER'S DEGREE ATTAINMENT 0.50 0.45 0.40 ' 4?,. 0.35 2,3 0.30 .0 . 0 " 0.25 a. 1:1 co" 0.20 I 0.15 0.10 0.05 0.00 1 a 2 3 4 5 6 7 8 9 10 11 12
Semesters in Graduate Program
BUSI
- - - -ENGR, H&HS, & V&PA
1.00 0.90 0.80 0.70 co 0.60 .0 EL 0.50 7 1111 0.40 7 u4) 0.30 0.20 0.10 0.00 1 -gk.. -2 3 4 5 6 7 8 9 10 11 12
Semesters in Graduate Program
44BUS!
- - - -ENGR, H&HS, & V&PA
Figure 2a
.Fitted harzard and survival functions describe the degree
attainment process, from a hazard model containing the main effect of
the time indicators and college: Business vs. the other three colleges.
0.45 0.40 0.35 0.20 0.10 0.05 0.00 1 2 3 4 5 6 7 8 9 10 11 12
Semesters in Graduate Program
4-- H&HS
- - - - BUSI, ENGR & V&PA
1 2 3 4 5 6 7 8 9 10 11 12
Semesters in Graduate Program
H&HS
- - - - BUSI, ENGR & V&PA
Figure 2b
.Fitted harzard and survival functions describe the degree
attainment process, from a hazard model containing the main effect of
the time indicators and college: Health and Human Sciences vs. the
other three colleges.
22
FACTORS :NFLUENCING MASTER'S DEGREE ATTAINMENT 0.60 0.50 = 0.40 :a .0 0 0.30 -O. 0.10 0.00 1 2 3 4 6 6 7 8 9 10
Semesters in Graduate Program
11 12 >= 24 -Age < 24 1.00 0.90 0.80 0.70 .o al 0.60 .0 040
z
co 0.30 0.20 0.10 -0.00 1 2 3 4 5 6 7 8 9 10 11 12Semesters in Graduate Program
4-- Age >= 24
- 111. -Age < 24
Figure 3. Fitted harzard and survival functions describe the degree
attainment process, from a hazard model containing the main effect of
the time indicators and age.
2 3
0.40 0.35 0.30 E l 0.25 .0 2 0.20 al 0.15 113, 0.10 0.05 0.00 1 2 3 4 5 6 7 8 9 10 11 12 81 .
Semesters in Graduate Program
0-- GPA >= 3.0 - - GPA < 3.0 1.00 0.90 0.80 4?..' 0.70 :a 03 0.60 0. 0.50 > 0.40 u) 0.30 RI 0.20 0.10 0.00 1 2 3 4 5 6 7 8 9 10 11 12
Semesters in Graduate Program
GPA >= 3.0
- -GPA < 3.0
Figure 4.
Fitted harzard and survival functions describe the degree
attainment process, from a hazard model containing the main effect of
the time indicators and the first semester cumulative GPA.
24
o
U.S. Department of Education
Office of Educational Research and Improvement (OERI) National Library of Education (NLE)
Educational Resources Information Center (ERIC)
NOTICE
REPRODUCTION BASIS
e