Continuous Data Cleaning
Maksims Volkovs
#1, Fei Chiang
∗ #2, Jaroslaw Szlichta
∗ #1, Ren´ee J. Miller
∗ #1 #1Dept. of Computer Science, University of Toronto{mvolkovs, szlichta, miller}@cs.toronto.edu #2 Dept. of Computing and Software, McMaster University
Abstract—In declarative data cleaning, data semantics are encoded as constraints and errors arise when the data violates the constraints. Various forms of statistical and logical inference can be used to reason about and repair inconsistencies (errors) in data. Recently, unified approaches that repair both errors in data and errors in semantics (the constraints) have been proposed. However, both data-only approaches and unified approaches are by and large static in that they apply cleaning to a single snapshot of the data and constraints. We introduce a continuous
data cleaning framework that can be applied to dynamic data and constraint environments. Our approach permits both the data and its semantics to evolve and suggests repairs based on the accumulated evidence to date. Importantly, our approach uses not only the data and constraints as evidence, but also considers the past repairs chosen and applied by a user (user repair preferences). We introduce a repair classifier that predicts the type of repair needed to resolve an inconsistency, and that learns from past user repair preferences to recommend more accurate repairs in the future. Our evaluation shows that our techniques achieve high prediction accuracy and generate high quality repairs. Of independent interest, our work makes use of a set of data statistics that are shown to be sensitive to predicting particular repair types.
I. INTRODUCTION
Data quality is an increasingly pervasive problem for organizations as they try to derive value from data. Integrity constraints are an important tool for ensuring one aspect of data quality, that is data consistency. Integrity constraints were originally designed to enforce data quality by preventing data from becoming inconsistent. However, in many applications, enforcing constraints may be too expensive since constraints must be checked as data is changed. Enforcement may also be undesirable if a correct, consistent value is not known at data entry time and there is value in recording alternatives for later decision making. It is well known that when integrating data, even when the original data satisfies the integrity constraints, the integrated data may not. For these and many other reasons, data may be inconsistent, that is, the data may not satisfy a specified set of integrity constraints.
Nonetheless, integrity constraints still play an important role in managing data quality, even when the constraints are not enforced and data may be inconsistent. Over the last decade declarative data cleaning has emerged as an important method for data quality management [1]. In declarative data cleaning, logical reasoning over integrity constraints is used together
*Szlichta is a Fellow at the IBM Centre for Advanced Studies in Toronto. The work of Chiang, Szlichta and Miller supported in part by NSERC BIN.
with statistical inference over the data to both understand the quality of data (the degree and type of inconsistency in the data) and also to clean or repair the data [2], [3], [4], [5], [6], [7], [8], [9], [10].
The success of declarative data cleaning has also led to the realization that sometimes the right way to improve data quality is not to repair the inconsistent data, but rather to modify the integrity constraints because the semantics of the data or application have evolved [11], [12]. The data may be correct and consistent (or more consistent) if viewed under the lens of the modified constraints, and the modified constraints may more accurately model the domain semantics. The need to consider both the data and the constraints as potential sources of data quality problems was driven home by Paul Yaron’s SIGMOD 2013 keynote discussing the over 23,000 database instances used to run JP Morgan’s daily business, and the almost daily integration of new databases (from new vendors, new customers, acquisitions, and mergers). In such a world, the integrity constraints must evolve to accommodate the semantics of new business rules, newly integrated data, and new business and regulatory rules.
When data is inconsistent, we can use data or constraint repair techniques to reduce the inconsistency and improve the quality of the data. Data repair algorithms assume that the given set of constraints is correct, and search for repairs to the data (often minimal or least cost repairs) that satisfy the constraints [3], [8], [13], [9], [14]. Constraint repair algorithms, on the other hand, aim to identify stale constraints and find modifications that bring the constraints and data into better alignment [11], [12]. However, to the best of our knowledge, the work on declarative data cleaning, including the many systems in the area (AJAX [1], Nadeef [4], LLUNATIC [7] and others), has focused on cleaning a single snapshot of the data with a given set of constraints. These solutions, while effective for static data and fixed constraints, are expensive and difficult to use in dynamicenvironments where data may change frequently and constraints may evolve. Rather, the cleaning process must presumably be rerun periodically (from scratch) to keep the data clean. To make matters worse, a data analyst must manually tune parameters (used for the statistical inference of repairs) to ensure the algorithms perform well as the data distributions and constraints change, and that the recommended repairs align with user expectations and application requirements.
To support data cleaning in dynamic environments, a new framework is needed that focuses oncontinuousandadaptive
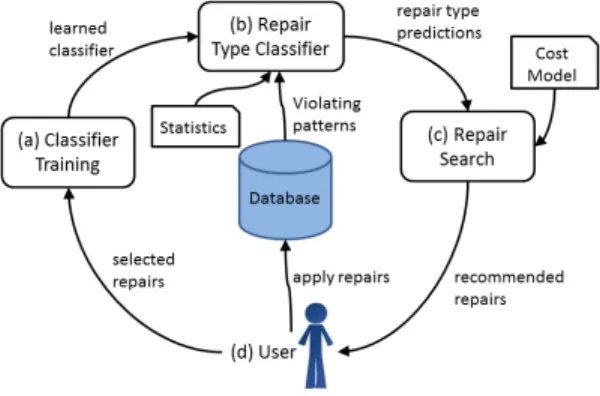
Fig. 1. A framework for continuous data cleaning.
data cleaning. Such environments involve updates to the data and possible evolution of constraints. As data is updated, and the applications semantics evolves, the desired repairs may change. For example, in the financial market domain, data volume and data distributions vary as the types of trades, number of orders, and commodities bought/sold, change each day. Similarly, constraints defined on such data that ensure values are accurate, and that fair market trading is followed, may evolve as legal and governing organizations introduce and modify existing policies. Resolving inconsistencies between the data and the constraints in such a dynamic environment requires the following considerations.
• Data and constraints evolution: We need to deter-mine whether the source of inconsistency is due to incorrect data values or stale constraints.
• Incremental cleaning: As the data and constraints evolve, incremental changes occur. We need to identify repairs based on these incremental changes, without having to start the repair process from scratch each time.
• Adaptivity: Data cleaning is often subjective, accord-ing to user and application semantics. Incorporataccord-ing the user into the cleaning process is critical towards achieving high quality repairs. We naturally include users in the cleaning process, and as users select repairs to apply, we learn from these chosen repair preferences, and propose future repairs that adapt to users’ (possibly changing) preferences.
In this paper, we present a framework (shown in Figure 1) that enables continuous data cleaning in environments where the data and the constraints are changing. Given a data instance that is inconsistent with respect to a set of constraints, our framework uses a classifier to recommend the type of repair needed to resolve a given inconsistency. We consider repairs to the data, to the constraints, or to both the data and the constraints (hybrid repairs). The latter is needed when a constraint has evolved, but the data may still be inconsistent to some extent with the new semantics. The recommended types of repairs are passed to a repair algorithm that generates specific data and/or constraint modifications based on the classifier’s recommendations. A data analyst then selects which repairs to apply to the database. Our classifier leverages this
user feedback to learn repair preferences over time in order to adaptively refine future repair recommendations. In addition, our classifier uses a set of statistics (computed over the data and the constraints) to predict the types of repairs needed. As the data and the constraints change, these statistics are recomputed to include this evolution without having to start the repair process from scratch. We use statistics that can be computed and maintained efficiently, allowing us to adapt efficiently to dynamic changes in the data and constraints.
Our repair-type classifier both reduces a repair algorithm’s search space of possible repairs, but more importantly by incorporating past user preferences (that is, the repairs choosen and applied by a user), it can also greatly improve the accuracy of unified repair algorithms by directing them to the correct part of the search space. In addition, as new repairs are applied by a user, the classifier is continuously re-trained. Re-training tunes the classifier to evolving data distributions and user preferences. Passing this updated information (through predictions) to the repair algorithm allows the entire system to continuously adapt and stay up to date. This results in more accurate repair recommendations that continue to be accurate over time.
We note that re-training can be done automatically using efficient numerical optimization and requires no additional supervision from the user beyond the applied repairs. This is a significant advantage over most existing algorithms [3], [13], [14], [11], [12], [4] that have to bemanuallyre-tuned to achieve the same effect.
In summary, we make the following contributions. 1) An adaptive data cleaning framework for continuous
data quality improvement that adjusts to data and constraint changes, and leverages user feedback (of applied repairs) to learn repair preferences. These preferences are used to successively refine and pro-pose improved repairs. We show that our framework is able to achieve more accurate repairs than static data cleaning solutions. In particular, we are able to achieve an average 20% improvement in repair accuracy over non-learning approaches [11], and a performance time reduction between 13%-19% over static data cleaning solutions [11].
2) A logisticclassifier that predicts the types of repairs needed (data, constraint, or both data and constraint) to resolve a given inconsistency. After a training phase, our classifier is able to achieve prediction accuracyas high as 97%. Our evaluation reveals that we can achieve an overall average of approximately 80% classification accuracy using real data sets with user feedback. After a re-training phase on a single snapshot of the data that incorporates the user’s feed-back on preferred repairs, our average classification accuracy increases by approximately 11%. Therefore, the re-trained with user feedback classifieradaptsto the user preferences.
3) We hypothesize that the use of statistics, computed over the data and the constraints, can help data clean-ing solutions to adapt to changclean-ing data distributions and constraint updates. We experiment with a large set of statistics and show that a set of these statistics
are predictive for finding the right class of repairs to improve data quality. We empirically identify the statistics that are sensitive to the classification task, and report our insights on the data and constraint properties that influence individual repair choices. 4) We provide a performance and qualitative evaluation
of our techniques highlighting the adaptivity of our framework, and our classification accuracy and repair accuracy.
To the best of our knowledge, this is the first attempt to exploit dynamic data quality solutions to repair inconsistency when the data and the underlying constraints may change. For this work, we focus on the most widely used integrity constraint, functional dependencies (FDs). We feel this work opens exciting avenues for future work to develop a powerful new family of dynamic data quality techniques in database systems.
This paper is organized as follows. We begin by discussing related work in Section II. We provide a motivating example and describe our framework in Section III. Preliminary back-ground is presented in Section IV, followed by our classifi-cation framework in Section V. In Section VI, we describe our experimental setup and present our evaluation results. We conclude in Section VII.
II. RELATEDWORK
Recent data cleaning systems such as AJAX [1], Nadeef [4], LLUNATIC [7] and others, have focused on clean-ing a static snapshot of the data for a given set of constraints. While these solutions are effective for data environments where the data and the constraints may not change frequently, they are expensive to implement in environments where the data and the constraints may evolve, as they require manual re-tuning of parameters, and acquisition of new data and constraints. For example, Beskales et al., propose data and constraint algorithms that generate repairs according to a relative trust parameter [12]. To capture repair preferences in dynamic data environments, the relative trust parameter must be manually adjusted each time to adapt to changing application semantics. To the best of our knowledge, our work is the first to consider adaptive and continuous data cleaning where the underlying data and constraints may change.
Incorporating user feedback is a vital component towards achieving high quality repairs. A Guided Data Repair (GDR) framework is proposed by Yakout et al. [9] that uses a classification model to predict the utility of a set of data repairs, that is, whether a data repair should be accepted, rejected, or retained. The model solicits user feedback to gauge which repairs are most appropriate. Our work differs from this effort in two ways. First, the GDR framework considers only modifications to the data in its search space, whereas we consider FD repairs, and hybrid repairs consisting of modifications to both data and the FDs. Secondly, the GDR framework focuses on converging to the best set of data repairs for a given static data instance. Changes to the data and/or to the constraints will require obtaining new data snapshots (as there are no provisions for incremental data changes), and restarting the repair process from scratch with an updated set of constraints. Our framework avoids these burdens by
considering the incremental changes to the data and to the constraints during the cleaning process.
Constraint-based data cleaning aims to resolve inconsisten-cies between a data instance and a given set of constraints. The constraints are often assumed to be fixed and correct. Hence, data repair algorithms seek modifications to the data that minimize a cost function such as the number of edits, or the distance between source and target data values, to re-align the data and the constraints [3], [5], [8]. Due to the large space of possible repairs, and the high complexity of finding minimal cost repairs [3], heuristic solutions, sampling techniques [13], and statistic inference [15], [16] are often proposed to reduce the space of possible repairs. As data intensive applications increasingly operate in data environments where rules and business policies may change, recent work in this area has proposed repair techniques to consider evolving constraints, primarily focused on FDs [11], [12]. Chiang and Miller [17] propose a unified repair model that considers repairing an inconsistency via modifications to the data or to the set of FDs. The decision is based on minimizing a description length cost function based on the Minimum Description Length (MDL) principle [18]. Despite this wealth of data cleaning solutions, to the best of our knowledge, none of the existing techniques have considered cleaning data and stale constraints in evolving data environments.
III. MOTIVATINGEXAMPLE ANDFRAMEWORK
OVERVIEW A. Motivating Example
Modern business applications are running indynamicdata environments where the data, and the constraints are changing constantly (as described in Section I). In such environments, when an inconsistency occurs, it is no longer apparent, if the data is wrong or if the constraints have changed. Constraint evolution occurs, for example when data are integrated from different sources or business requirements change. Sources of data errors include careless data entry, integration of data sources, and de-normalized data with redundancies. In this work, we consider data repairs, FD repairs, and a hybrid of both data and/or FD repairs.
Consider Table I (Employee salary) and the constraint: F1: [First name, Surname]→[Salary].
DependencyF1states that whenever two tuples agree on values for attributes First name and Surname, they must agree on values for attribute Salary. Let’s assume F1 holds for each specific branch of the company, in which surname and first name uniquely identify a person, but does not necessarily hold for the entire company. If the company decides to consolidate all employee salaries across all the branches to a central data warehouse with an ETL (Extract, Transform, Load) pro-cess, ambiguity among employee salaries can arise. That is, a specific employee will be difficult to distinguish without considering the branch identifier (branchID). The dependency F1 will no longer hold over an integrated table such as Table I. A possible constraint repair would be to add BranchID to the left side of F1, giving a modified dependency,
F10: [First name, Surname, BranchID]→[Salary]. Note we could repair the violations by changing the data, but we would have to update values in some of the three tuples
TABLE I. EMPLOYEE SALARY.
tid First name Surname BranchID Salary Zip City
t1 James Brown 107 70K 50210 Miami
t2 Craig Rosberg 107 50K 50210 Miami
t3 James Brown 308 70K 21100 Atlanta
t4 Monica Johnson 308 60K 21100 Houston
t5 James Brown 401 80K 65300 NY
t6 Monica Johnson 401 100K 65300 NY
t7 Craig Rosberg 401 80K 65300 Boston
t8 Mark Douglas 401 130K 65300 NY
for James Brown ({t1, t3, t5}), at least one tuple for Monica Johnson ({t4, t6}), and one for Craig Rosberg ({t2, t7}). However, there is little evidence in the data to tell us which tuples should be changed. More importantly, we would be changing tuples that all have the exact same error. Therefore, Chiang and Miller [17] propose that it may be more likely that the constraint F1 is wrong rather than the data.
Furthermore, consider the following FD: F2: [Zip] →[City].
Tuplest3−t8, do not satisfyF2. For tuplest5−t8, based on the data, we may conclude that the city value of “Boston” in t7 may be incorrect. (There is more support for “NY” in the data, since t5, t6 and t8 are all in agreement.) Note that addingBranchID to the left side of dependencyF2 does not help to resolve the inconsistency. Intuitively, we want to add an extra attribute or a set of attributes whose values neatly separate the conflicting tuples [17], while preserving the existing data regularity (w.r.t. the FD) as much as possible. Adding BranchID to the left side of F2 does not help to separate t3 andt4, nor does it distinguisht7 from (t5, t6, t8). AddingSalaryto the left side ofF2helps to distinguisht3from t4, thereby resolving that inconsistency, but it does not help to distinguish t7 from t5. Furthermore, it has not preserved the existing data regularity (i.e., ”50210”, ”Miami”) in the satisfying tuples t1, t2, which have now been separated by different salary values.
For tuplest3 andt4 that do not satisfyF2, we can repair the violations by changing the data, but we would have to change either t3 or t4 (the value of “Atlanta” or “Houston”, respectively). However, there is not enough support in the data to tell us which tuples would be better to change. In this case, we let a domain user decide the best repair value, and we do not automatically recommend a repair.
Now let’s suppose that a user suggests modifying the value of the City attribute in t3 to “Houston”. Furthermore, there is new incoming data, and an extra tuple t9 is added in the next iteration of the ETL process, where t9[Zip, City] = {“21100”, “Atlanta”}. Now, tuplest3,t4andt9do not satisfy F2. However, this time, based on the data and user feedback, we may infer that the city value of “Atlanta” (in t9) is not likely to be correct. There is more support for “Houston” in the data (tuples t3 and t4 are in agreement), and the value “Houston” is a user substantiated value.
In the examples above, we have presented a case where a constraint repair is better than a data repair, and a case where one data repair is better than another (and better than a constraint repair). In this paper, we present a classifier (described in Sections III-B and V) that reflects this intuition andaccurately andefficiently selects between data repair, FD repair, or a hybrid of both repairs In dynamic settings, we
need to adjust to changes in the data and evolving constraints without having to start the repair process from scratch each time. As data cleaning tasks are often subjective, incorporating the user into the cleaning process is critical to achieve high quality repairs. We continuously learn and adapt to the user’s (potentially changing) preferences.
B. Overview of Framework
To manage inconsistencies in dynamic data environments, where the data and the constraints may change, requires a new data cleaning approach that considers these evolutionary changes along with user feedback. We address this by framing the data cleaning problem as a classification problem. We introduce a classifier that is automatically tuned to adapt to evolving data and constraint changes, and to users’ preferences. We will consider functional dependencies (FDs) as our set of constraints. Let F : X → A be a single FD. Without loss of generality, we assume FDs have been decomposed to have a single attribute on the right-hand side. At the data level, we consider (tuple) patterns to be the set of distinct tuples produced by the projection of t[XA] for all tuples t in the relation. A pattern p (over XA) is violating if there exists a (distinct) pattern p0 where ΠX(p) = ΠX(p0) but
ΠA(p) 6= ΠA(p0). Modifications (repairs) are needed to the tuples containing violating patterns or to the violated FDs, to resolve these inconsistencies.
Figure 1 shows our framework consisting of four stages. In the first stage, we train a probabilistic classifier (Figure 1 (a)) using repairs that have been selected and validated by a user. These repairs provide a baseline to the classifier representing the types of modifications that align with user and application preferences. As the database is used, and the data and the constraints change, inconsistencies may arise that need to be resolved.
Once the classifier is trained (Figure 1 (b)), it predicts the types of repairs needed to address the violating patterns. To compute these predictions, we apply a set of statistics that are calculated over the data and the constraints, describing properties of the violating patterns. We generate predictions by computing statistics with respect to each pattern, and then use the classifier to compute the probability of each repair type (data, FD, or a hybrid of both). These repair predictions are passed to the repair search algorithm (Figure 1 (c)), which narrows the search space of repairs based on the classifier’s recommendation. The repair search algorithm includes a cost model that determines which repairs are best to resolve the inconsistencies. The repair search algorithm recommends a set of data and/or FD repairs to the user, who will decide which repairs to apply (Figure 1 (d)). The applied repairs are then used to re-train the classifier, and the process is repeated. Incremental changes to the data and to the constraints are passed to the classifier (Figure 1 (b)), and reflected via the statistics and the patterns.
Our framework provides the following advantages over past data cleaning solutions [9], [12], [4], [19]. First, our classifier helps to reduce the space of possible repairs. Since each vio-lating pattern can be repaired by either a data, FD or a hybrid repair, without any prior knowledge about the repair type, the repair search algorithm must consider this large search
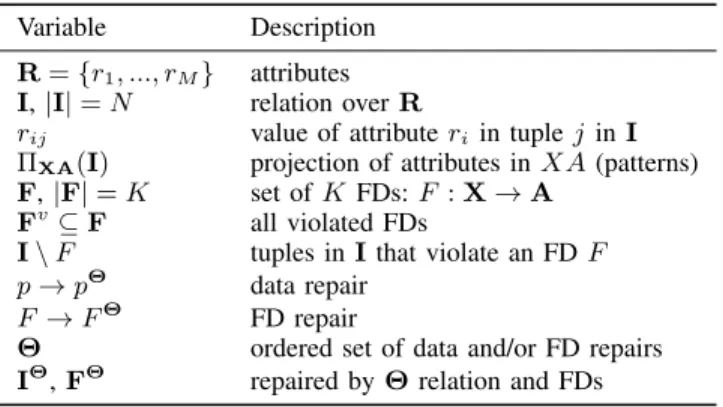
TABLE II. SUMMARY OF NOTATION.
Variable Description R={r1, ..., rM} attributes I,|I|=N relation overR
rij value of attributeriin tuplejinI ΠXA(I) projection of attributes inXA(patterns)
F,|F|=K set ofK FDs:F:X→A Fv⊆F all violated FDs
I\F tuples inIthat violate an FDF p→pΘ data repair
F →FΘ
FD repair
Θ ordered set of data and/or FD repairs IΘ,FΘ repaired byΘrelation and FDs
space of repairs. In our framework, our repair search algorithm focuses its search only on the repair type recommended by the classifier, thereby saving both computational resources and time. Second, by having a feedback loop to re-train the classifier as new repairs are applied by the user, allows the classifier to adapt to the user’s preferences, which may change over time as the data and constraints evolve. Moreover, as more repairs are applied, this feedback will enable the classifier to make more accurate predictions, and in turn, improve the repair search algorithm’s recommendations. Finally, to resolve inconsistencies due to incremental changes in the data and in the FDs, we do not require starting the entire repair process from scratch. Our framework captures these changes via a set of statistics that allow the classifier to respond to these incremental changes and recommend new types of repair. Our framework is a first step towards continuous data cleaning that adaptively learns which repairs are most suitable in a dynamic data environment.
IV. BACKGROUND
Let Ibe an instance (relation) over a set of M attributes
R = {r1, ..., rM}, N = |I| is the cardinality (number of
tuples) of I. We use rij to denote the value of attribute ri
in the j’th tuple. In addition toI, we are also given a set of K FDsF={F1, ..., FK}, represented as:F :X→A, where X⊆RandA∈R.
An instance Isatisfies F (written asI|=F) if for every pair of tuples t1, t2 inI, ifΠX(t1) = ΠX(t2)thenΠA(t1) =
ΠA(t2). Here, ΠX is the projection on the attributes of X. We refer to tuples in ΠXA as patterns. For a pattern p, we often refer to the set of relation tuples that containp, meaning {t∈I|ΠXA(t) =p}. We write Fv ⊆F to denote the subset
of FDs that are violated inIand useI\F to denote the set of tuples that violateF. ConsequentlyΠX(I\F)is the projection on attributes of Xonly for those tuples inIthat violateF.
An instanceIis consistent (with respect to the constraints in F) if I|=F. Different types of repairs can be applied to make a database consistent. In this paper we consider three types of repairs: data repairs, FD repairs, and the combination of both data and FD repairs.
A. Data Repair
Suppose we have two tuples t1 and t2 in I that violate an FD F : X → A, so t1 and t2 agree on X (ΠX(t1) =
ΠX(t2)) and disagree on A (ΠA(t1) 6= ΠA(t2)). To repair such a violation, we can change some attribute values in either of the following ways. (Without loss of generality, we assume t1 is changed.)
Right Data Repair Change theAvalues to be the same. Change the right side attribute A to make ΠA(t1) equal
ΠA(t2).
Left Data Repair Change theXvalues to be different. Here, we might find another tuple t3 which shares the same right side values witht1(ΠA(t1) = ΠA(t3)) but has different left side values (ΠX(t1) 6= ΠX(t3)). The values of ΠX(t1) is changed to equal ΠX(t3), where the chosen repair value is from the active domain ofX.
While repair algorithms differ on the evidence they use to choose a right vs. a left data repair or in choosing a value for a data repair, in most algorithms, the chosen data repair for t1 would typically be applied to every tuple that has the same X
andAattribute values ast1. Consequently, we can view data repairs aspatternsubstitutions. For a given violating patternp we use a repairing patternpΘ to repair all tuplestthat match p: {t | t ∈I,ΠXA(t) = ΠXA(p)}. For right data repair we would change the A attribute value oft,ΠA(t)→ΠA(pΘ), whereas for left data repairs we would change the X values, ΠX(t)→ΠX(pΘ). We use p→pΘ to denote the data repair for pattern p.
B. FD Repair
In addition to data repairs, we consider repairs that change the constraints (FDs). In this paper, we consider one type of constraint repair for an FD F : X → A, the addition of attributes to X. This type of constraint repair has been con-sidered in past work where only one attribute [11] or multiple attributes [12], [17] are added to X. This type of constraint repair is useful when data is integrated, or when a relation evolves to encode new types of information. For example, in a data set containing North American addresses, the FD [PostalCode] →[StateOrProv] accurately models the domain, but as the data evolves to include international addresses, a more accurate integrity constraint is [Country, PostalCode] → [StateOrProv]. We useF →FΘto denote an FD repair; here FΘ represents the new FD after an attribute is added to the left attribute(s) Xof F.
In our approach, we allow a given FD F to be repaired by a combination of both data and FD repairs. We call this a
hybrid-repair of F. While it is possible to use other repair types, the data and FD repairs described above cover all of the approaches proposed by existing methods. The repair algorithms that we consider all produce an ordered set of (data or constraint) repairs Θ. To repair the database, the repairs are applied sequentially in the order that they appear in Θ. We write IΘ and FΘ to denote relation and FDs after they have been repaired by Θ. Table II summarizes the notation introduced so far.
V. CLASSIFICATIONFRAMEWORK
We now introduce a classifier that adapts to dynamic data and constraint environments. Our classifier considers evolutionary changes, along with user feedback (in the form
of selected repairs over previous versions of the database). We compute and maintain a set of statistics over the data and the FDs, which allow us to capture the latest changes. We present a logistic regression classifier that learns from these statistics to predict the types of repairs needed to resolve the inconsistencies. In this section, we first introduce the set of statistics that we use, followed by a discussion of the different classes of repairs that our classifier considers. Finally, we present details of our predictive model and training procedure. A. Repair Statistics
Past work has considered how statistics can be used to improve data cleaning applications by taking a statistical inference approach to identify attribute correlations [15], or by quantifying the deviations between source and target sta-tistical data distributions to identify data repair values [20]. In dynamic data environments, we need to keep up with evolving data distributions and changes to the FDs, and need statistics that allow us to capture these incremental changes. We propose a set of statistics that can be computed and maintained efficiently, and allow us to compute repairs as needed without having to start the repair process from scratch each time a change occurs. We systematically reviewed the literature and identified the type of evidence used in the cost models. We found the support of a pattern (Statistic 2) used in many approaches and others in a single approach, like the entropy statistics of FD violations (Statistics 6-8) that modeled the variance of information used by Chiang and Miller [11]. We found 29 total statistics1 and we report the 22 statistics that proved to be most predictive.
Given a violating pattern p ∈ ΠXA(I\F) for an FD F : X → A, our goal is to design a set of statistics G
that accurately describe the statistical properties of the pattern and its relation to other tuples in the table with respect to the FD. By leveraging the statistics, our goal is to efficiently compare the alternative repairs that could be used to resolve the violating patterns and understand which are most likely given the data. We define22statisticsG= [g1, ..., g22], which we experimentally found to work well. All statistics depend on a patternp, except the first which depends only on an FD F. We use NF = |I\F| to denote the number of violating
tuples forF and freq(p) =|{t|ΠXA(t)≡p}|as the number of tuples containing the pattern pover the attributes ofF.
Statistics on an FD F
1) Number of violating tuples in F relative to the total number of tuples inI:g1=NF/N
Statistics on pattern p of an FDF
2) Frequency ofprelative to the total number of tuples: g2=freq(p)/N
3) Frequency ofprelative to the total number of violat-ing tuples forF:g3=freq(p)/NF
Statistics on pattern p of F across a set of FDs F
With these statistics, we seek to characterize patterns whose tuples (tuples containing the pattern) also violate many other FDs in Fvs. those that violate few other FDs. Conceptually 1The full set of statistics is available at: http://www.cas.mcmaster.ca/∼fchiang/docs/featureStats.pdf
patterns with tuples that violate several FDs are more likely to get fixed than those that only violate one FD. Furthermore, such patterns are typically fixed by FD repair(s) since it is difficult and often impossible to find data repairs that would fix the pattern for all FDs simultaneously.
4) For an FDF0 6=F, the overlap ofpis defined as the fraction of tuples that violateF0 and contain pattern pin theirXAattributes. Formally,
overlap(F0, p) =|{t|t∈I\F0, ΠXA(t)≡p}|/freq(p) Using this function, we compute descriptive statistics across all FDs inF.
g4=mean({overlap(F0, p)}F06=F)
g5=std({overlap(F0, p)}F06=F)
g6= max({overlap(F0, p)}F06=F)
g7= min({overlap(F0, p)}F06=F)
Here, std is the standard deviation function.
Statistics on pattern p across possible constraint repairs
5) Let F RF ={F →Fl}l be the set of all constraint
repairs for F. For each such FD repair F →Fl, we
calculate the fraction of tuples (containingp) that are not repaired.
fix(p,{F →Fl}) = |{t |t∈I\F
l,Π
XA(t)≡p}| freq(p)
Note that 0 ≤ fix(p,{F → Fl}) ≤ 1 with 0
indi-cating thatF →Flrepairs every tuple containingp. We summarize this function with a set of descriptive statistics: g8= min({fix(p,{F →Fl})F→Fl∈F R F) g9=mean({fix(p,{F →Fl})F→Fl∈F RF) g10=std({fix(p,{F →Fl})F→Fl∈F R F)
Ing8, trivial repairs with keys are not considered. We omit max since FD repairs that repair few (or zero) patterns do not provide any useful information to the classifier.
Statistics on patternpofF across possible data repairs
6) Frequency-based entropy statistics of violating pat-terns ofX (left attributes) for the FD F. Let VX be the violating patterns forX.
VX={ΠX(t)| t∈I\F,ΠX(t)≡ΠX(p)} g11=− X p0∈VX freq(p0) |VX| log freq(p0) |VX| g12= max p0∈VX freq(p0) |VX| g13= min p0∈VX freq(p0) |VX| g14=std {freq(p0)/|VX|}p0
7) Frequency-based entropy statistics of non-violating (satisfying) patterns ofX. Let SX be the satisfying patterns forX.
g15=− X p0∈SX freq(p0) |SX| log freq(p0) |SX| g16= max p0∈SX freq(p0) |SX| g17= min p0∈SX freq(p0) |SX| g18=std {freq(p0)/|SX|}p0
8) Frequency-based entropy statistics of violating pat-terns ofA(right attribute) for the FD F.
VA={ΠA(t)| t∈I\F,ΠA(t)≡ΠA(p)} g19=− X p0∈VA freq(p0) |VA| log freq(p0) |VA| g20= max p0∈VA freq(p0) |VA| g21= min p0∈VA freq(p0) |VA| g22=std {freq(p0)/|VA|}p0
We note that the statistics described above can be computed efficiently even for large databases. Most of the proposed statistics are based on frequency counts. These counts can be updated on the fly when new tuples are added (or removed) to (from) the database. For instance, to update pattern frequency we can build a pattern index for each FD and update this index when new tuples are added/removed. For large databases, updating indexes may be too slow, so an alternative is to create separate hash tables, mapping hashed pattern representations to counts. Hash tables can be updated very quickly and storing them would require minimal memory overhead since for each pattern we would only need to store a hash value of at most 256 bits.
The only statistical group that is relatively inefficient to compute is group 5 (g8 -g10). To compute these statistics, we need to find the number of tuples that each FD repair fixes for a given pattern. Empirically, we found these statistics to be very useful for classification, improving the accuracy by almost 10%. To minimize the computational overhead we can employ pattern statistics, and prune the set of possible repairs that either turn the FD into a key or do not fix sufficiently many tuples. Moreover, stochastic approximation can also be employed here by sampling patterns from various regions of the database and estimating necessary quantities using statistics from those samples.
The computational efficiency of the proposed statistics leads to an effective framework where a learned classifier can be quickly applied to obtain repair type predictions for new violating patterns and significantly reduce the search space of possible repairs.
B. Target Classes
We formulate the prediction problem as a multiclass clas-sification task and use logistic regression as the classifier. To train the classifier, we assume that we are given a collection ofLrelations each with its own set of FDs:{(I(l),F(l))}. For each pair(I,F)we also have a set oftargetrepairsΘ˜ that were
applied by the user. For cases where applied repairs are not available, a problem known as cold start in machine learning, we can use the repairs recommended by a repair algorithm, and use those to train the classifier. For each relation, we then create the pattern set as follows, for each FD we extract all the violating patterns to create the violating pattern set:
P =[
i
ΠXiAi(I\Fi)) (1)
For each pattern pinP we extract the set of statisticsG(p), described in the previous section. In addition to statistics we use Θ˜ to assign the target repair ”state” to each violating pattern. We use seven classes to encode possible repair states:
1) CLASS 1 = NOT REPAIRED
2) CLASS 2 = REPAIRED COMPLETELY BY FD RE-PAIR(S)
3) CLASS 3 = REPAIRED COMPLETELY BY DATA RE-PAIR(S)
4) CLASS 4 = REPAIRED COMPLETELY BY DATA AND FD REPAIRS
5) CLASS 5 = REPAIRED PARTIALLY BY FD REPAIR(S) 6) CLASS 6 = REPAIRED PARTIALLY BY DATA
RE-PAIR(S)
7) CLASS 7 = REPAIRED PARTIALLY BY DATA AND FD REPAIRS
A given pattern can be affected by a number of repairs in ˜
Θ. Here we use a simple algorithm to determine the final repair class for each such pattern. We consider a pattern to be partially or completely repaired, if at least 50% or 100%, respectively, of its tuples are repaired by Θ˜, otherwise we assign it to CLASS 1. For each partially/completely repaired pattern p we create a repair set Λp, initialized to an empty
set. Each repair in Θ˜ is then considered in order (first to last) and gets added to Λp if it fixes any tuples inpthat were not
fixed by the previous repairs. Repairs that concentrate on other areas of I, might override all the repairs previously done top by re-introducing all/some of its violating tuples. This often occurs when data repairs for one FD, re-introduces violations, that were previously repaired for other FDs. To account for this we reset Λp to∅ every time the number of violating patterns
inpreaches its original count. At the end of this procedureΛp
contains an (approximate) list of repairs that contributed top. Distinct repair types in that list together with partial/complete repair status define the target repair class for p. For example, if both data and FD repairs are in Λp and p was repaired
partially then it is assigned to CLASS 7. On the other hand, if p is repaired fully by data repairs, then it is assigned to CLASS 3. We use c(p)∈ {1, ...,7}to denote the class of p.
The class assignment procedure outlined above does not take into account the number of tuples that were fixed by each repair inΛp. This can potentially lead to inaccurate class labels
when the majority of tuples for p were fixed by a subset of repairs in Λp while other repairs inΛp were directed towards
other pattern(s). To avoid this problem we can extend the above procedure and further prune Λp by thresholding the number
of tuples fixed. This, however, will introduce additional free parameters to tune and we leave it as future work.
C. Logistic Regression
In this section we describe the repair type classifier. The classifier’s task is to predict the type of repair(s) needed to
resolve a given set of violating patterns. Our repair framework only depends on predicted class probabilities and can thus incorporate any feature-base classifier. In this work we chose to use logistic regression as our predictive model since this is a common, well-accepted and effective classifier. Under the logistic regression model, the probability of a given class is given by the softmax function:
Q(p=CLASS i) = exp(Wi·G(p) +bi)
P7
j=1exp(Wj·G(p) +bj) (2) whereWi is a weight vector of the same dimension asG(p) (one weight per feature) and bi is a bias term. The target
probability is taken to be:
P(p=CLASS i) = 1if c(p) =i and0 otherwise (3) A standard way to learn this model is to makeQmatchP as closely as possible by minimizing the cross entropy objective: L=− 1 |P| X p∈P 7 X i=1
P(p=CLASS i) log(Q(p=CLASS i)) (4) To deal with imbalanced classes we re-weight the cross entropy terms by the fraction of patterns in each class:
L=−X p∈P 7 X i=1 1 |Ci|
P(p=CLASS i) log(Q(p=CLASS i))
where Ci ={p| p∈ P, c(p) =i} is the set of patterns that have been assigned to class i. Re-weighting by |C1
i| ensures
that each class has an equal weight during optimization and prevents the model from always predicting the most common class. In all experiments, we use standard stochastic gradient descent method to minimize Lwith respect to W’s andb’s.
VI. EVALUATION
We now turn to the evaluation of our techniques on real datasets. Our evaluation focuses on four objectives.
1) An evaluation of the classification accuracy using real datasets. We consider cases where the data and the constraints are evolving.
2) An evaluation of the utility of our proposed descrip-tive statistics for repair type prediction.
3) An evaluation of the repair accuracy compared to static cleaning solutions. We quantify the benefit of the classifier to an existing repair algorithm, in terms of accuracy and running time.
4) An evaluation of the scalability of our approach. Our experiments were run using clusters of Intel Xeon Processors 5160 (3GHz) with 16GB of memory.
A. Data Characteristics
We use two real data collections. The first collection (FVV) contains finance, vehicles and veterans datasets gathered on-line. The finance dataset is based on the US Federal Deposit Insurance Corporation (FDIC) directory [21] to get a list of all FDIC insured institutions. The data contains information about each institution such as type, asset value, regulators,
geographic information (city, state), and operating status (ac-tive, bank class), with 27602 tuples (25 attributes, 10 FDs). The green vehicles data set is based on the US Environmental Protection Agency’s Green Vehicle Guide that provides vehicle ratings based on emissions and fuel economy [22], with 2294 tuples (18 attributes, 6 FDs). Finally, the Veterans of America (veterans) dataset [23] contains demographic, socio-economic data of donors with 95412 tuples (9 attribute, 5 FDs). Table III shows the set of postulated FDs.
The second data collection contains four datasets obtained from the Linked Clinical Trials (LinkedCT.org) database [24]. The LinkedCT.org project provides an open interface for international clinical trials data. The XML version of this data was transformed into open linked data [25]. We used a portion of this dataset that includes data from four countries: Canada, Germany, Italy and Japan. Our subset contains a total of 34,818 tuples (29 attributes) and 5 FDs summarized in Table III. B. Repair Algorithm
For our experiments, we use the repair algorithm proposed by Chiang and Miller [11]. Recall that the classifier provides a set of repair type recommendations, and we pass these recommendations to a repair algorithm that generates the set of data and/or FD updates. We modify the repair algorithm such that it only searches for repairs based on the classifier’s type recommendation, we call this modified versionclassify-repair. We choose Chiang and Miller’s repair algorithm for its ability to consider both data and FD modifications. However, our framework is amenable to other repair algorithms that generate both data and FD repairs, and accept the classifier’s repair type recommendations as input to guide the search space.
C. Classification Accuracy
To investigate the effectiveness of our framework, we trained and evaluated two classifier models on each data collection. Initially when the framework is launched, we are unlikely to have access to user approved repairs to train the classifier. To solve this cold start problem, we apply the original (unmodified) version of Chiang and Miller’s repair algorithm to generate an initial set of baseline repairs (set A). Using A as the ground truth, we train our classifier (CL-A) and pass its predictions to the classify-repair search algorithm, which generates a new set of repairs. These repairs are presented to a user who then validates/adds/removes repairs to produce user validated repair set B. We use B to re-train the classifier (CL-B), and evaluate both CL-A and CL-B on a subset of test patterns from B. The complete procedure is summarized below:
1) Apply baseline repair algorithm [11] to generate repair set A.
2) Use A to train the classifier (CL-A).
3) Pass classifier output to classify-repair search algo-rithm, and generate a new set of repairs.
4) Get user validation on repairs, to get repair set B. 5) Use B to re-train the classifier (CL-B).
6) Repeat to step (3), pass CL-B output.
By repeatedly re-training on user’s feedback the classifier is able to stay up-to-date with dynamically changing database
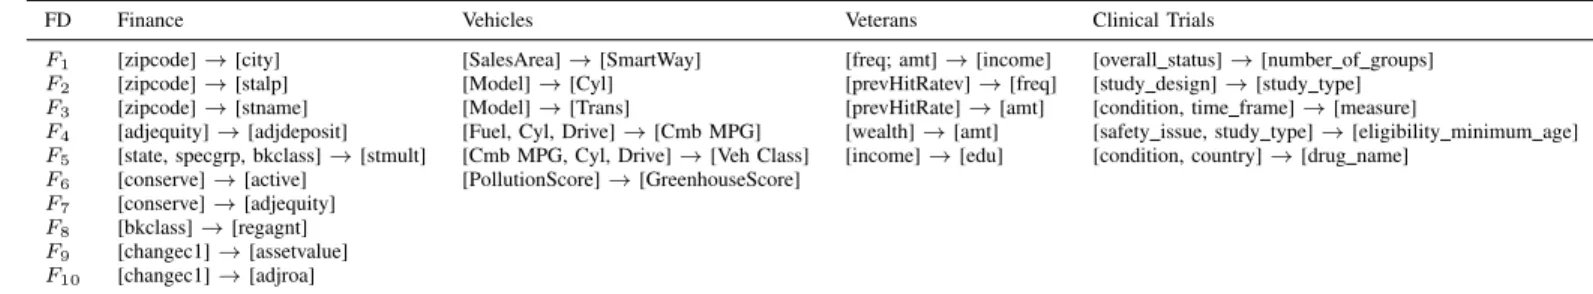
TABLE III. DEFINEDFDS OVER REAL DATASETS.
FD Finance Vehicles Veterans Clinical Trials
F1 [zipcode]→[city] [SalesArea]→[SmartWay] [freq; amt]→[income] [overall status]→[number of groups]
F2 [zipcode]→[stalp] [Model]→[Cyl] [prevHitRatev]→[freq] [study design]→[study type]
F3 [zipcode]→[stname] [Model]→[Trans] [prevHitRate]→[amt] [condition, time frame]→[measure]
F4 [adjequity]→[adjdeposit] [Fuel, Cyl, Drive]→[Cmb MPG] [wealth]→[amt] [safety issue, study type]→[eligibility minimum age]
F5 [state, specgrp, bkclass]→[stmult] [Cmb MPG, Cyl, Drive]→[Veh Class] [income]→[edu] [condition, country]→[drug name]
F6 [conserve]→[active] [PollutionScore]→[GreenhouseScore]
F7 [conserve]→[adjequity]
F8 [bkclass]→[regagnt]
F9 [changec1]→[assetvalue]
F10 [changec1]→[adjroa]
TABLE IV. NUMBER OF PATTERNS IN EACH CLASS. FVV-A FVV-B Clinical-A Clinical-B
CLASS 1 1644 1502 2421 2357 CLASS 2 397 309 213 271 CLASS 3 155 157 122 112 CLASS 4 0 0 0 0 CLASS 5 91 320 145 161 CLASS 6 1 0 0 0 CLASS 7 0 0 0 0 TOTAL 2288 2288 2901 2901
and user’s repair preferences. It is worth re-emphasizing here that re-training does not require any additional feedback from the user beyond the applied repairs, and thus does not impose any additional overhead on the user.
To test the effectiveness of re-training the classifier, once the feedback from the user is available, we manually prune the suggested repairs (set A) from step 3 above. During pruning, some repairs are accepted as is while others are either modified or deleted and new repairs are introduced. After pruning, the resulting set of repairs is ready to be applied to the database. The pruning step simulates feedback that the classifier would receive from a domain user.
Note that since no repairs are yet applied to the database, both the initial set of repairs A and the pruned set B contain the same violating patterns and only differ in target class assignments. For set A, the target classes come from the repairs suggested by the algorithm of Chiang and Miller, whereas for set B the target classes come from the ”ground truth” repairs that were approved by the user. Table IV illustrates the difference in class distributions. The table shows the number of patterns in each class for Finance, Vehicles, Veterans (grouped together as FVV) as well as Clinical datasets2. The class distribution for repair set A is shown under FVV-A (Clinical-A), and class distribution for repair set B is shown under FVV-B (Clinical-FVV-B). Table IV shows that while the total number of patterns remains the same, the class distribution across patterns is different between sets A and B. For example, FVV-B has considerably more patterns in class 5 = REPAIRED PARTIALLY BY FD REPAIR(S) than FVV-A, indicating that the user has chosen to repair more patterns with FD repairs than was initially suggested by the algorithm in repair set A. The difference in class distributions further illustrates the need for adaptive re-training of the classifier.
To test the re-training framework we split the patterns in FVV and Clinical data collections into training and test sets. 2The datasets were grouped together to increase the number training/test patterns and make classification accuracy estimates more reliable.
All models were then trained on the training set and evaluated on the test set. Given that our main objective is to dynamically adapt to the proposed repairs to reflect the user’s preferences, we are primarily interested in comparing the two classifiers on target classes on the user-verified set B. Specifically, we want to show that the re-trained classifier CL-B is able to adapt to the user’s preferences, and thus suggest repairs that are aligned with user expectations.
For each set, the statistical features were standardized by subtracting the mean and dividing by the standard deviation. Five 80%/20% random splits of patterns in each set were used for training and testing, respectively. Due to the lack of data in classes 4,6, and 7, they were removed from both data sets. For each classifier the learning rate, was set to 0.05and starting weights were sampled independently from a Gaussian distribution with mean 0and standard deviation 0.1.
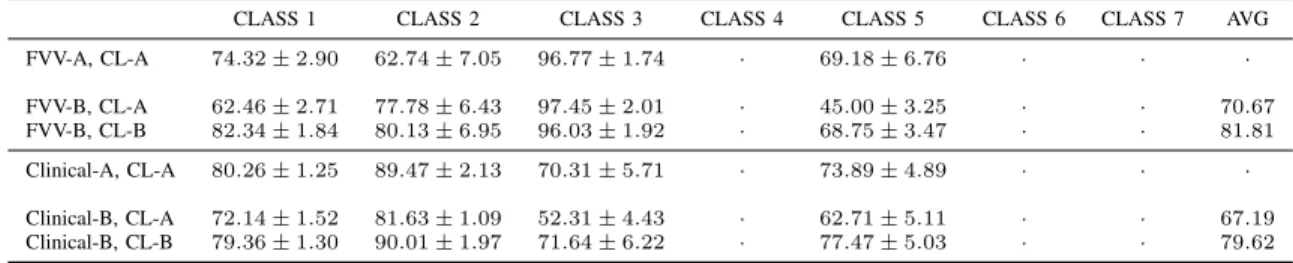
Table V shows the classification results for the test sets (per-class), averaged across the five classes for the FVV collection (top-half) and the clinical collection (bottom half). For each collection, we show classification accuracies for both CL-A and CL-B classifiers when they are applied to the test set patterns with target classes specified by user-screened repairs (set B). (We note that the directly comparable values are the second and third rows from each data collection). For completeness, we also show the accuracy of the CL-A classifier when it is evaluated with target classes from set A (the first row in each data collection).
From Table V, we see that the classification accuracy for both CL-A and CL-B is considerably higher than random guess, which is 14 = 25%. This indicates that the statistical features do capture class sensitive information, and the classi-fier is able to capture this. Moreover, on the FVV collection the overall accuracy of CL-A classifier drops when it is evaluated with labels from set B. Classes 1 and 5 suffer the biggest decrease in accuracy with class 5 accuracy dropping by over 24 points. CL-B on the other hand, considerably improves this accuracy outperforming CL-A on three of the four classes and providing an average per-class classification gain of over 11 points. This shows that re-training the classifier on user feedback allows it to adapt to user preferences, thereby producing more relevant repairs. Interestingly, not all classes suffer a drop in accuracy when CL-A is applied to FVV-B, class 2 for example, gets a boost of over 15 points (62.74% to 77.78%). This could be attributed to the violating patterns being pruned by manual inspection, thereby making the remaining distribution of patterns easier to separate.
1) Accuracy in a Continuous Cleaning Environment: We evaluate classification accuracy under changing data
distribu-TABLE V. CLASSIFICATION ACCURACY ON REAL DATASETS.
CLASS 1 CLASS 2 CLASS 3 CLASS 4 CLASS 5 CLASS 6 CLASS 7 AVG
FVV-A, CL-A 74.32±2.90 62.74±7.05 96.77±1.74 · 69.18±6.76 · · · FVV-B, CL-A 62.46±2.71 77.78±6.43 97.45±2.01 · 45.00±3.25 · · 70.67 FVV-B, CL-B 82.34±1.84 80.13±6.95 96.03±1.92 · 68.75±3.47 · · 81.81 Clinical-A, CL-A 80.26±1.25 89.47±2.13 70.31±5.71 · 73.89±4.89 · · · Clinical-B, CL-A 72.14±1.52 81.63±1.09 52.31±4.43 · 62.71±5.11 · · 67.19 Clinical-B, CL-B 79.36±1.30 90.01±1.97 71.64±6.22 · 77.47±5.03 · · 79.62
tions and with user feedback. We started with clinical trials data from one country, and incrementally added trials from other countries to simulate a changing data environment. We had the user recommend changes to the existing set of FDs in cases where the FDs did not hold strongly over the newly integrated data. To generate the repair type predictions, we retrained twice (two iterations with user feedback). Table V shows that CL-A suffers an average drop in accuracy of over 10 points on set B whereas CL-B significantly outperforms CL-A across all classes gaining over 12 points on average. We note that this improvement in accuracy in CL-B demonstrates not only the usefulness of user feedback, but the ability of our classifier to adapt to changing data distributions, in this case, the integration of new data. Given the different data distributions for each country, our classifier showed positive gains across all classes with the newly integrated data, and updated set of constraints.
Overall, the results show that we can achieve high clas-sification accuracy to successfully predict repair types. With an average classification accuracy of around 80% (with user feedback) across all data sets, the predictions from the trained classifiers allow us to improve data quality in dynamic settings in a continuous manner (we achieved similar results using other classifiers, 76% accuracy with Support Vector Machines). Moreover, re-training the classifier once a set of repairs is ap-plied to the data significantly improves classification accuracy, allowing the repair process to stay in tune with user preferences and changing application needs. In the next section, we look more closely at the statistical features and their predictive ability towards particular repair types.
D. Statistical Feature Analysis
In this section, we identify the discriminating statistical features that are sensitive to the classification task. We ana-lyzed the weights learned by the logistic classifier to determine statistics that help to predict the type of repair. Figure 2 shows a Hinton weight diagram for the classifier trained on the FVV-B collection. The diagram shows weights for each of the 4 classes (C1,C2,C3,C5) and the 22 statistical features. White and black colors indicate positive and negative correlation, respectively, between the statistical feature and the repair class, and the size of a square is proportional to the magnitude. The magnitude of the weights indicates the strength of the relationship between the statistical feature and its relevance to classifying a pattern to a particular class.
Figure 2 shows that the notable statistical features are g8, g15 and g19. These statistics have the greatest weights (in terms of magnitude) across several classes. Specifically, g8 computes the normalized number of tuples that remain
unresolved after the best (for this pattern) FD repair is applied. This statistic shows a large positive correlation to C1 andC3 indicating that if there are many tuples that remain unresolved even after the best FD repair is applied, then this pattern is not going to be fixed by an FD repair. Conversely, if the number of unresolved tuples is low, then the pattern is likely to be resolved via an FD repair, which is indicated by the strong inverse relationship between g8 andC2.
Statistical features g15 andg19 compute, respectively, the entropy of the non-violating and violating patterns with respect to the antecedent and consequent attributes. We observe that a high entropy value for g15 indicates a high spread among the tuple patterns in the antecedent i.e., many infrequently occurring patterns. Hence, the larger the entropy the less likely we are to find a repairing pattern which satisfies a minimum frequency threshold. This, in turn, makes data repairs less likely which is shown by large negative weights for C3. Conversely, decreasing the likelihood of data repair classes simultaneously increases the likelihood of NOT REPAIRED and FULL/PARTIAL FD REPAIR classes which is indicated by large positive weights for C1,C2andC5.
Similarly, large values of g19 indicate that the right side attribute A has many infrequently occurring patterns that violate the FD. To repair p we need to repair all of these violations. This makes full/partial FD repairs unlikely (negative weights on C2 andC5) since any such repair would have to split the left side pattern into many sub-patterns. The only way that this can be accomplished is by adding a key (or almost key) attribute to the FD. However, the cost of such repair would be too high since it would be modifying the data distribution of the FD. Moreover, since infrequent patterns are cheap to fix via data repairs,pis likely to either be fixed completely (large positive weight on C3) or not get fixed at all (positive weight on C1).
In summary, using a set of statistical pattern features can be an effective way to maintain currency with the data for data cleaning tasks. In our case, we have found entropy-based statistics across data repairs, and pattern based statistics across constraint based repairs to be sensitive to full FD and full data repairs. For large data cleaning tasks in dynamic settings, we can use this information to efficiently compute the likelihood of a particular repair type based on the corresponding statistical values.
E. Repair Accuracy
In this section, we evaluate the benefit ofrepair accuracy (precision) of our classifier over static data cleaning approaches [11]. In particular, we compute the precision as the number of
Fig. 2. Hinton diagram showing the learned feature weights from the logistic classifier.
TABLE VI. REPAIRACCURACY.
Dataset unified-repair classify-repair green vehicles 72.5 92.7
finance 66.3 82.1 veterans 71.6 93.3
Avg 70.1 89.4
correct repairs (as determined by the user) divided by the total number of repairs returned. Using the veterans, green vehicles and finance datasets, we compute the accuracy values for:
1) The repairs returned by the (unmodified) unified repair algorithm by Chiang and Miller (averaged over data and FD repairs) [11].
2) The repairs returned by theclassify-repairsalgorithm (modified to include the classifier recommendations), after successive rounds of re-training and user feed-back. We run the classifier, and if the recommenda-tion is a data repair, we run classify-repairs by only considering data repairs, to get a set of repairs D. Similarly, if the classifier recommends FD repairs, we run classify-repairs by only considering the space of FD modifications, to get a set of repairs C. We report the accuracy ofD∪C.
Results are shown in Table VI. We observe that we can achieve an improvement in average repair accuracy of approx-imately 20% over the unified repair algorithm, which is a static data cleaning solution. This reflects the usefulness of having the user involved in the data cleaning process, and also having the classifier provide targeted repair recommendations to the search algorithm.
Next we consider the benefit of the classifier to the repair algorithm in terms of providing accurate repair type predictions. This will help to reduce the search space of possible repairs and improve repair accuracy. We measured the classifier’s accuracy to predict the correct type of repair (assuming the ground truth is the repair proposed by the user). We measured the running time saved, when a correct repair type was predicted. We count the total number of correct predictions and divide this by the total number of inconsistencies. We ran our classifier using the green vehicles, finance, and veterans real datasets. Results are shown in Table VII.
Finally, when a correct prediction is made, we computed the running time saved for the repair search algorithm, by not having to consider the alternative repairs. Across the datasets, we saved between 13%-19% of the total running time by first applying our classifier followed by the repair algorithm. We
TABLE VII. CLASSIFIERACCURACY.
Dataset Precision % Time Reduction green vehicles 86.4 18.8
finance 72.6 13.7 veterans 82.1 13.1
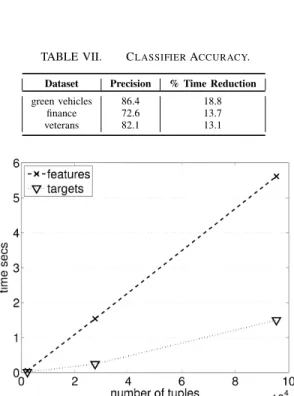
Fig. 3. Average per pattern running times for statistical feature extraction, and target generation versus the number of tuples.
found that we saved the most time when we correctly identified that a constraint repair was needed, as this avoided searching the large space of domain values.
F. Scalability
To evaluate how the system scales with the number of tuples, we computed the average per pattern, statistical feature extraction time for green vehicles, finance and veterans data sets. The plot of the average times versus the number of tuples is shown in Figure 3. Figure 3 also shows the average time per pattern for target generation (finding which target class is best for a violating pattern). Figure 3 reveals that the time needed to compute the features increaseslinearly with the number of tuples. The linear dependence will allow our prediction system to scale well to large databases. Similar linear patterns can be observed for the target generation times.
VII. CONCLUSIONS
As modern applications continue to operate in data inten-sive and dynamic environments, there is an imminent need for adaptive data cleaning solutions that can respond to changing data and application constraint requirements. In this paper, we proposed a continuous data cleaning framework that adapts
to the natural evolution in the data and in the constraints over time. We presented a classifier that predicts the type of repair needed (data, FD or a hybrid of both) to resolve an inconsistency, and automatically learns user repair preferences over time, such that more relevant repairs are generated on suc-cessive iterations. We also presented a set of statistical features that allow our classifier to adapt in dynamic environments, and we showed a subset of these statistics are sensitive to specific types of repairs. We believe our framework can be applied in dynamic data environments to help users better respond to data and constraint inconsistencies, and to minimize the proliferation of these inaccuracies.
Recent work has proposed extending the set of constraints to include more than FDs. This includes work by Fan et. al., who investigates the interaction between record matching and data repair [14]. Specifically, they present a framework that unifies repairing and matching operations to clean a database based on a given set of constraints, matching rules, and master data. Chu et. al., propose a holistic data cleaning approach that allows for a unified set of data quality rules that may include FDs, Conditional Functional Dependencies (CFDs), and Matching Dependencies (MDs) [19]. This can be extended by incorporating Order Dependencies [26], [27] and Sequential Dependencies [28]. It would be interesting to extend our framework to include an expanded set of data quality rules, and to determine the necessary statistics that allow for efficient online, adaptive data cleaning. Finally, missing values have a special semantics [29] that should be considered within our system for both data repair and constraint repair.
REFERENCES
[1] H. Galhardas, D. Florescu, D. Shasha, E. Simon, and C.-A. Saita, “Declarative data cleaning: Language, model, and algorithms,” in
VLDB, 2001, pp. 371–380.
[2] L. Bertossi and L. Bravo, “Generic and declarative approaches to data quality management,”Handbook of Data Quality – Research and Practice, pp. 181–211, 2013.
[3] P. Bohannon, M. Flaster, W. Fan, and R. Rastogi, “A cost-based model and effective heuristic for repairing constraints by value modification,” inSIGMOD, 2005, pp. 143–154.
[4] M. Dallachiesa, A. Ebaid, A. Eldawy, A. Elmagarmid, I. F. Ilyas, M. Ouzzani, and N. Tang, “NADEEF: A commodity data cleaning system,” inSIGMOD, 2013, pp. 541–552.
[5] G. Cong, W. Fan, F. Geerts, X. Jia, and S. Ma, “Improving data quality: Consistency and accuracy,” inVLDB, 2007, pp. 315–326.
[6] W. Fan, “Constraint-driven database repair,” in Encyclopedia of Database Systems, L. Liu and M. T. ¨Ozsu, Eds. Springer US, 2009, pp. 458–463.
[7] F. Geerts, G. Mecca, P. Papotti, and D. Santoro, “The LLUNATIC data-cleaning framework,”PVLDB, vol. 6, no. 9, pp. 625–636, 2013. [8] S. Kolahi and L. V. S. Lakshmanan, “On approximating optimum repairs
for functional dependency violations,” inICDT, 2009, pp. 53–62. [9] M. Yakout, A. K. Elmagarmid, J. Neville, M. Ouzzani, and I. F. Ilyas,
“Guided data repair,”PVLDB, vol. 4, no. 5, pp. 279–289, 2011. [10] A. Arasu, C. R´e, and D. Suciu, “Large-scale deduplication with
con-straints using dedupalog,” inICDE, 2009, pp. 952–963.
[11] F. Chiang and R. J. Miller, “A unified model for data and constraint repair,” inICDE, 2011, pp. 446–457.
[12] G. Beskales, I. F. Ilyas, L. Golab, and A. Galiullin, “On the relative trust between inconsistent data and inaccurate constraints,” in ICDE, 2013, pp. 541–552.
[13] G. Beskales, I. F. Ilyas, and L. Golab, “Sampling the repairs of functional dependency violations under hard constraints,” inPVLDB, 2010, pp. 197–207.
[14] W. Fan, J. Li, S. Ma, N. Tang, and W. Yu, “Interaction between record matching and data repairing.” inSIGMOD, 2011, pp. 469–480. [15] C. Mayfield, J. Neville, and S. Prabhakar, “ERACER: a database
approach for statistical inference and data cleaning,” inSIGMOD, 2010, pp. 75–86.
[16] M. Yakout, L. Berti- ´Equille, and A. K. Elmagarmid, “Don’t be SCAREd: use SCalable Automatic REpairing with maximal likelihood and bounded changes,” inICDE, 2013, pp. 553–564.
[17] F. Chiang and R. J. Miller, “Active repair of data quality rules,” inIJIQ, 2011, pp. 174–188.
[18] J. Rissanen, “Modeling by shortest data description,” Automatica, vol. 14, no. 5, pp. 465–471, 1978.
[19] X. Chu, I. F. Ilyas, and P. Papotti, “Holistic data cleaning: Putting violations into context,” inICDE, 2013, pp. 458–469.
[20] L. Berti-Equille, T. Dasu, and D. Srivastava, “Discovery of complex glitch patterns: A novel approach to quantitative data cleaning,” in
ICDE, 2011, pp. 733–744.
[21] “FDIC institution directory.” [Online]. Available: https://explore.data.gov/Banking-Finance-and-Insurance/FDIC-Institution-Directory-ID-Insured-Insitution-D/sv8z-wqyy
[22] “Green vehicle guide.” [Online]. Available: https://explore.data.gov/Transportation/Green-Vehicle-Guide-Data-Downloads/9un4-5bz7
[23] “Veterans of america dataset.” [Online]. Available: http://mlr.cs.umass.edu/ml/databases/kddcup98/
[24] O. Hassanzadeh, A. Kementsietsidis, L. Lim, R. J. Miller, and M. Wang, “Linkedct: A linked data space for clinical trials,” CoRR, vol. abs/0908.0567, 2009.
[25] S. Yeganeh, O. Hassanzadeh, and R. J. Miller, “Linking semistructred data on the web,” inWebDB, 2011.
[26] J. Szlichta, P. Godfrey, and J. Gryz, “Fundamentals of Order Depen-dencies,”PVLDB, vol. 5, no. 11, pp. 1220–1231, 2012.
[27] J. Szlichta, P. Godfrey, J. Gryz, and C. Zuzarte., “Expressiveness and Complexity of Order Dependencies,”PVLDB, vol. 6, no. 14, pp. 1858– 1869, 2013.
[28] L. Golab, H. J. Karloff, F. Korn, and D. Srivastava, “Sequential Dependencies,”PVLDB, vol. 2, no. 1, pp. 574–585, 2009.
[29] C. Christodoulakis, C. Faloutsos, and R. J. Miller, “Voidwiz: Resolving incompleteness using network effects,” inICDE, 2014, 4 pages (System Demonstration).