Original Article
Gynecol Obstet Invest DOI: 10.1159/000381544
Building a Prediction Model for
Vacuum-Assisted Operative Vaginal Delivery Risk
Arrigo Fruscalzo
a, b
Ambrogio Pietro Londero
c
Angelo Calcagno
c
Irene Cipriani
c
Serena Bertozzi
d
Diego Marchesoni
c
Lorenza Driul
c
a Clinic of Obstetrics and Gynecology, St. Franziskus Hospital, and b Clinic of Obstetrics and Gynecology, University of Münster, Münster , Germany; c Clinic of Obstetrics and Gynecology and d Clinic of Surgery, University of Udine, Udine , Italy
Introduction
Operative vaginal delivery is one of the most challeng-ing obstetrical procedures provided in order to facilitate and expedite vaginal delivery. Its incidence has been de-scribed to be around 10–15%, with variations among dif-ferent countries [1, 2] . Despite attempts to minimize ma-ternal and neonatal morbidity through correct indication and adequate obstetrics skill training, there is an increas-ing awareness of the short- and long-term morbidity of pelvic floor injury as well as of neonatal complications following operative vaginal delivery [3, 4] . Several studies report an increased maternal morbidity for operative vag-inal delivery, mainly related to deep perineal lacerations or episiotomy extensions. According to a meta-analysis, the relative risk for a third- or fourth-degree perineal tear (with or without episiotomy) is higher for forceps com-pared to vacuum delivery (RR 1.89, 95% CI 1.51–2.37)
[5] . Due to the objective of a reduction of maternal pelvic floor injuries, vacuum extraction was advocated as the instrument of first choice for operative vaginal delivery by the American College of Obstetricians and Gynecolo-gists (ACOG) already in 1989. This probably contributed
Key Words
Operative vaginal delivery · Vacuum extraction · Prediction model · Nomogram
Abstract
Aim: The objective of this study was to evaluate the risk fac-tors for operative vaginal delivery and to propose a new no-mogram for predicting the risk. Methods: We retrospective-ly anaretrospective-lyzed the data of 1,955 pregnancies that occurred in our clinic between the years 2007 and 2008. Included were singleton pregnancies with labor diagnosis after the 36th gestational week in which spontaneous or operative vaginal deliveries occurred. In this study, the operative delivery was carried out exclusively by vacuum extraction. Results: After univariate analysis and multivariate logistic regression step-wise model selection, maternal age, nulliparity, medically as-sisted procreation, gestational age at birth, male fetus, epi-dural analgesia and medical induction of labor were found to be the most predictive variables for operative vaginal de-livery. Considering these factors we propose a new nomo-gram for an objectified determination of the risk of operative vaginal delivery. Conclusions: The new nomogram we pro-pose could be an important tool for an objectified determi-nation of the risk of operative vaginal delivery by vacuum extraction in individualized patient counseling.
Received: March 31, 2014
Accepted after revision: March 9, 2015 Published online: April 25, 2015
to an increased incidence of vacuum-assisted vaginal de-liveries in the last decades [6] . Furthermore, the decrease in overall forceps vaginal deliveries and the need for a longer learning curve for forceps compared to vacuum contributed to the progressive reduction in trained ob-stetrical personal [1, 7, 8] .
Even if reduced compared to forceps delivery, vacuum extraction significantly increases the incidence of mater-nal perineal laceration. A recent retrospective popula-tion-based register study considering a sample of 16,802 women whose infants had been delivered by vacuum ex-traction reported an incidence of obstetrical anal sphinc-ter injuries of 3.4% among nulliparous women compared to 1.4% among multiparous women [9] . However, the ad-vantage of a lower incidence of maternal injuries should be counterbalanced by a higher failure rate of vacuum delivery compared to forceps (RR of failure for forceps 0.65, 95% CI 0.45–0.94) [5] .
Furthermore, when considering an operative vaginal delivery by vacuum extraction, considerable neonatal complications, even higher if compared to forceps deliv-ery, should be taken into account. A recent population-based study considering 913 successful vacuum-assisted, full-term deliveries reported scalp edema, cephalhemato-ma and skull fracture in 18.7, 10.8 and 5.0% of cases, re-spectively. Intracranial hemorrhage occurred in 0.87% of cases [10] . In theirs meta-analysis comparing forceps and vacuum extraction delivery, O’Mahony et al. [5] reported for forceps an augmented risk of death or severe morbid-ity (RR 1.65, 95% CI 0.65–4.21), scalp injury (RR 1.36, 95% CI 0.75–2.48), facial injury (RR 5.10, 95% CI 1.12–23.25), intracranial injury (RR 4.83, 95% CI 0.20–115.98) and skull fracture (RR 3.07, 95% CI 0.13–74.99), while there was a lower risk of cephalhematoma (RR 0.64, 95% CI 0.37– 1.11), retinal hemorrhage (RR 0.68, 95% CI 0.43–1.06), jaundice (RR 0.79, 95% CI 0.59–1.06) and admission to a neonatal intensive care unit (RR 0.85, 95% CI 0.52–1.42).
Thus, fear of maternal and fetal complications and consequent medical litigation can in general lead to an increase in the medicalization of vaginal delivery, for ex-ample through the choice of avoiding a home childbirth or a childbirth in a second- or third-level hospital setting, or even the choice of an elective cesarean delivery [11– 13] . For these reasons, quantification of the risk of under-going an operative delivery could be very helpful when counseling a woman before the onset of labor, or even in the early phase of labor.
The objective of this study was to evaluate the risk fac-tors for operative delivery and to propose a nomogram for predicting this risk.
Materials and Methods
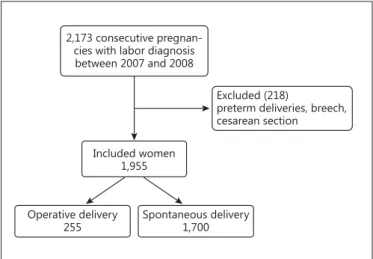
The study was a retrospective cohort study conducted at the University Hospital of Udine. We considered the data on maternal and neonatal outcomes of 2,173 consecutive singleton pregnancies between 2007 and 2008 that were admitted with a diagnosis of la-bor and of patients who were delivered after the 36th week of ges-tation ( fig. 1 ). The inclusion criteria were singleton pregnancies with a diagnosis of labor (uterine contractions accompanied by cervical dilatation ≥ 3 cm) [14] giving birth vaginally after the 36th week of gestation. Exclusion criteria were preterm deliveries before the 36th week of gestation, deliveries by cesarean section and fetal breech presentation. A total of 1,955 pregnancies met the inclusion criteria and were included in the study. In this study, the birth op-eration was carried out exclusively by vacuum extraction and after execution of mediolateral episiotomy as previously described [15] . Furthermore, even if not specified in the clinical files during the study period, usually vacuum-assisted delivery was applied at low or mid planes. The low plane is intended when the leading point of the fetal skull is located at a station ≥ +2 cm from the ischial spine and with a head rotation of less or more than 45°, while the mid plane is intended when the fetal skull station is <+2 cm from the ischial spine but the head is engaged.
In this study we considered the following variables: maternal age at the time of admission, pre-pregnancy body mass index (BMI), weight gain during pregnancy, any previous cesarean sec-tion, parity, medical history of the previous and current pregnancy (pregestational or gestational diabetes, hypertension in pregnan-cy, preeclampsia, eclampsia, intrauterine growth restriction, fetal malformations, type of pregnancy [physiological or assisted], ges-tational age at birth). The population was stratified into pre-preg-nancy BMI according to the categories covered by the IOM (IOM 2009) in its guidelines (<18.5, 18.5–24.9, 25–29.9, ≥ 30). In this study we considered under the heading pregnancy-related hyper-tensive disorders the following conditions as previously defined: preeclampsia, gestational hypertension, and preeclampsia super-imposed on chronic hypertension [16, 17] . The gestational age was estimated on the basis of the date of the last menstrual period,
con-2,173 consecutive pregnan-cies with labor diagnosis between 2007 and 2008
Included women 1,955
Excluded (218)
preterm deliveries, breech, cesarean section
Operative delivery
255 Spontaneous delivery1,700
firmed or corrected by ultrasonography at the first week of gesta-tion.
Also reported were data regarding the neonate: infant sex, birth weight, Apgar scores (at 1 and 5 min), intensive care, neonatal re-spiratory distress syndrome of the newborn and any other related complications and neonatal outcomes during hospitalization. We considered the 10th percentile to define fetuses small for gesta-tional age [18] . We also defined fetuses large for gestational age as those with a birth weight above the 90th percentile. Macro-geo-graphical and cultural areas of origin were considered stratifying the population by macro-regions and cultural backgrounds as pre-viously described in the following groups: Italy and Western Eu-rope, Eastern EuEu-rope, Sub-Saharan Africa, Arabian Countries, Asia, and Other countries [19] .
The Strengthening the Reporting of Observational Studies in Epidemiology (STROBE) criteria for accurate reporting of obser-vational studies were considered [20] .
Statistical Analysis
Statistical analysis was performed by R (version 3.0.1) and was considered as significant a p < 0.05. The normality of distribution was assessed using the Kolmogorov-Smirnoff test. The data were presented by mean ± standard deviation or median and interquar-tile range. We also used odds ratio and 95% CI or a specified refer-ence value (e.g. area under the curve) and 95% CI. During the anal-ysis we used the following statistical tests: in case of continuous variables, Student’s t test or Wilcoxon test; in case of categorical variables, χ 2 or Fisher’s exact test where appropriate. In addition,
Table 1. Description of the study population and outcomes
Operative vaginal delivery (255) Spontaneous vaginal delivery (1,700) p value
Mother’s age, years 31.65±5.39 31.56±5.27a 0.807
Nulliparous, years 31.17±5.41 29.97±5.39 <0.05
Multiparous, years 35.00±3.84 33.00±4.73 <0.05
Weight gain during pregnancy, kg 13.52±4.12 12.83±4.54 <0.05
Pre-pregnancy BMI 21.46±2.73 22.04±3.64 <0.05
Pre-pregnancy BMI classes
<18.5 9.4% (24/255) 7.6% (130/1,700) 0.329
18.5–24.9 80.4% (205/255) 78.4% (1,332/1,700) 0.459
25–29.9 9.0% (23/255) 10.2% (173/1,700) 0.566
≥30 1.2% (3/255) 3.8% (65/1,700) <0.05
Medically assisted procreation 2.0% (5/255) 0.7% (12/1,700) 0.060
Nulliparity 87.5% (223/255) 47.3% (804/1,700) <0.05
Pregnancy-related hypertensive disorders 1.6% (4/255) 0.9% (16/1,700) 0.353
Pre-pregnancy diabetes mellitus 0.8% (2/255) 0.2% (3/1,700) 0.073
Gestational diabetes mellitus 2.4% (6/255) 2.3% (39/1,700) 0.953
Mode of labor
Spontaneous 66.7% (170/255) 83.5% (1,420/1,700) <0.05
Medical induction of labor 25.1% (64/255) 13.5% (229/1,700) <0.05
Oxytocin use 8.2% (21/255) 3.0% (51/1,700) <0.05
Epidural analgesia 51.0% (130/255) 20.2% (344/1,700) <0.05
Gestational age at delivery, weeks 39.65±1.12 39.34±1.14 <0.05
Neonatal weight, g 3,412.58±409.01 3,399.81±418.89 0.643
Large for gestational age neonate 8.2% (21/255) 10.1% (172/1,700) 0.347
Small for gestational age neonate 10.2% (26/255) 8.7% (148/1,700) 0.436
Male gender 56.1% (143/255) 50.4% (857/1,700) 0.091
Outcomes
Apgar score at 1 min 7.8±1.44 8.36±0.9 <0.05
Apgar score at 5 min 8.86±0.62 9.05±0.48 <0.05
NICU hospitalization 1.2% (3/255) 0.8% (13/1,700) 0.496
Neonatal intracranial hemorrhage 0.0% (0/228) 0.1% (1/1,457) 0.692
Perineal tears of 3rd or 4th degree 0.8% (2/255) 0.1% (2/1,700) 0.085
NICU = Neonatal intensive care unit.
a The significance was lost considering nulliparous and multiparous women together because multiparous women were older and almost all delivered spontaneously, thus significantly increasing the age of spontaneous delivery in comparison to nulliparous women alone. Conversely, only 32 multiparous women delivered by vacuum extraction, leading to a lower increase in the age of the general population in comparison to the nulliparous group.
multivariate logistic regression analysis was also performed. In the multivariate logistic regression models all potentially influencing factors and their interactions were accommodated in a single anal-ysis, except when the interaction term was non-significant (in which case we analyzed the no-interaction model). Furthermore, we included in the initial multivariate model all the factors that had a p value <0.200 in univariate analysis and then performed a step-wise selection to obtain the final multivariate logistic regression model. Based on the final multivariate logistic regression model we developed a nomogram [21] .
Results
The average age of the women evaluated in this study was 31.57 ± 5.29 years with a pre-pregnancy BMI of 21.96 ± 3.54. In 99.1% (1,938/1,955) of cases pregnancies were spontaneous, 0.3% (6/1,955) became pregnant following induction of ovulation/intrauterine insemination and 0.6% (11/1,955) after in vitro fertilization/intracytoplas-mic sperm injection. Most of the women were from Italy and Western Europe (83.6%, 1,635/1,955), but there was a large proportion of women from Eastern Europe, Sub-Saharan Africa and Arab countries.
The majority of women had given birth spontaneous-ly (87.0%, 1,700/1,955) while 13.0% (255/1,955) had been subjected to operative vaginal delivery. The indications for operative delivery were arrest of the presenting part (58.6%), a prolonged second stage of labor combined with a pathologic or non-reassuring fetal heart pattern (20.7%), prolonged second stage of labor combined with occiput posterior head position or peridural analgesia (12.7%), lack of cooperation of the women during the sec-ond stage of labor (5.3%) and other indications (2.7%).
We then proceeded to a comparative analysis of spon-taneous and operative delivery risks. In table 1 the char-acteristics of the two populations are compared. We not-ed significant differences with regard to maternal age,
an-thropometric characteristics, parity, type of labor, use of peridural analgesia and gestational age at delivery. We also saw a higher incidence of pre-pregnancy diabetes mellitus and neonatal male gender among women under-going operative delivery.
In table 2 we provide an analysis of the prevalence of operative delivery in the different macro-geographical and cultural areas, and it can be seen that among women from Sub-Saharan Africa there was a significantly lower incidence of operative delivery compared to women from Italy and Western Europe (p < 0.05). There was also a higher prevalence of medically assisted procreation in the operative vaginal delivery group (2.0%, 5/255) than in the spontaneous vaginal delivery group (0.7%, 12/1,700) (p = 0.060).
In table 3 (upper part) we show the results of multi-variate logistic regression analysis (dependent variable = operative vaginal delivery) considering the significant factors found in univariate analysis. In table 3 (lower part) we show the final model of multivariate logistic
Table 2. Prevalence of vaginal operative delivery among women
from different macro-regions Macro-geographical and cultural areas of origin
Prevalence of operative vaginal delivery
p value
Italy and Western Europe 13.8% (226/1,635) reference
Eastern Europe 11.5% (15/130) 0.465
Sub-Saharan Africa 4.1% (3/74) <0.05
Arabian countries 13.3% (8/60) 0.914
Asia 3.3% (1/30) 0.097
Other countries 4.8% (1/21) 0.230
Table 3. Logistic regression multivariate analysis
OR (95% CI) p value
Initialmodel
Mother’s age 1.04 (1.01–1.07) <0.05
Nulliparous women 6.30 (4.18–9.5) <0.05
Medically assisted procreation 2.30 (0.72–7.27) 0.158
Sub-Saharan Africa 0.49 (0.15–1.66) 0.253
Weight gain during pregnancy 1.01 (0.97–1.04) 0.645
Pre-pregnancy BMI 0.97 (0.92–1.01) 0.172
Gestational age at delivery 1.23 (1.08–1.41) <0.05
Epidural analgesia 2.31 (1.71–3.12) <0.05
Medical induction of labor 1.42 (0.99–2.04) 0.054
Large for gestational age neonate 1.1 (0.65–1.87) 0.730
Male gender 1.36 (1.02–1.82) <0.05
PRHDs 1.56 (0.45–5.35) 0.481
Pre-pregnancy diabetes mellitus 3.2 (0.34–30.51) 0.312
Gestational diabetes mellitus 1.26 (0.5–3.2) 0.628
Finalmodelproposedtopredictvaginaloperativedelivery byvacuumextraction
Mother’s age 1.04 (1.01–1.07) <0.05
Nulliparous women 6.74 (4.5–10.09) <0.05
Medically assisted procreation 1.88 (0.61–5.82) 0.271 Gestational age at delivery 1.20 (1.05–1.36) <0.05
Male gender 1.33 (1.00–1.77) <0.05
Epidural analgesia 2.36 (1.76–3.18) <0.05
Medical induction of labor 1.41 (0.99–2.01) 0.053
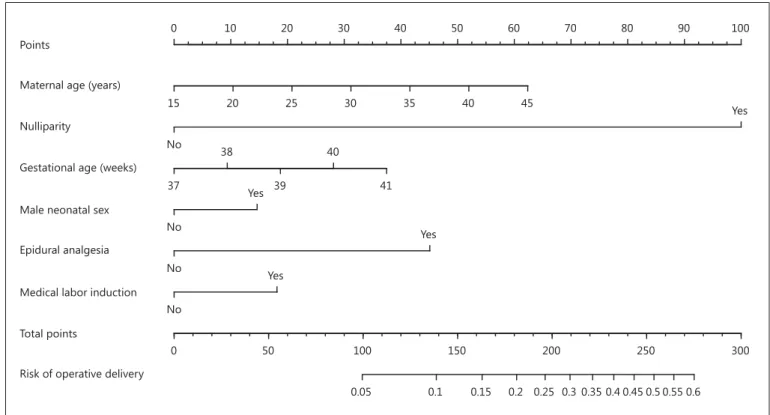
sion analysis that considered only the most predictive fac-tors for operative vaginal delivery. The most significant variables helpful for developing a predictive model by multivariate logistic regression and included in the final model shown were maternal age, nulliparity, gestational age at birth, male fetus, epidural analgesia and medical induction of labor. This model had a good prediction with an area under the curve of 78.3% (95% CI 75.5–80.9). Finally, in figure 2 we report the nomogram derived from the final model of multivariate logistic regression.
Discussion
The need of providing as much objective and individ-ualized counseling as possible to the patient undergoing labor is getting more and more important in recent ob-stetrics. In this study we propose a nomogram for evalu-ating and predicting the risk for operative vaginal deliv-ery.
In our institution, operative delivery was carried out exclusively by vacuum extraction, as the internal rules of our hospital no longer support forceps use. This is in line with the current trend in the world, due to the increased risk of damage to the maternal perineum in association with operative delivery with forceps, and the largest learn-ing curve in the use of forceps rather than the vacuum extractor [22] . The prevalence of operative delivery in this study could be considered quite high (13.0%), but this is due to the selection of eligible patients in this study, ex-cluding patients undergoing cesarean section or deliver-ing before the 36th week of gestation. In fact, in our clin-ic the mean annual incidence of operative deliveries was 8.0% of all deliveries (Internal Audit 2010). The low inci-dence of operative delivery in patients from Sub-Saharan Africa may be due to the higher prevalence of low gesta-tional age at delivery, small for gestagesta-tional age babies and multiparous women [23] .
In univariate analysis, considering multiparous and nulliparous women together, maternal age did not achieve a significant p value. However, we found a significantly
Points
0 10 20 30 40 50 60 70 80 90 100
Maternal age (years)
15 20 25 30 35 40 45
Nulliparity
No
Yes
Gestational age (weeks)
37 39 41
38 40
Male neonatal sex
No
Yes
Epidural analgesia
No
Yes
Medical labor induction No
Yes
Total points
0 50 100 150 200 250 300
Risk of operative delivery
0.05 0.1 0.15 0.2 0.25 0.3 0.35 0.4 0.45 0.5 0.55 0.6
Fig. 2. Nomogram derived from multivariate logistic regression for
the final model considering operative delivery as dependent vari-able. To read the nomogram, draw a vertical line from each tick mark indicating the status of a predictor to the top axis labeled
‘Points’. Sum the points and find the corresponding number on the axis labeled ‘Total points’. Then, draw a vertical line down to the axes showing the probability for an operative vaginal delivery.
higher maternal age in the operative vaginal delivery groups considering separately the nulliparous and mul-tiparous subgroups. In fact, nulliparous and mulmul-tiparous women are two different populations in terms of age. Considering the population of nulliparous and multipa-rous women together, all the nullipamultipa-rous women will fall inside the range of age of spontaneous delivery age distri-bution of multiparous women, and this will result in the inability to finding a statistically significant difference in maternal age. This is probably due to the fact that in mul-tiparous women age acts in a different way compared to nulliparous ones on the need to apply operative delivery.
Furthermore, in univariate analysis there was a signif-icantly greater weight gain in operative deliveries. These data match with data reported in a previous study where a greater weight gain during pregnancy was statistically associated with an increased risk of cesarean section dur-ing labor [13] . However, in this study, the weight gain during pregnancy lost significance in multivariate analy-sis.
According to the final multivariate model, this study shows that we are able to predict the risk of operative de-livery with some simple parameters: maternal age, nulli-parity, medically assisted procreation, gestational age at birth, male fetus, labor analgesia and medical induction of labor. This becomes clearer by analyzing the nomo-gram included in the study ( fig. 2 ). In our reference pop-ulation the basal risk of operative delivery was equal to the prevalence of operative delivery (13% = 0.13). For in-stance, when this nomogram shows us a risk lower than 0.13 we can say that the woman has a low risk profile for operative vaginal delivery. Anyway, in our view it is an important risk of operative delivery that a woman should be willing to take. For example, a possible scenario is a 40-year-old woman with a previous operative delivery that would like to try again to labor, even if she would not like to repeat an operative delivery. With the use of this nomogram, in case of spontaneous labor up to 40 weeks gestation, we can reassure the woman of the low probabil-ity of an operative delivery, and even if, she will benefit from the use of epidural analgesia (risk <0.10). The sce-nario will change with the need of labor induction after 41 weeks (risk of about 0.17).
Comparing our results with the current literature we find a substantial overlap with risk factors considered. In a recent study Mazouni et al. [24] described the most im-portant risk factors related to operative vaginal delivery by forceps. The strongest risk factors for forceps delivery were birth weight >4,000 g, occiput posterior position of the fetal head and epidural analgesia. Other significant
risk factors for forceps delivery were age >35 years, induc-tion of labor as well as a prolonged first and second stage of labor. A less recent study, conducted among pregnant women in New South Wales, Australia, describes the trend of delivery by vacuum extraction and forceps be-tween 1990 and 1997 and the associated risk factors. These again include, among primiparous women, epi-dural analgesia, age >34 years and induced or augmented labor. Interestingly, private care insurance was also re-ported among risk factors [25] . A further interesting study considered the risk factors for operative vaginal de-livery and cesarean section that can be evaluated already at admission. Independent predictors were maternal age and height, pregnancy weight gain, smoking status, ges-tational age and cervical dilatation at admission. Further risk factors occurring during labor were evaluated. These included the presence of dystocia, epidural analgesia and fetal heart rate tracing abnormalities. Similar to our study, the authors concluded that this model, may help to pre-dict the need for operative vaginal delivery or cesarean section in low-risk nulliparous women already at admis-sion [26] .
Study Limitations
The main limitation of this study is its retrospective design. For this reason it will be necessary to evaluate the predictive value of the nomogram created in a prospec-tive observational study to better prove its clinical utility.
Conclusions
As operative delivery can significantly affect the ma-ternal-fetal outcomes, we believe it is important to pro-vide as much objective and individualized counseling as possible to the patient, possibly even before the onset of labor. With our study we propose the use of a new nomo-gram for an objectified determination of the risk of op-erative delivery.
Disclosure Statement
References
1 Royal College of Obstetricians and Gynaeco-logists: Operative vaginal delivery (Green-top Guideline No. 26). https://www.rcog.org.uk/ en/guidelines-research-services/guidelines/ gtg26/.
2 Stephenson PA, Bakoula C, Hemminki E, Knudsen L, Levasseur M, Schenker J, et al: Patterns of use of obstetrical interventions in 12 countries. Paediatr Perinat Epidemiol 1993; 7: 45–54.
3 O’Grady JP, Pope CS, Hoffman DE: Forceps delivery. Best Pract Res Clin Obstet Gynaecol 2002; 16: 1–16.
4 Vacca A: Vacuum-assisted delivery. Best Pract Res Clin Obstet Gynaecol 2002; 16: 17– 30.
5 O’Mahony F, Hofmeyr GJ, Menon V: Choice of instruments for assisted vaginal deliv-ery. Cochrane Database Syst Rev 2010; 11: CD005455.
6 Hehir MP, Reidy FR, Wilkinson MN, Maho-ny R: Increasing rates of operative vaginal de-livery across two decades: accompanying out-comes and instrument preferences. Eur J Ob-stet Gynecol Reprod Biol 2013; 171: 40–43. 7 Macleod M, Murphy DJ: Operative vaginal
delivery and the use of episiotomy – a survey of practice in the United Kingdom and Ire-land. Eur J Obstet Gynecol Reprod Biol 2008; 136: 178–183.
8 Elvander C, Ekeus C, Gemzell-Danielsson K, Cnattingius S: Reason for the increasing use of vacuum extraction in Sweden: a popula-tion-based study. Acta Obstet Gynecol Scand 2013; 92: 1175–1182.
9 Raisanen S, Vehvilainen-Julkunen K, Cart-wright R, Gissler M, Heinonen S: Vacuum-assisted deliveries and the risk of obstetric anal sphincter injuries – a retrospective regis-ter-based study in Finland. BJOG 2012; 119: 1370–1378.
10 Simonson C, Barlow P, Dehennin N, Sphel M, Toppet V, Murillo D, et al: Neonatal compli-cations of vacuum-assisted delivery. Obstet Gynecol 2007; 109: 626–633.
11 Betran AP, Merialdi M, Lauer JA, Bing-Shun W, Thomas J, Van Look P, et al: Rates of cae-sarean section: analysis of global, regional and national estimates. Paediatr Perinat Epide-miol 2007; 21: 98–113.
12 Fruscalzo A, Salmeri MG, Cendron A, Lon-dero AP, Zanni G: Introducing routine trial of labour after caesarean section in a second lev-el hospital setting. J Matern Fetal Neonatal Med 2012; 25: 1442–1446.
13 Driul L, Londero AP, Salvador S, Fruscalzo A, Peris Bhat SA, Citossi A, et al: Retrospective analysis of one year of cesarean sections: indi-cations and risk factors associated with intra-partum cesarean section. Minerva Ginecol 2010; 62: 403–414.
14 Fruscalzo A, Londero AP, Frohlich C, Meyer-Wittkopf M, Schmitz R: Quantitative elastog-raphy of the cervix for predicting labor induc-tion success. Ultraschall Med 2015; 36: 65–73. 15 Bertozzi S, Londero AP, Fruscalzo A, Driul L,
Delneri C, Calcagno A, et al: Impact of episi-otomy on pelvic floor disorders and their in-fluence on women’s wellness after the sixth month postpartum: a retrospective study. BMC Womens Health 2011; 11: 12.
16 Fruscalzo A, Bertozzi S, Londero AP, Biasioli A, Driul L, Kiesel L, et al: Menstrual abnor-malities and predisposition to pregnancy-re-lated hypertensive disorders: a retrospective study. Gynecol Endocrinol 2010; 26: 445–450. 17 Brown MA, Lindheimer MD, de Swiet M, Van Assche A, Moutquin JM: The classification and diagnosis of the hypertensive disorders of pregnancy: statement from the International Society for the Study of Hypertension in Preg-nancy (ISSHP). Hypertens PregPreg-nancy 2001; 20:IX–XIV.
18 American College of Obstetricians and Gyne-cologists: ACOG Practice bulletin no. 134: fe-tal growth restriction. Obstet Gynecol 2013; 121: 1122–1133.
19 Londero AP, Bertozzi S, Visentin S, Fruscalzo A, Driul L, Marchesoni D: High placental in-dex and poor pregnancy outcomes: a retro-spective study of 18,386 pregnancies. Gynecol Endocrinol 2013; 29: 666–669.
20 Gallo V, Egger M, McCormack V, Farmer PB, Ioannidis JP, Kirsch-Volders M, et al: STrengthening the Reporting of OBserva-tional studies in Epidemiology – Molecular Epidemiology (STROBE-ME): an extension of the STROBE Statement. PLoS Med 2011; 8:e1001117.
21 Lubsen J, Pool J, van der Does E: A practical device for the application of a diagnostic or prognostic function. Methods Inf Med 1978; 17: 127–129.
22 Yeomans ER: Operative vaginal delivery. Ob-stet Gynecol 2010; 115: 645–653.
23 Salvador S, Bertozzi S, Londero AP, Driul L, Da Riol R, Marchesoni D: Outcome of preg-nancy for immigrant women: a retrospective study (in Italian). Minerva Ginecol 2010; 62: 277–285.
24 Mazouni C, Porcu G, Bretelle F, Loundou A, Heckenroth H, Gamerre M: Risk factors for forceps delivery in nulliparous patients. Acta Obstet Gynecol Scand 2006; 85: 298–301. 25 Roberts CL, Algert CS, Carnegie M, Peat B:
Operative delivery during labour: trends and predictive factors. Paediatr Perinat Epidemiol 2002; 16: 115–123.
26 Turcot L, Marcoux S, Fraser WD: Multivari-ate analysis of risk factors for operative deliv-ery in nulliparous women. Canadian Early Amniotomy Study Group. Am J Obstet Gyne-col 1997; 176: 395–402.