and computational methods
for mapping
DNA methylation variability
Dissertation
zur Erlangung des Grades des Doktors der Naturwissenschaften der Naturwissenschaftlich-Technischen Fakultät III Chemie, Pharmazie, Bio- und Werkstoffwissenschaftender Universität des Saarlandes
von
Pavlo Lutsik, M.Sc.
Saarbrücken
2016
Prof. Dr. Matthias Hein
Vorsitz: Prof. Dr. Volkhard Helms
DNA methylation is one of the key epigenetic marks extensively studied for its association with environmental exposures and human diseases. DNA methylation can be profiled by a range of methods which differ drastically in their genomic coverage, throughput and resolution. The present thesis encompasses a series of bioinformatic solutions for tackling related data analysis problems.
First, comprehensive and user-friendly tools were developed for processing and primary analysis of bisulfite-based DNA methylation data. The R-package RnBeads supports analysis of genome-scale profiles from Infinium microarrays and bisulfite sequencing, while BiQ Analyzer HT and HiMod enable complete and interactive analysis of deep locus-specific sequencing assays of 5-methylcytosine and its oxidative derivatives. Second, to address cellular heterogeneity in a genome-wide DNA methylation study of birth-weight we proposed an original approach for correcting the statistical analysis. Third, a novel deconvolution method MeDeCom was developed that facilitates data-driven exploration of heterogeneous DNA methylomes.
Collectively, the results of the present thesis comprise different data analysis facets of a large-scale DNA methylation study. Most of the presented bioinformatic solutions already facilitate epigenetic research in numerous life-science groups worldwide.
DNA Methylierung ist eine wichtige epigenetische Modifikation, die besonders in Hinblick auf ihre Assoziation mit Umwelteinflüssen und Krankheiten intensiv untersucht wird. DNA Methylierung kann durch verschidene von Methoden, die sich stark in Bezug auf ihre genomische Abdeckung, den Probendurchsatz sowie ihre Auflösung unterscheiden, ermittelt werden. Die vorliegende Arbeit umfasst eine Reihe bioinformatischer Lösungen, um relevante Probleme der Datenanalyze zu beheben:
Erstens, umfassende und benutzerfreundliche Werkzeuge zur Verarbeitung und primären Analyse von Bisulfit-basierten DNA Methylierungsdaten. Ein R-Paket RnBeads unterstützt die Analyze von genomweiten Infinium Bead Arrays und Bisulfitsequenzierungen. BiQ Analyzer HT und Himod ermöglichen eine volle und interaktive Analyse von lokus-spezifischer Bisulfit-Tiefensequenzierung von 5-Methylcytosin und seinen oxidativen Derivaten.
Zweitens, ein neues Verfaren zur Korrektur der statistischen Analyse, um das Problem der Zellularer Heterogenität des Methyloms in genomweiten DNA Methylierungsstudien zum Einfluss des Geburtsgewichtes zu lösen.
Drittens, eine neue Dekonvolutionsmethode “MeDeCom”, die die Referenz-freie Untersuchung heterogener Datensätze erlaubt.
Zusammengenommen umfassen die Ergebnisse der vorliegenden Arbeit verschiedene Aspekte der Datenanalyse im Rahmen einer großangelegten DNA Methylierungsstudie. Die hier dargestellten Lösungen vereinfachen die Arbeit von Biowissenschaftlern in vielen Forschungsgruppen weltweit.
This doctoral work would have not been possible without generous and sincere help of my colleagues, family and friends whom I owe a deep sense of gratitude.
Firstly, I would like to thank all my co-authors whose work enabled the contributions presented below. My most special co-author Nicole Souren combines many other qualities as my best friend, my wife and the mother of my wonderful son Joep. Nicole supported me enormously throughout the years as a PhD student, standing courageously by my side in all the hurdles and troubles. She granted me more time to work than any other partner would have done, and still had kindness to me even though I did not use it as good as I could. I am also thankful to my constantly worried parents and to my brother Petro, who provided me with helpful advice on broader mathematical issues and intricate subtleties of LaTeX. I enjoyed tremendous support from my family in law whom I want to deeply thank as well.
I am enormously grateful to my supervisor Joern Walter who accepted me as a PhD student in his group in spite of my mediocre wet-lab skills. Joern has given me an unseen freedom to pursue the research directions that, as I believed, were the most fruitful, and had stoic pa-tience all the numerous times when they turned out not to be so. I also appreciate the daily assistance of my colleagues and co-authors for the great years spent in Joern’s lab. Julia Arand was my collaborator and a real friend since the days I was working of my M.Sc. thesis. With Gilles Gasparoni, Karl Nordström and Abdulrahman Salhab we shared the joy of discovering something exciting in the data and frustration about the Linux-based computing infrastruc-ture. Together with Mark Wossidlo, Konstantin Lepikhov, Sascha Tierling, Jie Lan and Pascal Giehr we fought the adverse effects of a sedentary lifestyle at table football. I am thankful to Kathrin Kattler for her kind help in preparing the German version of the Abstract.
I am indebted to Christoph Bock who introduced me to epigenetic research and thereby determined my future career for many years ahead. Together with Thomas Lengauer they have been very demanding and critical, yet fair supervisors of the software projects that I worked on, bringing them to a qualitatively higher level. Yassen Assenov and Fabian Müller were my partners in R coding endeavours from whom I learned so much.
I am grateful to Matthias Hein and Martin Slawski who helped me building a bridge be-tween the fundamental computer science and the cutting edge biological research. Owing to the insightful discussions they had time for, I gained a lot of understanding of deep mathe-matical subjects which I had little chance to obtain elsewhere.
Finally, I thank my closest friends Stephan Neumann, Ayman Heidar and Hassan Soumso-mani for providing such a necessary distraction in those rare days when the routine prevailed over the excitement of the scientific ventures. Although life brings us to different places I keep hoping our friendship will stand this trial.
Throughout a large period of my PhD studies I was supported by the EU Framework Pro-gramme 7, grant agreement No. 267038 (NOTOX).
1 Introduction 1
1.1 DNA Methylation . . . 3
1.1.1 Early observations and the cellular memory hypothesis . . . 3
1.1.2 Genomic distribution, enzymatic setting and removal . . . 3
1.1.3 Origins and cell type-specificity of DNA methylation patterns . . . 5
1.1.4 Individual differences. . . 7
1.1.5 Biological function . . . 8
1.1.6 Association with human disease. . . 9
1.1.7 Dimensions of the DNA methylome variability . . . 11
1.2 Profiling DNA methylation . . . 13
1.2.1 Overview of early approaches . . . 13
1.2.2 The bisulfite method . . . 13
1.2.3 Bisulfite sequencing . . . 15
1.2.4 DNA methylation microarrays . . . 17
1.2.5 Challenges of the DNA methylation data analysis . . . 20
1.3 Tackling heterogeneity of the DNA methylomes . . . 25
1.3.1 Problem definition . . . 25
1.3.2 Cell separation . . . 26
1.3.3 Single-cell methods . . . 27
1.3.4 Computational inference and deconvolution . . . 28
1.4 Outline . . . 31
2 Adult monozygotic twins discordant for intra-uterine growth have indistin-guishable genome-wide DNA methylation profiles 43 2.1 Background . . . 45
2.2 Material and methods . . . 46
2.2.1 Participants . . . 46
2.2.2 Phenotypes . . . 47
2.2.3 Genomic DNA extraction . . . 47
2.2.4 Zygosity confirmation . . . 47
2.2.5 Genome-wide DNA methylation analysis . . . 47
2.2.6 Deep bisulfite sequencing (DBS) analysis . . . 48
2.2.7 DNA methylation analysis of repetitive elements . . . 49
2.2.8 Whole blood and buccal genome-wide reference methylation data . . 49
2.2.9 Data analysis . . . 50
2.2.10 Power calculation . . . 50
2.3 Results . . . 50
2.3.2 Exploratory analysis of the Infinium methylation profiles . . . 50
2.3.3 Cellular composition of saliva as a cause of aberrant methylation profiles 52 2.3.4 Adjustment for cell type heterogeneity . . . 52
2.3.5 Birth weight associated methylation variable positions . . . 54
2.3.6 BW-MVP validation using deep bisulfite sequencing (DBS) . . . 55
2.3.7 HNF4A methylation . . . 58
2.3.8 Global DNA methylation analysis on repetitive elements . . . 58
2.4 Discussion . . . 58
2.5 Conclusions . . . 64
2.6 Accession codes . . . 65
2.7 Supplementary Data. . . 65
3 Comprehensive Analysis of DNA Methylation Data with RnBeads 89 3.1 Main text . . . 91
3.2 Online Methods . . . 94
3.2.1 RnBeads software overview . . . 94
3.2.2 Data import . . . 97
3.2.3 Preprocessing . . . 99
3.2.4 Tracks and Tables. . . 99
3.2.5 Exploratory Analysis . . . 100
3.2.6 Differential DNA methylation . . . 101
3.2.7 Covariate inference . . . 102
3.2.8 Implementation details and package design . . . 103
3.2.9 Scalability and performance . . . 103
3.2.10 Methylome resource . . . 104
3.2.11 Availability and website . . . 104
3.3 Supplementary Material . . . 104
4 BiQ Analyzer HT: Locus-specific analysis of DNA methylation by high-throughput bisulfite sequencing 113 4.1 Introduction . . . 115 4.2 Program Overview . . . 116 4.3 Data Processing . . . 118 4.4 Performance Evaluation. . . 119 4.5 Conclusions . . . 119 4.6 Supplementary Material . . . 121
5 BiQ Analyzer HiMod – an interactive software tool for high-throughput locus-specific analysis of 5-methylcytosine and its oxidized derivatives 125 5.1 Introduction . . . 127
5.2 BiQ Analyzer HiMod . . . 129
5.2.1 Overview . . . 129
5.2.2 Data preparation and project setup . . . 129
5.2.3 Primary processing pipeline . . . 130
5.2.4 Quantification of modification levels . . . 130
5.2.5 Visualization and data export . . . 131
5.2.6 Software architecture, GUI improvements and the new graphics engine 131 5.3 Validation on artificial and real biological data and performance assessment . 133 5.4 Conclusions and outlook . . . 134
5.5 Supplementary Material . . . 134
6 MeDeCom discovers and quantifies latent components of heterogeneous methy-lomes 147 6.1 Background . . . 149
6.2 Results and discussion. . . 150
6.2.1 MeDeCom: a computational framework for decomposition of mixed methylomes . . . 150
6.2.2 Validation on synthetic and artificial data . . . 151
6.2.3 Methylome decomposition of blood cell samples . . . 155
6.2.4 Decomposition of the brain tissue methylomes . . . 158
6.3 Conclusions . . . 160
6.4 Methods . . . 163
6.4.1 MeDeCom element I: mixture model for DNA methylation measurements163 6.4.2 MeDeCom element II: model fitting . . . 164
6.4.3 MeDeCom element III: parameter selection . . . 165
6.4.4 LMC matching . . . 168
6.4.5 Functional annotation of LMC-specific CpG positions . . . 168
6.4.6 Reference-based estimation of the cell type proportions . . . 168
6.4.7 Simulations . . . 170
6.4.8 Infinium 450k data . . . 170
6.5 Availability of data and materials . . . 171
6.6 Supplementary Material . . . 171
7 General Discussion, Conclusions and Outlook 199 7.1 An analytical framework of a large DNA methylation study . . . 199
7.2 Deconvolution of the mixture methylomes . . . 203
1.1 Bases of DNA and 5-methylcytosine . . . 3
1.2 Oxidative derivatives of 5-methylcytosine . . . 5
1.3 Dimensions of the DNA methylation variability . . . 12
1.4 Bisulfite conversion of cytosine to uracil . . . 14
1.5 General scheme of bisulfite sequencing . . . 15
1.6 Infinium type I and type II assays . . . 19
1.7 General scheme of DNA methylation data processing and analysis . . . 21
2.1 Pair-wise Pearson correlations in MZ twins . . . 53
2.2 Adjustment of the association analysis . . . 55
2.S1 Pair-wise correlations for each pair of samples . . . 68
2.S2 Sample-independent Infinium methylation controls . . . 69
2.S3 Sample-dependent Infinium methylation controls . . . 71
2.S4 Pair-wise correlations for each pair of samples, including average blood and buccal epithelium methylomes . . . 72
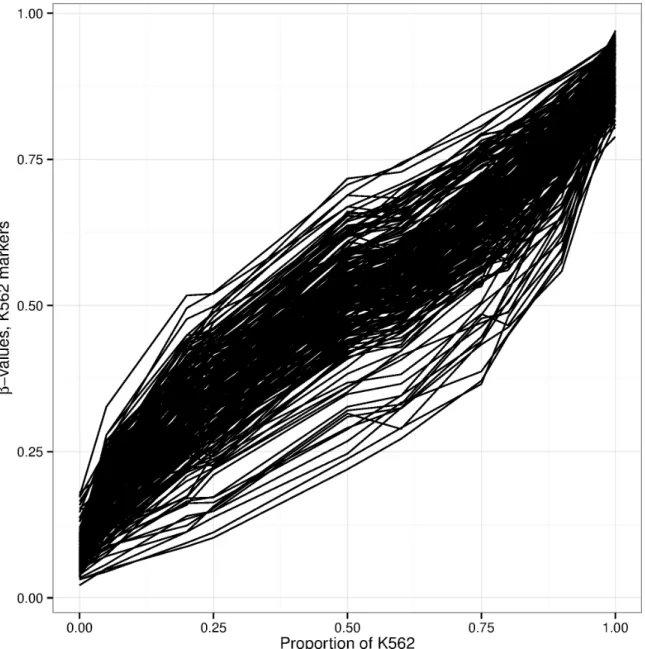
2.S5 Mixing experiment with KG1a and K562 cells. . . 73
2.S6 Array-wide distribution of Pearson correlation to thePTPN7CpG (cg18384097) 74 2.S7 Pair-wise correlations for each pair of samples after adjusting for cell compo-sition . . . 75
2.S8 Examples of methylation profiles generated using the deep bisulfite sequencing 76 2.S9 Correlation plots of Infinium 450k and deep bisulfite sequencing data . . . 77
2.S10 Box plot of the correlation coefficients for Infinium 450 and deep bisulfite se-quencing data . . . 77
2.S11 Infinium 450k and deep bisulfite sequencing data for thePTPN7 marker CpG . 78 2.S12 Continuation of Figure 2.S11. . . 79
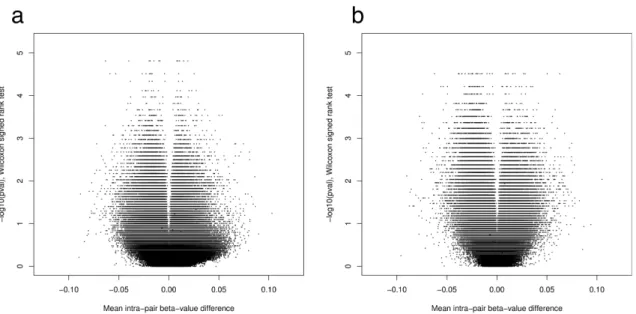
2.S13 Intra-pairβ-value differences at 64 SNP-tagging probes . . . 79
3.1 RnBeads workflow . . . 92
3.2 RnBeads analysis of the RRBS data in stem cells . . . 96
3.S1 RnBeads analysis of a large cancer data set . . . 106
3.S2 RnBeads methylation resource . . . 108
4.1 BiQ Analyzer HT workflow. . . 117
4.S1 Modifications of the sequence alignment alphabet for aligning bisulfite sequences122 4.S2 BiQ Analyzer HT substitution matrix . . . 122
5.1 Principal scheme of oxBS-seq and fCAB-seq methods . . . 128
5.2 BiQ Analyzer HiMod visualization features . . . 132
5.S2 BiQ Analyzer HiMod project heatmap . . . 139
5.S3 BiQ Analyzer HiMod locus heatmap . . . 140
5.S4 BiQ Analyzer HiMod pattern map . . . 141
5.S5 BiQ Analyzer HiMod locus-wide bar chart . . . 142
5.S6 BiQ Analyzer HiMod stacked locus-wide barchart . . . 142
5.S7 Reprocessing of Ficz et al. oxBS-seq data . . . 143
6.1 Computational framework of MeDeCom . . . 153
6.2 Testing MeDeCom on simulated and artificial cell mixture data. . . 153
6.3 Results in blood cell methylomes. . . 158
6.4 Results in brain methylomes . . . 161
6.S1 Efficiency of component recovery in all simulated data sets . . . 174
6.S2 LMC recovery in a hard simulated test case . . . 175
6.S3 λselection for the ArtMixN data set . . . 176
6.S4 Regularization effects upon proportion recovery in ArtMixN data . . . 176
6.S5 Subset of ArtMixN data with NeuN+proportion≥0.5 . . . 177
6.S6 Regression estimated proportions of reference cell types in the control samples of the complete Liuet al.data set. . . 178
6.S7 Estimated Neutrophil proportions in the complete Liuet al. data set, stratified by the 450k microarray plate (Sentrix_ID) . . . 179
6.S8 WB1 data set, matching of LMCs recovered withk= 2andλ= 0.01 . . . 180
6.S9 WB1 data set, comparison of the reference-based proportions of myeloid and lymphoid cell types and LMC proportions . . . 181
6.S10 WB1 data set,λselection (k= 20). . . 182
6.S11 WB1 data set (k = 20,λ= 0.001), heat map of the recovered mixing proportions183 6.S12 Individual-specific LMCs in the WB1 data set (k = 20,λ= 0.001). . . 184
6.S13 WB1 data set, proportion recovery . . . 185
6.S14 Matching the T-cell-specific LMCs from WB1 data set to reference WGBS-based CD4+ T-cell profiles . . . 186
6.S15 Preprocessed Infinium 450k methylation calls in PureBC and WB1 data at 15,000 CpGs with highest cell type specificity . . . 186
6.S16λselection for the PureBC data set (k = 16) . . . 187
6.S17 Matching of the LMCs from the PureBC data to average cell type profiles . . . 187
6.S18 Purified blood cells: methylation level of thePTPRCAPlocus . . . 188
6.S19 FC2 data set, parameter selection . . . 188
6.S20 Functional annotation of frontal cortex LMCs . . . 189
6.S20 Functional annotation of frontal cortex LMCs (continued) . . . 190
6.S21 FC1 data set, example of an LMC1-specific locusPAX6 . . . 191
6.S22 FC1 data set, MeDeCom solution used for the estimation of mixing proportions 192 7.1 Conceptual diagram of the main results.. . . 200
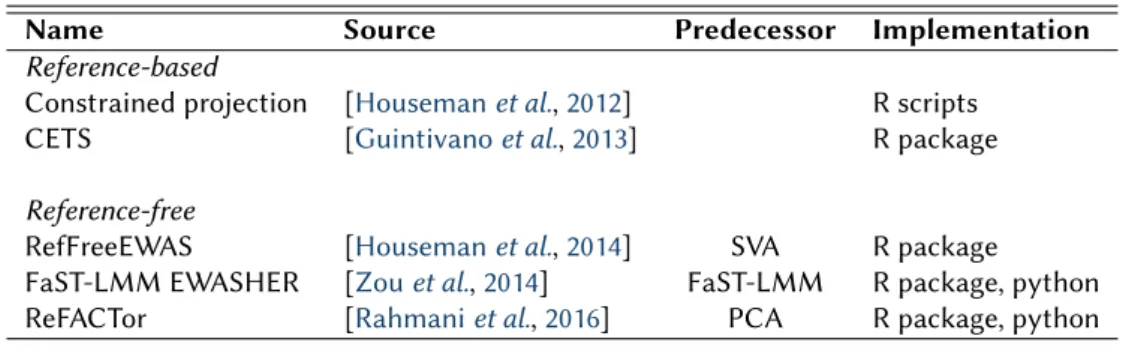
1.1 Computational methods for the correction of cell type heterogeneity . . . 28
2.1 Birth-weight discordant MZ twin characteristics . . . 51
2.2 Eight BW-MVPs validated with DBS . . . 56
2.3 Validation of eight BW-MVPs and thePTPN7CpG using DBS in the 17 discor-dant MZ twins.. . . 57
2.4 Differential methylation analysis of the eight selected BW-MVPs using the In-finium and DBS data . . . 59
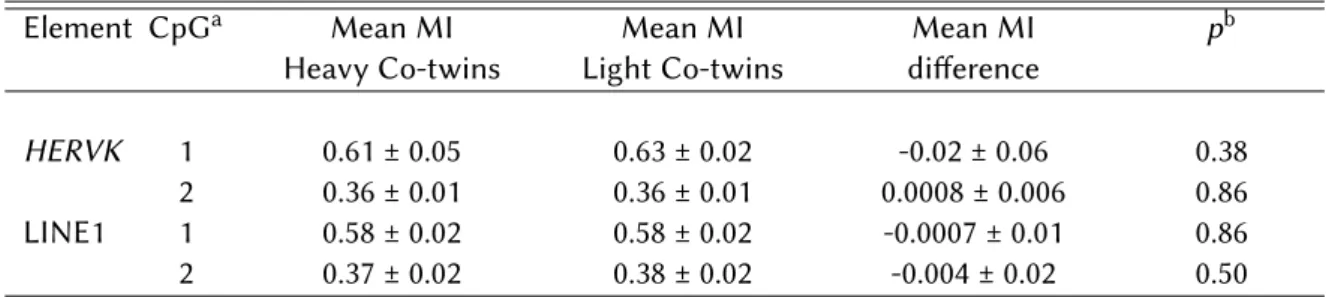
2.5 Methylation analysis ofHERVKand LINE1 in the 16 discordant MZ twins (pair 1 excluded). . . 60
2.6 Genome-wide DNA methylation studies for birth weight. . . 63
2.S1 DNA methylation profiles used to create the cell-type reference data set. . . . 80
2.S2 Cell type-specific quantitative markers used as explanatory variables in het-erogeneity adjustment. . . 80
2.S3 Characteristics of the 45 CpG sites that are significantly differentially methy-lated between the heavy and light co-twins (BW-MVPs) identified using the Infinium HumanMethylation450 BeadChip. . . 81
2.S4 Distribution of the samples across the beadchips, detected CpGs (detectionp -value<0.001) and the corresponding call rate per sample. . . 82
2.S5 Reaction conditions and primer sequences of the bisulfite-PCRs. . . 83
2.S6 Reaction conditions and primer sequences of the SIRPH analysis. . . 84
2.S7 Statistical power of the twin study. . . 84
3.S1 Performance benchmark for large DNA methylation analyses with RnBeads . 109 3.S2 RnBeads perfomance testing . . . 109
4.1 Analysis results generated by BiQ Analyzer HT . . . 120
4.2 BiQ Analyzer HT benchmark against third-party tools . . . 121
5.1 Information about DNA modifications extractable by BiQ Analyzer HiMod . . 128
5.2 BiQ Analyzer HiMod Benchmarking . . . 133
5.S1 Main exported graphics . . . 144
5.S2 Main exported files . . . 144
5.S3 Optionally exported files . . . 145
6.1 Public Infinium 450k data sets . . . 155
6.S1 Parameters for the simulation runs . . . 193
6.S2 NeuN+ and NeuN- fraction proportions in the ArtMixN data set . . . 193
6.S3 Overlap of the LMC1-specific genes with the neuronal subtype-specific hypo-DMRs . . . 194
Introduction
Preface
Epigenetics has greatly contributed to our understanding of how complex and versatile cell phenotypes arise through the interaction of a relatively constant genetic background with environmental influences. Among the so far known epigenetic mechanisms, the phenomenon of DNA methylation has for a long time been in the central focus.
The present thesis deals with methodological aspects of DNA methylation data analysis and provides concrete computational and bioinformatic solutions for its specific problems. Nevertheless, it appears important to first answer the following questions: What is DNA methylation and where is it found with respect to the genome? How are the DNA methy-lation patterns established and get diverse in different cells of an organism? How similar are methylation profiles of different individuals and what are the reasons behind the differences? What are the functions of DNA methylation and which relation does it have to the genetic information? How is DNA methylation linked to diseases and how can this association be studied? Which methods exist to map DNA methylation and what are their strong and weak sides? Which difficulties are they associated with, both wet and dry lab, and which bioin-formatic solutions exist for these difficulties? What is understood under DNA methylation heterogeneity? When is it a problem and how can it be addressed experimentally and compu-tationally?
The purpose of this introduction is to provide a minimal yet sufficient background for un-derstanding the projects summarized in this thesis. The introduction is organized in three parts. Section1.1provides basic knowledge about DNA methylation, its genomic and intra-and inter-organismal patterns, functional role intra-and link to diseases. Section1.2gives a detailed introduction into the methods for mapping DNA methylation, their limitations and data analy-sis aspects. Section1.3outlines the problem of methylome heterogeneity, introduces available experimental and computational methods for addressing it.
1.1
DNA Methylation
The four letter DNA alphabet has been most likely inherited by all known species from their last common ancestor [Szathmáry,2003]. The canonical chemical structure of the the four nitrogenous bases is studied in sufficient detail (Figure1.1) [Townsend,2013]. DNA methyla-tion refers to a covalent modificamethyla-tion of the bases directly in DNA by the addimethyla-tion of methyl groups at strictly defined positions. The most widespread form of DNA methylation is methy-lation of cytosine at the fifths carbon atom of the pyrimidine ring. The resulting base variant is commonly known as 5-methylcytosine (the rightmost structure in Figure1.1).
Adenine Guanine Thymine Cytosine 5-Methylcytosine
N NH N NH2 N N H2 N NH N O N H O N H CH3 O N H O N H 5 NH2 N O N H CH3 NH2 N 1
Figure 1.1:Bases of DNA and 5-methylcytosine.
1.1.1
Early observations and the cellular memory hypothesis
Strikingly, the presence of 5-methylcytosine in a living organism, bacteriaMycobacterium tu-berculosis, was for the first time detected long before anything was known about DNA and its biological role [Ruppel, 1898]. Later it was also found in other prokaryotes [Dunn and Smith, 1955], mammals [Hotchkiss, 1948] and plants [Wyatt, 1951]. While the function of DNA methylation in prokaryotes as a mechanism in a restriction-modification host deference system was elucidated quite early [Arber and Dussoix, 1962; Smith et al., 1972], little was
known about what role it played in higher organisms. Even more puzzling was the complete or near-complete absence of DNA methylation in several important model species such as yeastS. cerevisiaand the fruit flyD. melanogaster [Capuanoet al.,2014].
Observations of the early studies [Srinivasan and Borek,1964] crystallized into a hypothe-sis stating that DNA methylation could be a mitotically heritable mechanism of cellular mem-ory about gene activity states [Holliday and Pugh, 1975; Riggs, 1975]. Evidence supporting the cellular memory hypothesis came from four major directions: i) non-random patterns of 5-methylcytosine across the genome and dedicated molecular mechanisms to propagate these patterns between the cell generations; ii) diversity of methylation patterns across the cells of the same organism; iii) inter-individual differences; iv) participation in mechanisms control-ling activity of the underlying genomic sequence. Each of these aspects are covered in detail below.
1.1.2
Genomic distribution, enzymatic setting and removal
CpGs and mitotic heritability of DNA methylation patterns
The cellular memory hypothesis took into account an earlier finding that in vertebrate genomes 5-methylcytosine was predominantly found to precede a guanine base, i.e. at dinucleotide CpG motifs or, shortly,CpGs[Doscocilet al.,1962]. The fact that CpG is palindromic, i.e. repeats
itself in an anti-parallel fashion on both strands of the same DNA molecule, is directly linked to the propagation of the methylation patterns through the cell divisions. It was shown that af-ter the duplication of methylated DNA the methylation marks were introduced into the newly synthesized DNA strands [Bird, 1978]. Importantly, methyl groups were transferred only to those CpGs which have already been methylated in the original DNA molecule, reproducing its methylation pattern [Bird,1978;Pollacket al.,1980;Steinet al.,1982a]. These findings were
advocating for the earlier suggested semi-conservative mechanism behind the mitotic inheri-tance of the DNA methylation [Holliday and Pugh,1975], establishing the latter as a plausible cellular memory phenomenon.
Genome-wide picture: CpG-dense islands in the genomic sea of methylation
CpG dinucleotides are drastically underrepresented in vertebrate genomes, comprising ap-proximately a quarter of the expected number [Swartz et al., 1962] and have a very
non-uniform distribution across the genome. Experiments with CpG-cutting restriction enzymes revealed that CpGs are clustering in short stretches of 1 to 2 kb where their frequency is an order of magnitude higher than average [Birdet al.,1985;Cooperet al.,1983]. These genomic
regions were termedCpG islands[Bird,1986].
It was also shown that most of the CpGs are methylated, i.e. contain 5-methylcytosine [Bird and Taggart,1980;Ehrlich et al., 1982]. Failure to repair deaminated methylcytosines in the
germline could explain the observed CpG depletion taking place along the evolutionary his-tory [Bird,1980;Coulondreet al.,1978]. The most likely reason behind the local enrichment of
CpG sites was the fact that, unlike the rest of genomic CpGs, the majority of the island CpGs were unmethylated [Bird,1986].
Since then CpG islands have occupied a central place in our view of DNA methylation landscapes. There were several attempts to devise a quantitative definition for a CpG island and its borders which would enable their automatic search and annotation [Gardiner-Garden and Frommer, 1987; Hackenberget al., 2006; Takai and Jones, 2003]. More recent
genome-wide studies extended the perception of a CpG island. In particular, it turned out that DNA methylation is more dynamic in the regions surrounding the islands which obtained a term “CpG island shores” [Irizarryet al.,2008]. CpG island shores are now defined as 2 kb regions
flanking a CpG island upstream and downstream. Furthermore, 2 kb regions flanking the shores are now referred to as “CpG island shelves” [Bibikovaet al.,2011].
Setting and maintenance by DNA methyltransferases
An important and ubiquitous biological mechanism implies the presence of a dedicated en-zymatic machinery. The cellular memory hypothesis suggested two classes of enzymes re-sponsible for setting methylation marks,de novo methyltransferases, methylating previously unmodified DNA, and maintenance methyltransferases copying the established pattern to a newly synthesized DNA strand [Holliday and Pugh,1975]. Subsequently, the first eucaryotic DNA methyltransferase (DNMT1) was discovered [Bestor and Ingram,1983;Gruenbaumet al.,
1982] and subsequently cloned from the mouse [Bestoret al.,1988] and human genomes [Yen
et al.,1992]. Due to a clear preference for a hemimethylated substrate, DNMT1 was assigned
with the maintenance role. Later another family of DNMTs was cloned, which included two candidate de novo DNMTs, DNMT3A and DNMT3B [Okano et al., 1999]. Further research
added new dimensions to the initial simple model of the DNA methylation enzymes [Arand
et al., 2012], but the concepts of the maintenance andde novoactivity are still at the core of
Removal by TETs, oxidative DNA modifications
A more recent advance in DNA methylation research was the discovery of oxidative 5-methyl-cytosine varieties in mammalian brain [Kriaucionis and Heintz,2009;Tahiliani et al.,2009].
Simultaneously, the key players were identified to be the family of ten-eleven translocation (TET) enzymes, TET1, TET2 and TET3 [Tahilianiet al.,2009]. TETs oxidize 5-methylcytosine
to 5-hydroxymethylcytosine with the assistance ofα-ketoglutarate and Fe2+ cations [Delatte
et al.,2014]. Furthermore, it was shown that TETs are capable of catalyzing further oxidation
leading to 5-formyl- and 5-carboxycytosine [Itoet al.,2011;Tahilianiet al.,2009]. Among other,
the evidence was collected that oxidation of 5-methylcytosine by TETs is the initial event of the demethylation cascade [Guoet al.,2011]. The removal of the mark could proceed either as
passive dilution due to inability of DNMT1 to use 5-hydroxymethylcytosine as substrate, or as an active elimination by base-excision repair machinery [Delatteet al.,2014].
5-Methylcytosine 5-Hydroxymethylcytosine 5-Formylcytosine 5-Carboxylcytosine Cytosine
O N H CH3 NH2 N O N H CH2OH NH2 N O N H C O H NH2 N O N H C O OH NH2 N O N H 5 NH2 N 1
Figure 1.2:Oxidative derivatives of 5-methylcytosine.
Summary: the dynamic DNA methylation landscape
The DNA methylation landscape and its dynamics in a typical vertebrate genome looks roughly as follows. 5-methylcytosine is found with almost no exception within CpG dinucleotides, although in certain mammalian cell types, such as stem cells and adult neurons, abundant non-CpG methylation was reported [Lister et al., 2013, 2009]. The genome as a whole has
low CpG density and is hypermethylated, while the short CpG dense islands are predomi-nantly unmethylated. Methylation patterns are set byde novo methyltransferases DNMT3A and DNMT3B and maintained by DNMT1. Furthermore, methylcytosine can be present in ox-idized forms established by TETs. Oxidation by TETs usually precedes the removal of methy-lation. The genomic DNA methylation profile and its temporal changes have to be considered when studying it genome-wide.
1.1.3
Origins and cell type-specificity of DNA methylation patterns
In addition to a complex and, with a high probability, functionally relevant distribution of 5-methylcytosine across the genome it was also noticed that the extent and patterns of DNA methylation vary between different cells of an organism. In early studies these differences were detected both by bulk and locus-specific DNA methylation measurements [Gruenbaum
et al.,1981;Mandel and Chambon,1979; Shen and Maniatis,1980]. Later genome-scale
pro-filing in multiple tissues, cell types and lineages confirmed and extended this knowledge, in particular in human [Eckhardtet al.,2006; Varleyet al., 2013;Zhang et al.,2009; Zilleret al.,
2013]. The current view goes as far as stating that each individual human cell has a poten-tially unique pattern of methylation at approximately 27 million CpGs present in the haploid genome, collectively denoted as theDNA methylome[Pelizzola and Ecker,2011]. It is stunning
that all the observed methylome diversity originates from a single methylation pattern of the zygote.
Global DNA methylation changes in early embryonic development
Valuable insights about the origins of the intra-organismal diversity of the cell methylomes were provided by embryological studies in mammals. It was shown that shortly after fer-tilization the paternal and maternal genomes undergo fast and dramatic DNA methylation changes [Fenget al.,2010; Mayeret al.,2000;Oswaldet al., 2000;Rougieret al., 1998]. First,
a fast TET-mediated demethylation of the paternal genome starts with much of the 5-methyl-cytosine being substituted by 5-hydroxymethyl5-methyl-cytosine prior to the first DNA replication [Iqbal
et al.,2011; Wossidlo et al.,2011]. It is followed by a slower demethylation of the maternal
genome, taking place over the first several replication cycles [Fenget al., 2010; Geiman and
Muegge,2010]. Both pronuclei lose almost a half of the methylcytosine by the time of im-plantation [Alliset al.,2007]. The lowest level of genome-wide methylation is observed in the
preimplantation blastocyst where only 25% of CpGs are methylated [Leeet al.,2014]. The set
of genomic loci maintaining methylation includes, among other, the repetitive elements, such as Intracisternal A-Particle (IAP), and the imprinted loci.
Embryonic stem cells provide a model of the methylome “ground state”
From the bottom levels observed in the blastocyst prior to the implantation, re-establishment of DNA methylation begins, in which a decrease of the TET activity and an increase of de novo methylation DNMT3A/3B play a decisive role [Lee et al., 2014]. Since studying DNA
methylation in a developing embryo is difficult many insights were obtained using embryonic stem (ES) cells. Depending on the culturing conditions ES cells come in two flavours [Ficz
et al.,2013; Habibiet al., 2013]. The “naive” ES cells have a very low global DNA
methyla-tion level and directly correspond to the inner cell mass (ICM) of the pre-implantamethyla-tion mam-malian embryo. The hypermethylated “primed” ES cells correspond to the ICM after a large re-methylation wave taking place around the implantation time [Leeet al.,2014]. They turned
out to be even slightly hypermethylated compared to fully differentiated tissues, which im-plies that the establishment of tissue- and cell type-specific methylomes is also linked to a loss of methylation [Zilleret al.,2013]
High-resolution profiling of the human ES cells showed that DNA methylation at a large portion of CpGs is dynamic and changes throughout the development [Hodgeset al.,2011;
Lau-rentet al.,2010;Listeret al.,2009;Smithet al.,2012;Zilleret al.,2013]. Computational analysis
revealed that ES cells seem to be constantly renewing their methylome to maintain a “clean” epigenetic ground state [Landan et al., 2012]. A high methylome turnover rate at this
tran-sition stage is confirmed by the analysis of hydroxymethylation in “primed” ES cells [Booth
et al.,2012; Ficzet al.,2013]. A stochastic and non-uniform setting of DNA methylation
pat-terns during the transition between the “primed” and “naive” states most probably under-lies the ever increasing diversion of the cell methylomes in the subsequent embryonic and postnatal development [Leeet al.,2014]. Thereby emerging heterogeneity can have several
possible molecular mechanisms, including differential expression or targeting of TETs and DNMTs, strand-specific effects of de novo methylation and oxidation, as well as inefficient maintenance [Leeet al.,2014].
Lineage-commitment leads to a cell type-specific methylome
Diversion of methylation patterns continues during the later developmental stages. A large-scale comparative study of tissues from three different germ layers discovered numerous CpG positions specifically methylated in endoderm, mesoderm and ectoderm [Irizarryet al.,2009].
Lineage determination in hematopoietic cells was shown to cause well defined changes all across the methylome [Jiet al.,2010]. Similar processes were reported to happen during
neu-ronal differentiation [Kim et al.,2014]. As a result, virtually every tissue, cell type and cell
population in an adult mammalian organism is characterized by a specific DNA methylation signature [Listeret al.,2013;Varleyet al.,2013;Zilleret al.,2013].
1.1.4
Individual differences
The next dimension of DNA methylation diversity was discovered when studying differences between individuals [Bocket al.,2008;Eckhardtet al.,2006]. The major drivers of these
differ-ences in a population of healthy human subjects include genetic variation, gender and age [ Pi-razziniet al.,2012].
Interplay with the genotype
Large-scale studies showed that genetic variation explains a significant portion of the observed DNA methylation differences [Gutierrez-Arceluset al.,2013;van Dongenet al.,2016]. This
sta-tistical association can have several aspects. First, given that the majority of somatic cells are diploid, the methylation state of CpGs can differ between the two homologous chromosomes, the phenomenon known asallele-specific methylation (ASM). ASM was shown to be abun-dant in the human genome and mostly driven by polymorphisms directly affecting the CpG cytosines [Shoemakeret al., 2010]. Second, cis-acting genetic variants can be quantitatively
associated with the bulk methylation level at neighboring CpG positions. This type of genet-ically influenced regions were termedmethylation quantitative trait loci(methQTLs) [Rakyan
et al.,2011].
Gender
Chromosomal basis of sex determination in mammals implies that males and females have different DNA methylation landscapes already due to a different number of genomic CpGs. The hemizygous state of chromosome X in human male organisms limits the potential num-ber of possible methylation states at almost 2.5 million CpG positions. On the other hand chromosome Y carries CpG positions which are absent in female organisms. Except for such trivial differences sex-specific methylation on the autosomal loci was observed in numerous studies [El-Maarriet al.,2007;Sarteret al.,2005]. This was later confirmed by several
genome-scale screens [Bokset al.,2009;Liuet al.,2010;van Dongenet al.,2016].
Age
Maintenance errors can accumulate over the lifespan of an individual, resulting in stochastic or directed changes of the methylome. Decrease of 5-methylcytosine abundance over the lifespan was observed very early in multiple vertebrate species [Berdyshev et al., 1967; Vanyushin
et al., 1973; Wilson et al.,1987]. The age-related global hypomethylation was subsequently
confirmed in human [Fukeet al.,2004]. In addition to this pan-genomic effect, it was noticed
2001; Shen et al.,2003] later associated with the bivalent domains [Rakyan et al., 2010]. In
humans these changes seem to occur with a very similar rate across all tissues [Joneset al.,
2015], which allowed the creation of a surrogate DNA methylation age calculator [Bocklandt
et al.,2011;Horvath,2013;Weidneret al.,2014].
On the conceptual level the current view is that age-related changes are a result of two independent phenomena, theepigenetic driftwhich is a, supposedly, stochastic divergence of epigenomes from the common origin over time, and the epigenetic clock implying directed changes of methylation at certain sites [Joneset al.,2015;Teschendorff et al.,2013]. It was,
however, also shown that due to cell type specificity of DNA methylation age-related changes can at least in some cases be a result of changed cellular composition [Jaffe and Irizarry,2014;
Wenget al.,2009].
1.1.5
Biological function
Highly non-random distribution of methylation and CpG dinucleotides over the genomes, the presence of a specialized enzymatic machinery, differences across tissues and cell types as well as variation between individuals suggests that DNA methylation is playing a signifi-cant functional role. Furthermore, the importance of DNA methylation was confirmed by the loss-of-function experiments, which showed that the DNMTs are essential for the mammalian embryonic development [Liet al.,1992;Okanoet al.,1999].
Association with global repression: X chromosome inactivation, imprinted genes and silencing of transposons
The idea that DNA methylation is directly linked to silencing of the underlying genomic re-gions was expressed already as a part of the epigenetic memory hypothesis [Holliday and Pugh, 1975; Riggs, 1975] and supported by gene-specific [Bird, 1978; Christmanet al., 1977;
Desrosierset al.,1979;McGhee and Ginder,1979] and transfection-based experiments [Stein
et al., 1982b; Vardimon et al., 1982]. Later research revealed the essential role of the DNA
methylation in key repressive epigenetic phenomena. First, it was shown that the methyla-tion level of the genes on the inactivated X chromosome is substantially higher compared to the active one [Wolf et al.,1984] and that they can be derepressed by the use of
DNMT-inactivating nucleotide analogue 5-azacytidine [Mohandas et al., 1981; Venolia et al., 1982].
Second, the imprinted genes with parent-of-origin-dependent expression were related to clus-ters of allele-specific differentially methylated regions marking the suppressed allele from the corresponding gamete down to the somatic cells [Bartolomeiet al.,1993;Ferguson-Smithet al.,
1993;Liuet al.,2000;Shemeret al.,1997;Takadaet al.,2002]. Third, since a large portion of the
hypermethylated mammalian genome consists of transposable elements, such as L1 and Alu elements in human, which endanger genomic stability, it was suggested that DNA methylation might be a host defence mechanism of suppressing their activity [Yoderet al.,1997].
Methylation at gene promoters
More than a half of the genes in mammalian genomes overlap with CpG islands [Jones,2012]. A direct silencing-by-methylation model is apparently not applicable here, since the over-whelming majority of them are unmethylated in most of the somatic cells [Jones,1999]. Nonethe-less, the transcription at the overlapping start sites can be blocked irrespectively of their methylation status [Bestoret al.,2015a], apparently involving other mechanisms such as
methy-lated CpG islands overlapping with their TSS, however, most of them are the already described imprinted, X-chromosome and germline-specific genes [Jones,2012].
The methylation at non-CGI promoters was reported to have a more direct relation to DNA methylation [Jones,2012], although this has been put in question [Bestoret al.,2015a].
Genome-wide analysis showed that genes with low CpG density at promoters show inverse correlation of their expression and methylation levels [Gal-Yamet al.,2008]. This is of
partic-ular importance for certain tissue-specific genes, promoters of which are losing methylation only in defined cell types [Han et al., 2011]. One speculated view that can explain the
ob-served statistical relations between methylation and transcriptional activity is an epigenetic “lock” model, where DNA methylation is acting as a stabilizer of the inactive state established through other mechanisms [Jones,2012].
Methylation of gene bodies and regulatory elements
Gene bodies, as regions generally having low CpG density, are methylated [Jones,2012]. This might be necessary to suppress numerous repetitive elements. Moreover, it was also observed that methylation of the gene bodies is positively correlated to the transcriptional level of re-spective genes [Jones,2012]. This might be linked to the necessity of suppressing alternative transcription initiation sites [Maunakeaet al.,2010] and is speculated to play a role in
splic-ing [Laurentet al.,2010;Maunakeaet al.,2010].
Methylation was found to have a particular pattern at genomic regulatory regions. En-hancers, which are key to the fine cell type-specific control of gene activity, were associated with low methylated regions (LMRs) [Stadleret al.,2011]. The LMRs either indicate a very
dy-namic methylation of enhancers or the presence of several cell subpopulations. Finally, DNA methylation was implicated with altering the functional state of insulators which control the action of enhancers [Jones,2012].
Summary: DNA methylation may not be the major regulator, but it is a reliable marker
It is now apparent that the direct silencing of genes byde novomethylation, suggested a part of the epigenetic memory hypothesis, is not a universal mechanism of gene regulation [Jones,
2012]. Although the association with repression is strong in phenomena as X chromosome in-activation and imprinting, subsequent research has revealed numerous exceptions and coun-terexamples to the simple model of mechanistic gene deactivation [Schübeler,2015]. The very question whether DNA methylation plays any causal role in regulation or is merely an indi-cator mark which faithfully follows other driving regulatory mechanisms remains a matter of a fierce scientific debate [Bestoret al.,2015a,b;Ngo and Sheppard,2015;Wilkinson,2015].
Nonetheless, even if the latter is true this does not diminish the importance of DNA methyla-tion mapping. DNA methylamethyla-tion may not be instructive in the differentiamethyla-tion process, but it provides a reliable record of the current functional state of a cell reflecting cell type, subtype or population which is of utter importance for many applications [Schübeler,2015].
1.1.6
Association with human disease
Regardless of its causality, the strong association with gene activity and regulation automati-cally implies that DNA methylation can be changed when the gene function is distorted as a result of certain environmental influences as well as pathological conditions. Below the major results of DNA methylation research in the context of diseases and environmental exposures
are reviewed. The concept of DNA methylation association studies, which are the primary instrument of this research field, is introduced at the end.
Imprinting disorders and other “monogenic” diseases
Overwhelming evidence about epigenetic diseases was obtained in single-gene disorders af-fecting the imprinted genes. Beckwith-Wiedemann syndrome characterized by growth ab-normalities at birth is the most well-known example of such disorder. It was shown that the affected individuals have DNA methylation defects in the imprinted cluster which includes H19/IGF2,SLC22A1,LIT1and several other genes [Feinberg,2007]. Several other similar disor-ders were described (Prader-Willy, Angelman, PHPIA syndromes) which are associated with lesions at theSNURF-SNRPN/UBE3Aimprinted locus [Horsthemke and Buiting,2006]. In ad-dition to the imprinting disorders, several diseases are known that are directly linked to muta-tions in epigenetic machinery proteins. For instance, mutamuta-tions inMeCP2gene are associated with Rett syndrome, while ICF (immunodeficiency, centromeric instability, facial anomalies) is apparently caused by mutations ofDNMT3B[Feinberg,2007].
Cancer
Cancer cells have widespread perturbations of their epigenomes, involving drastic changes of the DNA methylation landscape [Feinberg,2007]. A widely accepted model associates the ma-lignant transformation with global hypomethylation andlocus-specific hypermethylation[
Es-teller,2007].
Cancer-related hypomethylation [Feinberg and Vogelstein,1983] was shown to play a role in erroneous activation of tissue-specific CGI-promoters, normally expressed only in defined tissues [Feinberg and Tycko,2004]. Famous examples include the testicle-specificMAGEand CAGE, hypomethylated and expressed in melanoma and digestive tract malignancies, respec-tively. Furthermore, since DNA methylation is a known mechanism of transposone silencing, widespread hypomethylation is a hallmark of a global or focused genomic instability associ-ated with severe chromosomal abnormalities in several cancers [Feinberg,2007].
More recently discovered focal hypermethylation is known to occur at specific promoters, many of which are of the tumor-suppressor genes [Feinberg and Tycko,2004]. Retinoblastoma gene (RB) was the first well-described and proved example of a tumor-suppressor which is hypermethylated in the corresponding cancer type [Greger et al., 1989; Sakai et al., 1991].
Since then the cancer-attributed hypermethylation was described at many other loci, such as p16(INK4),CDKN2A,VHL,MLH1etc.
Subsequent research revealed that the involvement of epigenetic phenomena might be fundamentally linked to the malignant transformation. It was discovered that many types of cancer are associated with mutations in one or more key players [Plasset al., 2013]. For
in-stance,TET2mutations were detected in multiple blood cancers, whileDNMT3Ais frequently affected in acute myeloid leukemia [Schübeler,2015].
Despite the stunning aberrations cancer cell methylomes maintain the signature of the cell type they originated from [Chenet al.,2016]. In the future this should enable the
tissue-of-origin detection based on the profiling of a tumor sample particularly useful in te analysis of metastasis [Heyn and Esteller,2012].
The initial success in finding associations between DNA methylation and cancer provoked large scientific efforts aimed at comprehensive characterization of the cancer methylome. DNA methylation is one of the focuses in such large research consortia as The Cancer Genome
Atlas (TCGA) [Noushmehr et al., 2010] and the International Cancer Genome Consortium
(ICGC) [Hudsonet al.,2010].
Complex diseases and environmental influences, EWAS
DNA methylation changes were a matter of research in other common diseases, such as car-diovascular disorders, metabolic syndrome, autoimmunity, neurodegeneration etc [Michels
et al.,2013]. Most of the investigations are performed in a form ofepigenome-wide association
studies(EWAS) analogously to the genome-wide ones (GWAS) [Rakyanet al.,2011]. As a rule,
EWAS use one of the available genome-scale technologies to profile methylation in affected individuals and unaffected control subjects. EWAS aim to detect single CpGs or complete loci (commonly referred to asbiomarkers) that are statistically associated with the phenotype or exposure. In order to guarantee the statistical soundness and biological reproducibility EWAS are required to fulfill a number of technical, design-related and reporting standards, thoroughly reviewed elsewhere [Heijmans and Mill,2012;Michels et al.,2013; Rakyanet al.,
2011].
So far, the results of several hundred DNA methylation EWAS were published, which vary widely in the target phenotype or environmental factor, study design (case-control cohorts, monozygotic twins, family trios), sampled tissue or cell type and the used profiling technol-ogy [Michels et al.,2013]. The non-cancer EWAS predominantly use whole blood as a DNA
source since the affected tissue is either unknown or difficult to sample.
Among the plethora of EWAS there are a few success stories. Several potentially causal DNA methylation variants were detected in a large study for rheumatoid arthritis [Liuet al.,
2013]. Based on an EWAS in the post-mortem brain tissue ANK1 and several other genes were found to be significantly associated with the Alzheimer’s disease [Lunnonet al.,2014].
Furthermore, EWAS approach was successful in identifying the influence of environmental effects such as smoking, diet or exposure to potentially dangerous substances and physical factors. For instance, in a well-designed EWAS the smoking status was credibly associated with DNA methylation changes atF2RLlocus [Breitlinget al.,2011].
One particular environmental exposure has direct relation to the present thesis. In the context of the metabolic syndrome it was hypothesized that the so called fetal programming, i.e. predetermination of the metabolic patterns in utero, may play a role. DNA methylation is one of the speculated mechanism behind such programming [Heijmans et al., 2008]. An
EWAS study presented in Chapter 2 tests this hypothesis in a cohort of monozygotic and, hence, genetically identical twins severely discordant for birth weight.
1.1.7
Dimensions of the DNA methylome variability
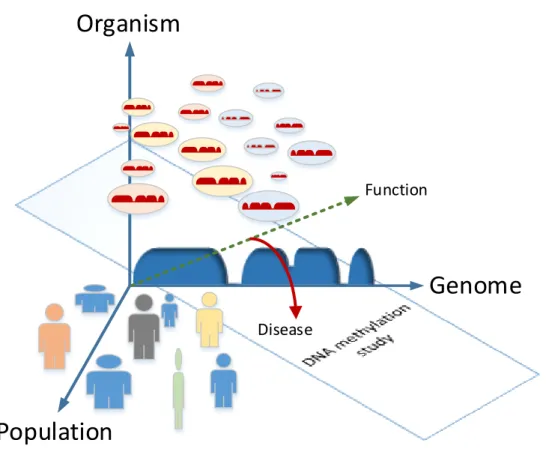
A brief review of DNA methylation given above can be summarized as a diagram in Figure1.3. One can stratify three major directions of DNA methylation variability in a fixed species. The first dimension is the characteristic non-random distribution of DNA methylation across the genome, which is usually understood as the dynamic DNA methylation landscape. The second dimension is the variability between cells of the same organism, determined by cell linage, type and population. The third important coordinate is represented by differences between organ-isms in a population, driven by genetic factors, gender, age and disease-related environmental factors. The temporal coordinate reflecting DNA methylation changes with time is convoluted into each of the thee dimensions above. The biological function of methylation can be seen as a resulting vector in these three variability dimensions. A typical DNA methylation study cannot capture the complete variability space and can be compared with a lower-dimensional
plane providing for a cross-sectional view. The task of the subsequent computational analy-sis is largely aimed at reconstructing the complete picture based on an achievable projection. The experimental and computational methodology behind the DNA methylation analysis is introduced below. Disease Function
Genome
Organism
Population
Figure 1.3:Dimensions of the DNA methylation variability. The genomic, intra-organismal and
pop-ulational components are represented by coordinates of a three-dimensional variability space. The basis is orthonormal for the sake of demonstration, as in reality the above components are clearly not independent. The profile along the genomic coordinate rep-resents a typical DNA methylation landscape with an overall high methylation level but featuring focally absent or decreased methylation at CpG islands and regulatory elements. Cells of different types (color coded) carrying type-specific variants of this landscape are representing the intra-organismal variability dimension. Finally, the individual variability of the global and cell type-specific landscapes, supplemented by genetic, gender-specific and age-attributed effects is visualized by human figures along the “Population” coordi-nate. The resulting cellular function of a cell type- and individual-specific methylome can be seen as a (dotted green) vector in this three-dimensional space representing a combi-nation of all three variability components. The two-dimensional plane represents a cross-sectional approach behind a typical DNA methylation study that tries to stratify certain variability sources of interest and diminish the irrelevant ones (allegorized by the angle of the plane).
1.2
Profiling DNA methylation
The current view of DNA methylation, briefly outlined above, is a result of an immense progress in the methodology over the last several decades [Harrison and Parle-McDermott,
2011]. In this period the throughput and resolution of the profiling methods grew from bulk measurements of total 5-methylcytosine in a biological specimen to the CpG and single-molecule resolution maps available at the moment. This section first gives a brief retrospective overview of early approaches, then describes the bisulfite method that topped the early devel-opment efforts, and finally introduces two classes of high-throughput bisulfite-based profiling strategies of great relevance for the present work. The section is concluded by an overview of the technology-specific and more general data analysis aspects.
1.2.1
Overview of early approaches
First methods for DNA methylation analysis did not produce profiles of any kind, but allowed bulk measurements of relative 5-methylcytosine content using various types of chromatog-raphy [Bestor et al., 1984; Kuo et al., 1980], radiolabeling [Wu et al., 1993] and
immunola-beling [Wu et al., 1993]. Later the gene-specific techniques came of age, based on the
ac-tion of methylaac-tion-sensitive restricac-tion enzymes combined with radiolabeling and subse-quent thin-layer smears [Cedaret al.,1979] or Southern blotting. This method was later
ex-tended to a genome-wide setting and became known as restriction landmark genomic scanning (RLGS) [Hatadaet al.,1991;Hayashizakiet al.,1993; Kawaiet al.,1993]. The antibody-based
methods enjoyed intensive development in subsequent years. Immunolabeling combined with fluorescent microscopy has become a workhorse method in developmental biology [Mayer
et al.,2000;Oakeleyet al.,1997;Santoset al.,2002] facilitating the studying of DNA
methyla-tion on the cell-to-cell basis, and is widely used till today. With the boost of microarray and next-generation sequencing technologies, immunoprecipitation of methylated DNA formed a basis of several high-throughput methods [Keshet et al., 2006; Weberet al.,2005]. Despite
the significant progress, all the above approaches had limited capacity for gene-specific and especially genome-wide studies and were superseded by the methods based on the bisulfite conversion.
1.2.2
The bisulfite method
Sulfonation of certain pyrimidines by sodium bisulfite was known long before it was applied to DNA methylation profiling [Hayatsuet al.,1970]. It was later shown that this reaction had
different kinetics for cytosine and 5-methylcytosine [Wanget al.,1980]. Finally, Frommeret al.demonstrated that these differences could be used to study DNA methylation patterns using sequencing [Frommeret al.,1992].
The idea of the bisulfite method is to transform the initial methylation mark into a base-change detectable by a variety of existing methods. The bisulfite conversion is a three-step procedure schematically illustrated in Figure 1.4. Its final result is a conversion of an un-methylated cytosine to a uracil. Effectively, when applied to a pool of DNA molecules the bisulfite conversion leads to a substitution of the unmethylated cytosines with uracils, while the methylated ones remain cytosines.
Bisulfite-induced base changes can be read out using a number of methods. Early non-sequencing approaches were predominantly adaptations of well established genetic analysis methods, and included methylation-specific (MS-) variants of PCR [Hermanet al.,1996], single
Sulfonation Deamination Desulfonation O N NH2 + HN HSO−3 OH− O N SO−3 NH2 + HN H2O NH+4 O N SO−3 O HN OH− HSO−3 O N O HN
Cytosine Cytosine-SO3 Uracil-SO3 Uracil
1
Figure 1.4:Bisulfite conversion of cytosine to uracil.
nucleotide primer extension (MS-SNuPE) [Gonzalgo and Jones, 1997], single-strand confor-mation analysis (MS-SSCA) [Biancoet al.,1999]. Such methods as, for instance, the combined
bisulfite restriction analysis (COBRA) [Xiong and Laird,1997] make use of the emergence or loss of restriction cutting sites to determine the methylation state of a CpG position. Finally, a number of more exotic methods was developed, for instance, the high-resolution melting curve analysis [Wojdacz and Dobrovic, 2007]. Nevertheless, sequencing methods reviewed below have been proven as the most efficient way to read out the bisulfite-based methylation information.
A modified treatment detects oxidative methylcytosine derivatives
Oxidative forms have different reactivity in the ordinary bisulfite conversion. 5-hydroxy-methylcytosine stays predominantly unconverted, while 5-formyl- and 5-carboxylcytosine are deaminated to uracil [Huang et al., 2010; Nestor et al., 2010]. In other terms, the
ordi-nary bisulfite readout corresponds to a bulk measurement of 5-methyl- and 5-hydroxymethyl-cytosines. Newly invented techniques enable detection of such modifications by combining ordinary bisulfite with a modified treatment which has a different outcome. For instance, oxidative bisulfite protocol applies a soft oxidizing agent KRuO4 to convert hydroxy- to 5-formylcytosine [Boothet al.,2012]. The bisulfite readout after the oxidative step results in a
5-methylcytosine profile with a single-basepair resolution. By comparing the readouts with and without the oxidative step one can estimate a bulk amount of 5-hydroxymethylcytosine at each CpG. Similar techniques were developed to enable estimation of 5-hydroxymethyl-cytosine as well as other oxidative modifications [Ito et al., 2011; Song et al., 2013]. More
detailed background about these methods, their capacity and limitations is given in Chapter5.
Problems of the bisulfite method
It is important to understand that bisulfite conversion, just like any other chemical reaction, can never guarantee a 100% yield. In the context of methylation state calling, both errors are possible, – underconversion, when unmethylated cytosines are not converted to uracils, and overconversion, when methylated cytosines are deaminated to uracils [Genereuxet al.,2008].
Proper consideration of the inevitable conversion errors is an important part of the bisulfite-based data analysis.
Mun->>CCGGCATGTTTAAACGCT>> <<GGCCGTACAAATTTGCGA<<
mC mC
mC mC mC
>>UCGGUATGTTTAAACGUT>> <<GGUCGTACAAATTTGCGA<< Bisulfite conversion
Top strand Bottom strand
OT >>TCGGTATGTTTAAACGTT>>
CTOT <<AGCCATACAAATTTGCAA<< >><<GGCCAGTCCATGTAGCAAATTTGTTTAAACGCGACT>><< CTOBOB
PCR amplification
Figure 1.5:General scheme of bisulfite sequencing. Each of the four strands at the bottom can give rise
to a sequence read. OT, original top strand; OB, original bottom strand; CTOT, complement of the original top strand; CTOB, complement of the original bottom strand. The figure was adapted from [Kruegeret al.,2012]
sonet al.,2007]. This decreases the applicability of bisulfite-based methods to low-input
sam-ples and in certain protocols requiring that the DNA fragments remain intact after the treat-ment (e.g. if they were preliminary ligated to adaptors).
1.2.3
Bisulfite sequencing
Sequencing was originally the first method to read out the methylation signal from the bisul-fite converted DNA. Along with the bisulbisul-fite treatment a subsequent PCR amplification was introduced [Clarket al.,1994;Frommeret al.,1992] which is currently an integrative step of all
bisulfite sequencing protocols. In accordance with the base-pairing rules the uracils, substitut-ing the previously unmethylated cytosines, are replaced by thymines in the PCR (Figure1.5). Later, bisulfite converted DNA was sequenced using Sanger machines in such assays as direct sequencing [Eckhardtet al.,2006;Rakyanet al.,2004], giving a quantitative readout per
CpG, and clonal bisulfite sequencing, generating full methylomes for a representative sample of several dozen DNA molecules. First bioinformatic solutions were developed, e.g. ESME, optimizing the signal processing of electropherograms [Lewinet al.,2004], and BiQ Analyzer,
automating the laborious and time-consuming analysis of the clonal sequences [Bocket al.,
2005].
Next-generation sequencing (NGS) revolutionized the field enabling DNA methylation profiling on an earlier unseen scale and resolution [Laird,2010]. The line of method develop-ment bifurcated at the trade-off between the genomecoverage, i.e. the number of sequenced base-pairs of the genomic reference and the sequencingdepth, i.e. the average number of times a given genomic base-pair is covered by sequence reads. Locus-specific approaches utilize the large amounts of reads to achieve very high sequencing depth at selected regions of interest. Genome-scale methods have similar depth to the pre-NGS approaches, but reach coverage at a large portion of the genome, up to covering its complete mappable part (whole-genome methods).
High-throughput locus-specific bisulfite sequencing
There are several ways to prepare a bisulfite sequencing library for a locus of interest. The most common one is to design a pair of PCR primers hybridizing to the bisulfite converted DNA and amplify a short fragment (amplicon) containing the target CpG sites. Primer design should be performed with certain precautions, e.g. the primer sequences should not contain any under-lying CpGs, and can be aided by specialized tools [Tusnádyet al.,2005]. The amplicon-based
approach is single-stranded by design, and when information from both strands is desired they can be amplified after adding a so called hairpin linker to one of the double stranded fragment ends [Lairdet al.,2004].
Massively parallel pyrosequencing [Margulieset al.,2005], commercially available as Roche
454 platform, was applied to sequence amplicon-based libraries. A pilot study in normal blood cells and several types of leukemia [Tayloret al.,2007] demonstrated the power of the method,
allowing for simultaneous analysis of 25 CpG-rich regions in over 40 samples. On average over 1600 sequence reads were generated for each case which is two orders of magnitude more com-pared to the clonal bisulfite sequencing. This supplied the researchers with a detailed picture of methylation pattern heterogeneity in multicellular samples. This approach was further val-idated and improved in several follow up studies [Grieset al.,2013;Korshunovaet al.,2008;
Varleyet al.,2009]. Later, Illumina introduced MiSeq thereby increasing the throughput of the
locus-specific studies by an order of magnitude. The numbers of reads are now reaching tens of thousands per sample-locus pair, challenging the currently available specialized software packages.
Genome-scale bisulfite sequencing
An umbrella of genome-scale methods covers the protocols in which a sequencing library cov-ers a significant portion of the genome, and the included CpGs are from multiple distant loci. Whole-genome bisulfite sequencing (WGBS) is the most generic approach, when a prepared li-brary is not biased towards any underlying region type. Several other methods decrease the se-quencing burden by enriching the library for certain kind of regions. Reduced-representation bisulfite sequencing (RRBS) creates preference for the CpG-dense regions, predominantly CpG islands, by the use of restriction enzymes with a CpG dinucleotide in their cutting motif, e.g. MspI [Meissner et al., 2005]. More recent capture-based approaches [Li et al., 2015] enrich
the library for target regions using the pools of immobilized oligonucleotides, e.g. bound to magnetic beads. The hybridized target DNA is pooled out and sequenced.
First full methylome was obtained by WGBS of a plant organism. In 2008 a complete genome-wide methylation pattern of Arabidopsis thalianawas obtained [Cokus et al., 2008].
As a first genome-scale effort in mammals, a mouse RRBS library was sequenced on a Genome Analyzer machine [Meissneret al.,2008]. Shortly thereafter the first complete and single-base
resolution human methylomes were published by Lister and colleagues [Lister et al., 2009].
This pilot study was followed by numerous other reports delivering the first complete methy-lomes for various human cell lines and tissues [Laurentet al.,2010;Zilleret al.,2013].
Mod-ified bisulfite conversion protocols, such as OxBis-Seq and TAB-Seq, were also used in com-bination with high-throughput sequencing to map oxidative modifications on a genome-wide scale [Boothet al.,2012;Itoet al.,2011;Songet al.,2013].
Limitations and further progress
Bisulfite sequencing methods made an enormous contribution to the current knowledge of DNA methylation. It is responsible for many breakthroughs in understanding of DNA methy-lation landscapes and dynamics described in Section1.1. However, a number of serious draw-backs limits their wider application keeping the alternative approaches in the feasibility range. One serious limitation is the cost, with the price of a complete WGBS experiment is still at the mark of 3000 Euro. This is the main reason why to date WGBS was mainly used in global epigenomic mapping efforts aiming at reference methylomes such as ENCODE [Bernstein
et al.,2010], Roadmap [Roadmap Epigenomics Consortiumet al.,2015], BLUEPRINT [Abbott,
2011] and DEEP (http://www.deutsches-epigenom-programm.de). The price seriously
lim-its the application of WGBS in EWAS using large cohorts of hundreds to thousands individuals. Due to its high resolution and low error rates, the comparatively cheaper deep locus-specific sequencing is a gold-standard method for the candidate-gene studies and EWAS verification. However, even here many studies decide for the obsolete, yet less costly methods.
The second limitation is the minimal amount of input material. Conventional WGBS pro-tocols still require 105cells to construct a reasonable library. This underlies the methylome heterogeneity problem, introduced in the Section1.3below. It is also tightly linked to an issue of over-amplification, inherent to all bisulfite sequencing protocols featuring a PCR step. The fewer cells are submitted to bisulfite treatment, the higher should be the rate of post-bisulfite PCR amplification to deliver enough material for the library preparation. As a result, the ma-jority of generated sequence reads are in fact stemming from the very same original DNA fragments and are known as PCRduplicates.
Current progress in the development of genome-scale bisulfite sequencing methods is aimed at improving single-molecule resolution and decreasing the amount of the input mate-rial. Several steps have already been made in this direction. For instance, unique molecular identifiers (UMI), attached to the source DNA fragments prior to bisulfite treatment was sug-gested as a solution for the problem of PCR duplicates. Furthermore, a PCR-free protocol was suggested that involves post-bisulfite adapter tagging (PBAT) [Miura et al., 2012]. The
future development will most probably concentrate upon single-cell methods discussed below (Section1.3).
1.2.4
DNA methylation microarrays
DNA methylation microarrays were developed from the earlier low-throughput methods based on restriction by endonucleases, immunoprecipitation and bisulfite treatment [Harrison and Parle-McDermott,2011]. The most well-known restriction-based microarrays included HpaII tiny fragment enrichment by ligation-mediated PCR (HELP) [Khulan et al., 2006] and
com-prehensive high-throughput arrays for relative methylation (CHARM) [Irizarryet al.,2008].
Immunological methods gave rise to methylated DNA immunoprecipitation (MeDIP) [Weber
et al.,2005]. Several related affinity-purification methods based on the use of methyl-binding
domain proteins (MBDs) were also suggested [Gebhardet al.,2006;Schilling and Rehli,2007].
Despite of several successful applications, the affinity-based microarrays were outperformed by the bisulfite-based ones due to the limited throughput, the lack of single-CpG resolution, low sensitivity and a strong CpG density-associated bias of the former [Down et al., 2008;
Bisulfite-based bead arrays from Illumina
Illumina’s DNA methylation bead arrays are an adaptation of the previously existing genomic platforms used for the high-throughput SNP genotyping. In essence, the assays tracking ge-nomic SNPs were redesigned to identify bisulfite-induced SNPs at CpG positions.
GoldenGate was the first platform of such kind [Bibikova et al., 2006]. Just as its
geno-typing counterpart it was based on measuring the amount of the product after an allele-specific PCR and enabled simultaneous quantitative profiling of methylation state at 1536 CpG sites mapping to 371 genes. GoldenGate was succeeded by a more progressive Infinium technology which became the basis for three DNA methylation microarrays, HumanMethy-lation27 [Bibikova et al., 2009], HumanMethylation450 [Bibikova et al., 2011] and
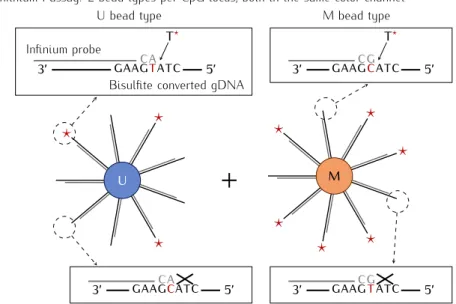
Methy-lationEPIC [Moran et al., 2015]. The Infinium technology is a highly parallelized
primer-extension assay, in which each primer-extension reaction is targeting a single genomic CpG (Fig-ure 1.6). The bisulfite converted genomic DNA is hybridized to 50-bp long oligonucleotides attached to nano-sized bead. The oligonucleotides, complementary to the fragments upstream or downstream of the target CpGs, serve as primers in the primer-extension reaction. Free nu-cleotides in the solution carry two different fluorescent labels (C and G are Cy3-labeled while A and T carry Cy5) allowing to register the incorporation. Currently two variants of the assay exist, denoted as type I and type II, which differ in the way the methylated and unmethylated state intensities are obtained.
HumanMethylation27 (Infinium 27k) platform contained only type I probes tagging 27,578 CpG sites across the human genome. HumanMethylation450, commonly known as Infinium 450k, was a significant move forward with 482,421 CpGs and 3,091 supposed non-CG methy-lation sites. The array genome-wise coverage reached 0.5% of the total CpG number. Approx-imately two third of the probes were of type II. The higher density of the array comprised a significant challenge for the oligonucleotide design and placement. Finally, MethylationEPIC platform succeeds 450k microarray bringing the total number of tagged CpGs to over 850,000 which is an astonishing 3% of the genomic total.
Application scope and approaching obsolescence
Combination of several qualities determined the success of the bead arrays. The cost and labor-optimized standard procedure favorably differed them from the genome-scale sequenc-ing approaches. The lack of ssequenc-ingle-molecule resolution was compensated by a much higher, molecular support for each intensity measurement. While a methylation call in genome-scale sequencing methods is often based on a dozen reads, each intensity measurement relies upon thousands of template molecules hybridizing to a bead, which guarantees a smaller measure-ment error. Furthermore, unlike many cost-optimized sequencing protocols (RRBS/CapSEQ), microarrays consistently return high-quality calls for the majority of covered CpGs in most of the samples. Owing to these benefits bead arrays have become the most popular profiling method of EWAS [Michelset al.,2013]. Only the Gene Expression Omnibus (GEO) database
currently contains data series for almost 1,000 studies using Infinium 27k, 450k and EPIC com-bined.
Nevertheless, the remaining shortcomings of the bead arrays, along with the constant im-provement of the competing approaches, set an applicability horizon for the microarray meth-ods. The highly optimized Infinium procedure has limited potential for further cost reduction, and the only possible upgrade is the increase of the genomic coverage. Due to the probe-based design this becomes progressively difficult. Furthermore, the bead array protocol does not offer an easy way to decrease the amount of the input material, conserving the cell type