Department of Medicine, Division of Emergency Care Department of Clinical Chemistry
Department of Anaesthesia and Intensive Care Medicine Helsinki University Central Hospital
University of Helsinki Helsinki, Finland
Determinants of outcome in critically ill patients
Katri Saukkonen
Academic dissertation
To be presented with the permission of the Faculty of Medicine of the University of Helsinki for public examination in Auditorium 3 of the Biomedicum, Haartmaninkatu 8, Helsinki,
on May 21st, 2010, at 1 p.m. Helsinki 2010
Supervisors
Professor Kari Pulkki
Department of Clinical Chemistry, Faculty of Health Sciences, School of Medicine University of Eastern Finland
Kuopio, Finland Docent Ville Pettilä
Department of Anaesthesia and Intensive Care Medicine Helsinki University Central Hospital
Helsinki, Finland Reviewers
Professor Onni Niemelä Department of Medicine Tampere University
Tampere, Finland Docent Jyrki Tenhunen
Department of Intensive Care Medicine and Critical Care Medicine Research Group Tampere University Hospital
Tampere, Finland Official opponent
Docent Minna Niskanen
Department of Operative Services and Intensive Care Kuopio University Hospital
Kuopio, Finland
ISBN 978-952-92-7186-3 (paperback) ISBN 978-952-92-7187-0 (PDF)
http://ethesis.helsinki.fi
Helsinki University Print Helsinki 2010
CONTENTS
LIST OF ORIGINAL PUBLICATIONS 6
LIST OF ABBREVIATIONS 7
ABSTRACT 8
1 INTRODUCTION 10
2 REVIEW OF THE LITERATURE 13
2.1 Outcome of critical illness 13
2.1.1 Mortality 13
2.1.2 Health-related quality of life 14
2.1.3 Scoring systems 16
2.1.4 Emergency department delay and procedures 20 2.2 Biological perspectives and markers of critical illness 24
2.2.1 Tissue injury and repair 24
2.2.2 Inflammatory response 25
2.2.3 Apoptosis 28
2.2.4 Stress response 32
2.2.5 Other prognostic markers 36
2.3 Genetic associations 39
2.3.1 Cytokines 40
2.3.2 Antigen recognition 49
2.3.3 Coagulation 53
2.3.4 Other proteins 54
3 AIMS OF THE STUDY 55
4 PATIENTS AND METHODS 56
4.1 Patients 56 4.2 Study designs 57 4.3 Laboratory measurements 59 4.4 Interventions 61 4.5 Data collection 61 4.6 Outcome measures 62 4.7 Statistical analyses 63
5
5 ETHICAL ASPECTS 65
6 RESULTS 66
6.1 Association of emergency department length of stay 66 with mortality and health-related quality of life (I)
6.2 Association of cell-free plasma DNA with mortality 68 and severity of disease in critically ill patients (II)
6.3 Predictive value of plasma DNA in patients with 69 severe sepsis or septic shock (III)
6.4 Frequencies of HO-1 polymorphisms (IV) 71
6.5 HO-1 plasma concentrations (IV) 72
6.6 Association of HO-1 polymorphisms with HO-1 plasma 73 concentrations and outcome (IV)
6.7 Association of HO-1 plasma concentrations with outcome (IV) 74
6.8 Mortality (I–IV) 76 7 DISCUSSION 77 8 CONCLUSIONS 86 9 ACKNOWLEDGMENTS 87 10 REFERENCES 89 ORIGINAL PUBLICATIONS APPENDICES
LIST OF ORIGINAL PUBLICATIONS
This thesis is based on the following original publications, referred to in the text by their Roman numerals (I–IV). These articles have been reprinted with the kind permission of their copyright holders.
I. Saukkonen K, Varpula M, Räsänen P, Roine RP, Voipio-Pulkki L-M, Pettilä V. The effect of emergency department delay on outcome in critically ill medical patients: evaluation using hospital mortality and quality of life at 6 months. Journal of Internal Medicine 2006; 260: 586–591.
II. Saukkonen K, Lakkisto P, Varpula M, Varpula T, Voipio-Pulkki L-M, Pettilä V, Pulkki K. Association of cell-free plasma DNA with hospital mortality and organ dysfunction in intensive care unit patients. Intensive Care Medicine 2007; 33: 1624–1627.
III. Saukkonen K, Lakkisto P, Pettilä V, Varpula M, Karlsson S, Ruokonen E, Pulkki K for the Finnsepsis Study Group. Cell-free plasma DNA as a predictor of outcome in severe sepsis and septic shock. Clinical Chemistry 2008; 54: 1000–1007.
IV. Saukkonen K*, Lakkisto P*, Kaunisto M, Varpula M, Voipio-Pulkki L-M, Varpula T, Pettilä V, Pulkki K. Heme oxygenase-1 polymorphisms and plasma concentrations in the critically ill patients. Shock, April 6, 2010. DOI: 10.1097/SHK.0b013e3181e14de9
7
LIST OF ABBREVIATIONS
APACHE Acute Physiology and Chronic Health Evaluation ARDS Acute respiratory distress syndrome
AUC Area under curve CO Carbon monoxide ED Emergency department
GE Genome equivalent
HMGB-1 High mobility group box-1 protein HO Heme oxygenase
HRQoL Health-related quality of life HSP Heat shock protein ICU Intensive care unit
IL Interleukin
IL-1ra Interleukin-1 receptor antagonist IQR Interquartile range
LD Linkage disequilibrium
LPS Lipopolysaccharide MBL Mannose-binding lectin MOD Multiple organ dysfunction NF-țB Nuclear factor kappa-B
NT-proBNP N-terminal pro-brain natriuretic peptide PAI-1 Plasminogen activator inhibitor-1 PCT Procalcitonin
QOL Quality of Life
ROC Receiver operating characteristic SAPS Simplified Acute Physiology Score SIRS Systemic inflammatory response syndrome SMR Standardized mortality ratio
SNP Single-nucleotide polymorphism SOFA Sequential Organ Failure Assessment
TLR Toll-like receptor
TNF-Į Tumor necrosis factor-alpha VNTR Variable number of tandem repeats
ABSTRACT
Background:
Assessment of the outcome of critical illness is complex. Severity scoring systems and organ dysfunction scores are traditional tools in mortality and morbidity prediction in intensive care, and they are also increasingly used in the clinical decision-making process, e.g. in qualifying patients for new treatments such as activated protein C in severe sepsis. Their ability to explain risk of death is impressive for large cohorts of patients, but for individual patients they lack sufficient clinical utility. Although events before intensive care unit (ICU) admission are prognostically important, the prediction models utilize data collected at and just after ICU admission. In addition, several biomarkers have been evaluated to predict mortality, e.g. in sepsis, but none has proven entirely useful in clinical practice. Therefore, new prognostic markers of critical illness are vital when evaluating the intensive care outcome.
Patients and methods:
In addition to two new biological markers of outcome, the impact of delay in emergency department (ED) on intensive care outcome, measured as hospital mortality and health-related quality of life (HRQoL) at 6 months, was assessed in 1537 consecutive patients admitted to medical ICU. The concentration of cell-free plasma DNA with organ dysfunction, disease severity, and mortality rate was then evaluated in 228 ICU patients. Next, the predictive value of plasma DNA regarding ICU and hospital mortality and its association with the degree of organ dysfunction and disease severity was evaluated in 255 patients with severe sepsis or septic shock. Finally, as potential regulators of apoptosis,
heme oxygenase-1 (HO-1) gene polymorphisms and HO-1 plasma concentrations and their association with outcome in critical illness were evaluated.
Main results:
The hospital mortality rate was significantly lower in patients admitted to the medical ICU from the ED than from the non-ED. The length of ED stay was not associated with outcome of intensive care, but the HRQoL in the critically ill at 6 months was significantly lower than in the age- and sex-matched general population.
9 the first 96 hours in intensive care correlated significantly with disease severity and degree
of organ failure. Maximum cell-free plasma DNA concentration was independently associated with hospital mortality.
In patients with severe sepsis or septic shock, the cell-free plasma DNA concentrations were significantly higher in ICU and hospital nonsurvivors than in survivors and showed a moderate discriminative power regarding ICU mortality. Plasma DNA was an independent predictor for ICU mortality, but not for hospital mortality.
Increased concentrations of HO-1 were found in plasma of critically ill ICU patients, and the concentration was associated with the degree of organ dysfunction. The HO-1 +99C and long GT allele (>33 repeats) were in perfect linkage disequilibrium in this Finnish critically ill patient population. The HO-1 -413T/GT(L)/+99C haplotype was associated with HO-1 plasma levels and frequency of multiple organ dysfunction.
Conclusions:
Time spent in the ED prior to ICU admission seems not to affect the outcome of critically ill patients significantly. Plasma DNA and HO-1 concentrations may support the assessment of outcome or organ failure development in critically ill patients, although their value is limited and requires further evaluation. Significantly increased HO-1 concentrations in critically ill patients were associated with the degree of organ dysfunction, suggesting that plasma HO-1 is associated with cell injury.
1 INTRODUCTION
Predicting the outcome of critically ill patients is a challenging task. Traditionally, scoring systems measuring the severity of illness, e.g. the Acute Physiology and Chronic Health Evaluation II (APACHE II) (Knaus et al. 1985), or organ dysfunction, e.g. the Sequential Organ Failure Assessment (SOFA) (Vincent et al. 1996, Vincent et al. 1998), are used to predict mortality or morbidity of intensive care patients. These scores are also increasingly used to assist the clinical decision-making process by, for instance, qualifying patients for new treatments such as activated protein C in severe sepsis. For large cohorts of patients, their ability to explain the mortality risk is impressive, and they form the basis for clinical research. However, at the level of the individual patient, they lack apparent clinical utility. The prediction models that are used at present utilize only data collected at or just after intensive care unit (ICU) admission, although the events before admission are evidently prognostically important (Rapoport et al. 1990) and early treatment improves survival in, for example, septic shock (Rivers et al. 2001). Evidence indicates that the longer ICU patients are in hospital before ICU admission, the higher their mortality (Goldhill et al. 2004). However, only a few studies have characterized the length of emergency department (ED) stay and ICU procedures performed in the ED (Varon et al. 1994, Svenson et al. 1997).
Several biomarkers have been evaluated for their ability to predict mortality in patients with sepsis and its sequelae severe sepsis and septic shock, but none has proven sensitive or specific enough for clinical practice. Severe sepsis and septic shock have remained challenges in intensive care, representing the major causes of death in ICU patients, with the hospital mortality rate varying from 30% to 60% in different studies (Angus et al. 2001, Alberti et al. 2002, Karlsson et al. 2007). Acute severe illness activates multiple cascading pathways. The biological response to injury, inflammation, infection, or shock is complex and usually involves activation of the innate immune system. Apoptosis has a major role in the pathophysiological process in sepsis (Hotchkiss et al. 2005). Cell-free plasma DNA is a potential marker of apoptosis and necrosis (Fournie et al. 1993, Fournie et al. 1995, Jahr et al. 2001, Jiang and Pisetsky 2005). Increased concentrations of cell-free plasma DNA have been found in various clinical conditions in which tissue injury occurs, including trauma, stroke, and myocardial infarction (Lo et al. 2000, Chang et al. 2003, Rainer et al. 2003). According to current evidence, the DNA is released into the circulation from apoptotic and necrotic cells
11 (Fournie et al. 1993, Fournie et al. 1995, Jahr et al. 2001, Jiang and Pisetsky 2005), although the exact mechanism remains unclear. Circulating DNA has been detected in the plasma of septic patients (Martins et al. 2000). Furthermore, elevated plasma levels of nucleosomes, in which fragmented DNA is packed during apoptosis, have been found in patients with severe sepsis and septic shock (Zeerleder et al. 2003). Preliminary data from ICU patients have suggested that plasma DNA concentrations at ICU admission may be higher in nonsurvivors than in survivors (Wijeratne et al. 2004, Rhodes et al. 2006).
Although the pathophysiology of critical illness is multifactorial, there may also be shared general gene response patterns to injury, and thus genetic studies in critical care settings have increased rapidly. Regardless of the insult, there are apparently common phenomena and hub mechanisms in critical illness that lead to further injury or repair. In addition to nuclear factor kappa B (NF-țB), the family of heat shock proteins (HSPs) and their regulator, the heat shock factors, are also extremely conserved in cellular stress response systems. HSPs have many important functions, such as the capacity to act as protein chaperones by protecting vital protein structures and functions and regulating apoptosis (Mosser et al. 2000). Heme oxygenase-1 (HO-1), a conserved enzyme that degrades heme to biliverdin, carbon monoxide (CO), and free iron, is induced by stimuli and phenomena related to critical illness, including oxidative stress, hypoxia, ischemia-reperfusion, and cytokines (Eyssen-Hernandez et al. 1996, Terry et al. 1998, Schmidt et al. 2007). HO-1 and its catabolic products have been found to have anti-inflammatory, antiapoptotic, and antioxidant properties (Stocker et al. 1987, Brouard et al. 2000, Sarady-Andrews et al. 2005), which could be beneficial in many disease states such as critical illness. Increased expression of HO-1 has been demonstrated in, for example, critically ill patients with acute respiratory distress syndrome (ARDS) (Mumby et al. 2004). Several polymorphisms have been detected in the promoter region of the HO-1
gene. One of the most studied genetic variants is the GTn dinucleotide polymorphism, which
has a length varying from 12 to 40 repeats and is apparently associated with the transcriptional activity of the gene (Yamada et al. 2000, Chen et al. 2002). Studies investigating HO-1 plasma concentrations and HO-1 gene polymorphisms in critically ill patients are scant. In addition, knowledge of the HO-1 genotype’s effect on plasma HO-1 concentrations is lacking.
We hypothesized that the surrogate markers of tissue injury/apoptosis would be helpful in evaluating outcome of critically ill patients. Hospital mortality and quality of life (QOL) at 6
months after intensive care and their association with ED delay were first evaluated in a large population of critically ill patients. The concentration of cell-free plasma DNA, a marker of apoptosis, was then measured in a group of critically ill mixed ICU patients, and its predictive value was separately evaluated in a more homogeneous group of patients in severe sepsis or septic shock in a large multicenter prospective study. Finally, as potential regulators of apoptosis, plasma HO-1 concentrations and HO-1 polymorphisms were analyzed in terms of association and predictive value in organ dysfunction and mortality.
13
2 REVIEW OF THE LITERATURE
2.1 Outcome of critical illness
The definition of critical illness is complex, comprising a variety of different clinical conditions. Critically ill, unstable patients are usually admitted to the intensive care unit (ICU), where intensive therapy, interventions, and monitoring can be provided (Task Force of the American College of Critical Care Medicine, Society of Critical Care Medicine 1999). A critically ill patient usually has one or more failing organ systems that need to be supported by the resources available in the ICU such as mechanical ventilation and renal replacement therapy. Causes behind failing organ functions are multiple. The majority of critically ill ICU patients’ deaths are caused by sepsis and its sequelae; the systemic inflammatory response syndrome (SIRS), severe sepsis, septic shock, and multiple organ failure. Despite the development of pharmacological agents against the excessive inflammatory process in sepsis and sophisticated forms of organ support, the sepsis mortality rates remain high, 30-60% in different studies (Angus et al. 2001, Alberti et al. 2002, Karlsson et al. 2007). With cost-constraints and a limited number of ICU beds, the challenge is to determine which patients would be most likely to benefit from the intensive care (Bone et al. 1993).
2.1.1 Mortality
Short-term mortality, such as ICU, hospital, and 28-day mortality, as well as long-term mortality at 6 or 12 months have been considered objective and appropriate endpoint measures (Suter et al. 1994). During a 4-year period from 1998 to 2001, the overall hospital mortality rate was 16.8% in Finnish ICUs (Reinikainen et al. 2006). The hospital mortality was higher in winter than in other seasons even after adjustment of case mix (17.9% vs. 16.4%, p=.003) (Reinikainen et al. 2006). Age, gender, and severity of disease have been shown to have an effect on mortality of Finnish ICU patients (Niskanen et al. 1996, Reinikainen et al. 2005, Reinikainen et al. 2007).
A large Australian study demonstrated that the risk of death among hospital survivors after an intensive care episode is highest in the first 12 months, thereafter stabilizing but still being greater than in the general population for at least the next 14 years (Williams et al. 2008). An
episode of critical illness in itself shortens life expectancy, age, comorbidity, primary diagnosis, severity of physiologic derangement, and organ failure being the strongest determinants of long-term survival (Williams et al. 2008). In Finnish ICU patients, the 5-year mortality rate was 3.3 times higher than in the age- and gender-adjusted general population (Niskanen et al. 1996). However, depending on the diagnostic category, ICU patients’ survival paralleled that of the general population at an average of 2 years (Niskanen et al. 1996).
2.1.2 Health-related quality of life
In addition to mortality, health-related quality of life (HRQoL) after intensive care is currently recommended as an outcome measure of critical care with a follow-up of at least 6 months (Angus and Carlet 2003). Many validated quality of life (QOL) measures are used in intensive care. In 1994, the European Society of Intensive Care Medicine listed the desired properties for instruments measuring QOL: reliability, criterion and content validity, responsiveness, discrimination, relative simplicity, and easy of administration (Suter et al. 1994). The 2002 Brussels Round Table ‘Surviving Intensive Care’ recommended the EuroQol-5 Instrument (Brooks 1996) and the Medical Outcome Study Short Form 36 (Ware and Sherbourne 1992) for HRQoL evaluation (Angus and Carlet 2003).
The 15D is a generic, standardized, self-administered measure of HRQoL (Sintonen 2001). The 15D questionnaire includes 15 dimensions: breathing, mental functions, speech (communication), vision, mobility, usual activities, vitality, hearing, eating, elimination, sleeping, distress, discomfort and symptoms, sexual activity, and depression (Appendix 1). Each dimension is divided into 5 levels (1 = best, 5 = worst), and preference weights are used to generate the 15D score over all dimensions. The maximum score is 1 (no problems on any dimension) and the minimum score is 0 (being dead). The 15D score has been found to correlate and perform equal well to the Medical Outcome Study Short Form 36 and the EuroQol-5 Instrument (Hawthorne et al. 2001), which are widely used in critical care.
HRQoL outcomes
The ideal outcome for ICU survivors is to attain their previous HRQoL or an HRQoL similar to a person of the same age, gender, and medical condition. Compared to general population, the HRQoL has been found to be lower at baseline before intensive care and from 6 months to
15 14 years after ICU discharge in ICU survivors according to several studies (see the review by Dowdy et al. 2005, Karlsson et al. 2009). ICU-related factors that predict post-ICU QOL are not yet fully understood. Age, length of stay in ICU, educational background, diagnosis, and presence of multiple organ dysfunction syndrome have been shown to have a significant impact on measures of QOL (Pettilä et al. 2000, Badia et al. 2001, Wehler et al. 2003, Kaarlola et al. 2004).
Physical and social functioning and general health have been shown to remain significantly lower 6 months after ICU treatment than pre-ICU admission values (Hofhuis et al. 2008). In medical ICU patients suffering predominantly from cardiovascular and pulmonary disorders, physical health was better at 9 months after intensive care than at baseline prior to intensive care, although the pre-ICU HRQoL was lower than in the age-matched general population (Graf et al. 2003). Trauma patients had the most significant reduction in QOL after 1 year relative to the situation before intensive care, but in medical and unscheduled surgery patient populations the reduction was milder, whereas the HRQoL of patient undergoing scheduled surgery improved (Badia et al. 2001). Emotional aspects seem to be restored slowly. Compared with the HRQoL 1 year after intensive care, improvement was seen in psychological domains, but deterioration in physical functioning, pain, and general health 6 years after ICU discharge (Kaarlola et al. 2003). Linearly, despite recovering to pre-morbid levels after 1 year, physical QOL deterioriates again from 2.5 to 5 years after intensive care (Cuthbertson et al. 2010). Evidence suggests that the HRQoL of critically ill patients in general is lower than in the age-matched general population already before ICU admission (Wehler et al. 2003, Hofhuis et al. 2008, Karlsson et al. 2009). Moreover, poor QOL prior intensive care may even be related to hospital and 1-year mortality (Iribarren-Diarasarri et al. 2009). The results of patients treated in the ICU attaining their previous QOL are contradictory and may also depend on whether patients have chronic diseases. Survivors with unimpaired pre-admission HRQoL suffering from acute pathologies demonstrate deterioration in the physical health domain of QOL, whereas survivors with impaired pre-admission HRQoL or pre-existing disease have unchanged or even improved QOL (Wehler et al. 2003).In conclusion, if an ICU survivor has health problems or chronic diseases prior to ICU admission, HRQoL may be more easily attained. Patients with previous HRQoL similar to the general population may suffer from acute, unexpected illness, such as trauma, with more long-standing effects on future health and HRQoL.
2.1.3 Scoring systems
When assessing the performance of a prediction tool, such as a disease severity scoring system, some important issues must be considered (Randolph et al. 1998). First, as a measure of validity, the patient group must be representative and adequately followed up. All of the important prognostic factors should be included or the accuracy of the model will suffer. The effect of each variable should be tested individually and also together to determine how these factors interact with each other. The outcomes should be clear and objectively defined to avoid bias. To confirm the results of a prediction tool, validation in another, independent patient population is necessary.
Performance of the scoring system is evaluated by its accuracy, consisting of calibration and discrimination (see the review by Ruttiman 1994). Calibration, statistically measured by goodness-of-fit test, evaluates the degree of correspondence between estimated probabilities of mortality produced by a model and the actual mortality of the patients (Ruttiman 1994). Discrimination tests the ability of a method to classify patients to two outcome groups based on the estimates of the probability of hospital death (Ruttiman 1994). Discrimination can be expressed as sensitivity (true-positive fraction) and specificity (true-false fraction), and it can be graphically presented as a receiver operating characteristic (ROC) curve, which describes the ability of the method to distinguish between patients who live and those who die. The area under the curve (AUC) expresses the model’s ability to discriminate correctly between survivors and nonsurvivors (Hanley and McNeil 1982). The area may range from 0.5 (the method is not better than chance) to 1.0 (the method is perfect). Unfortunately, the present scoring systems do not achieve sufficient predictive accuracy to make treatment decisions (Beck et al. 2003). The confidence interval describes the precision of a measure and its width depends on the sample size, variability of a characteristic, and the level of desired confidence, normally 95% (Randolph et al. 1998).
Several disease severity scoring systems have been developed to estimate mortality risk in critically ill patients. They are used to improve resource utilization, to classify and compare patient populations, in clinical trial enrollment, and to assist in the clinical decision-making process (Suter et al. 1994, Vincent et al. 2000). Their ability to explain mortality risk is impressive for different patient populations and they form the basis for outcome research in intensive care, but at the level of individual patients they lack outcome prediction power
17 (Lemeshow et al. 1995). Most of the scoring systems are physiology-based, but they take into account only the acute insult as a whole, not the underlying pre-existing physiological reserve. Due to inaccuracy in patient assessment and natural variation in patients’ response to stress and therapeutic interventions, outcome prediction is always associated with uncertainty (Ruttiman 1994). Uncertainty of prediction models can be reduced by using high cut-off levels to avoid false-positive predictions. However, a score represents only one simplified piece of information, and even with a 90% risk of death one of ten patients on average will survive. The scores have been developed in large, multicenter ICU patient populations and have been validated in independent data sets (Le Gall et al. 1993). The scoring systems are based on the quantification of case mix and the development of mathematical equations to estimate probabilities of outcome for intensive care patients. Outcome is usually measured as hospital mortality. Scoring systems describe the association between independent variables and the dependent variable (hospital mortality) in the form of a mathematical equation known as a multiple logistic regression equation (Ruttiman 1994). The equation for each scoring system can be then applied to a diagnostic group (e.g. in Acute Physiology and Chronic Health Evaluation II, APACHE II) or to a group of intensive care patients to estimate the expected hospital death rate (e.g. in Simplfied Acute Physiology Score II, SAPS II). Diagnosis classification can be difficult in many critically ill patients due to their multiple medical problems. The selection of a less significant diagnosis may lead to an inaccurate calculation of risk of death.
Disease severity scoring systems
The APACHE system was developed in the United States between 1979 and 1982 based on 5818 ICU admissions in 13 large tertiary care centers. Derived from the original APACHE, the APACHE II scoring system, introduced in 1985, reduced the number of physiological variables included (Knaus et al. 1985). The APACHE II score ranges from 0 to 71 and consists of 3 components: 1) acute physiology score comprising 12 physiological variables, the most deranged value in the first 24 hours in the ICU included, 2) age, and 3) history of severe chronic health conditions. Hospital mortality prediction is calculated for different diagnostic categories from the APACHE II score plus coefficients for post-emergency surgery. The APACHE II model was refined and re-evaluated in 1991 (APACHE III) (Knaus et al. 1991).
North American and European patients randomly divided into developmental and validation samples, provides an estimate of hospital mortality risk for each score value (Le Gall et al. 1993). It includes 12 physiological variables, type of admission, and three variables related to underlying disease. It has good discriminative power (AUC 0.86-0.88), but the calibration is inadequate. SAPS II also lacks sufficient prediction power when applied to different countries (Harrison et al. 2006). The advantages of SAPS II are, however, its simplicity and availability.
The APACHE II and SAPS II variables are presented in Table 1. Table 1. Comparison of APACHE II and SAPS II variables.
APACHE II variables SAPS II variables
Heart rate (min) Heart rate (min)
Mean arterial pressure (mmHg) Systolic arterial pressure (mmHg)
Temperature (°C) Temperature (°C)
Respiratory rate (min) Oxygenation:
a. FiO2 0.5: record A-aDO2
b. FiO2 < 0.5: record only PaO2 (mmHg)
Only if mechanically ventilated or with continuous positive airway pressure:
PaO2 (mmHg or kPA)/FiO2 Arterial pH
(serum HCO3 if no arterial blood gases)
Serum HCO3 Hematocrit (%)
White blood cell count (E9/l) White blood cell count (E9/l) Creatinine (mg/100ml)
-double points for acute renal failure
Urine output (l/24h)
Serum urea (mmol/l) or serum urea nitrogen (mg/dl) Serum bilirubin (µmol/l)
Serum sodium (mmol/L) Serum sodium (mmol/L) Serum potassium (mmol/L) Serum potassium (mmol/L)
Glasgow Coma Scale Glasgow Coma Scale
Age (years) Age (years)
Chronic Health Points: Liver insufficiency (cirrhosis, portal hypertension, hepatic failure), Cardiovascular (NYHA IV) , Respiratory (e.g. Chronic obstructive pulmonary disease), Renal (chronic dialysis), Immunosuppression (e.g. chemotherapy, steroid treatment, leukemia, acquired immune deficiency syndrome)
Chronic diseases: Metastatic cancer, Hematologic malignancy, Acquired immune deficiency syndrome
Type of admission:
Medical, scheduled, or unscheduled surgery
The APACHE system is the most widely used globally, but SAPS II has performed better in Europe (Moreno and Morais 1997). A multicenter study of 16 646 ICU patients in south England found a good discriminative power for APACHE II, APACHE III, and SAPS II
19 (AUC 0.835-0.867), but imperfect calibration for all three models (Beck et al. 2003). In an Italian single-center study, the SAPS II score overestimated and the APACHE II underestimated the mortality rate for high-risk ICU patients (Capuzzo et al. 2000). The lack of fit of the SAPS II and the APACHE II scores can be partly explained by differences in case mix between the patient population from which the model was derived and to which the model was applied (Harrison et al. 2006). Therefore, updated models have been developed. The SAPS 3, developed in 2002, takes into account a higher number of variables than SAPS II and also different geographical areas as well as organizational, structural, and resource use characteristics of the ICU, defined as “ICU variables” (Metnitz et al. 2005, Moreno et al. 2005). In addition, the physiological data are collected from one hour before to one hour after ICU admission.
Organ failure scoring
Multiple organ dysfunction (MOD) is a major cause of mortality in critically ill ICU patients (Mayr et al. 2006). The number and magnitude of failing organ systems correlate with the mortality rate (Vincent et al. 1998, Moreno et al. 1999). Four organ dysfunction scores have been introduced: Sequential Organ Failure Assessment (SOFA), Multiple Organ Dysfunction, Logistic Organ Dysfunction, and Brussels scores. The European Society of Intensive Care Medicine organized a consensus meeting in 1994 to create the sepsis-related organ failure assessment score to describe and measure the degree of organ dysfunction over time for individuals and groups of patients, not to predict outcome (Vincent et al. 1996). The score was later renamed Sequential Organ Failure Assessment because it is not restricted to sepsis. The investigators highlighted that organ dysfunction should be considered a continuum rather than an event and a dynamic process that can vary with time. The evaluation should be based on a limited number of simple but objective routinely measured variables (Vincent et al. 1998). The SOFA score consists of six organ systems (respiration, coagulation, liver, cardiovascular, central nervous system, and renal), each yielding a score from 0 (normal) to 4 (most abnormal) (Table 2). Organ failure is defined by a SOFA score of 3 for any organ (Vincent et al. 1998). The use of SOFA score in assessing the incidence and severity of organ dysfunction was evaluated in a prospective multicenter study of 1449 critically ill ICU patients, and high SOFA scores were associated with increased mortality (Vincent et al. 1998). The maximum and delta SOFA score (total maximum SOFA score minus admission total SOFA) can also be used to quantify present and developing organ dysfunction in ICU patients (Moreno et al. 1999). Although not developed for predicting mortality, the SOFA
score –including fewer physiological parameters– seems to perform almost equally well as the APACHE II/III scores and SAPS II (see the review by Minne et al. 2008). Combining the SOFA score with an admission-based severity score results in superior prognostic performance compared to a single model (Minne et al. 2008).
Table 2. The SOFA score.
Organ dysfunction 0 points 1 points 2 points 3 points 4 points 1. Respiratory Pa02/FiO2 (mmHg) *with mechanical ventilation 400 <400 <300 <200* <100* 2. Coagulation Platelet count x 109/l 150 <150 <100 <50 <20 3. Liver Bilirubin (µmol/l) <20 20-32 33-101 102-204 >204 4. Cardiovascular *µg/kg/min MAP>70 mmHg MAP <70 mmHg DA 5* or dobutamine DA >5* or epi 0.1* or NA 0.1* DA > 15* or epi > 0.1* or NA > 0.1* 5. Neurologic
Glasgow Coma Scale 15 13-14 10-12 6-9 <6
6. Renal Creatinine (µmol/l) *Urine output <110 110-170 171-299 300-440 *<500ml/day >440 *<200ml/day DA, dopamine; epi, epinephrine; MAP, mean arterial pressure; NA, norepinephrine
2.1.4 Emergency department delay and procedures
The severity scoring systems utilize data collected within the first 24 hours in the ICU, although events before admission are prognostically important (Rapoport et al. 1990). In patients with septic shock, for instance, early rapid goal-directed fluid resuscitation has been shown to decrease hospital mortality (Rivers et al. 2001). Early recognition of critical illness is crucial, and early physiological warning signs have been investigated to detect deteriorating patients (Goldhill et al. 1999).
Critically ill patients remain in the emergency department (ED) for significant periods of time. Delayed admission to ICU has been associated with higher mortality among critically ill
21 patients. In a large multicenter study in which ED delay was divided into nondelayed and delayed categories based on the time (<6 hours and >6 hours) the patient waited for transfer to ICU after the decision of ICU admission was made, delayed ICU admission proved to be an independent risk factor for hospital mortality and was associated with longer ICU stay and mortality (Chalfin et al. 2007).
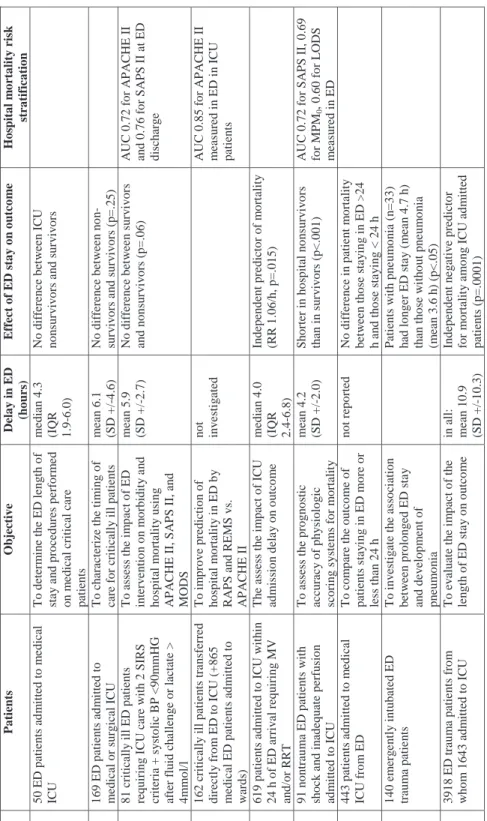
However, contradictory and inadequate data exist on how the ED length of stay itself and procedures performed in the ED contribute to outcome of critically ill patients subsequently admitted to ICU. Only a few studies have characterized ED length of stay and the procedures performed in the ED on critically ill patients. The averige length of ED stay of critically ill patients has varied from 2.4 to 6.1 hours in different studies (Fromm et al. 1993, Varon et al. 1994, Svenson et al. 1997, Nelson et al. 1998, Nguyen et al. 2000, Parkhe et al. 2002, Jones et al. 2005, Carr et al. 2007). A few studies have found that length of ED stay has not differed between survivors and nonsurvivors (Varon et al. 1994, Svenson et al. 1997, Nguyen et al. 2000). One study showed that mortality rates, ICU length of stay, or APACHE II scores were not higher in patients staying in the ED longer than 24 hours (Tilluckdarry et al. 2005). By contrast, a study investigating the prognostic accuracy of three disease severity scoring systems in a critically ill ED patient cohort found that in-hospital nonsurvivors had significantly shorter ED stay than the in-hospital survivors (mean 2.6 vs. 4.2 hours, p<.0001) (Jones et al. 2005), and this outcome was repeated by Richardson et al. (2009) in patients with trauma. Duke and coworkers (2004) found that length of ED stay was an independent risk factor for hospital mortality (relative risk 1.06, p=.015), but they included only patients requiring mechanical ventilation and/or renal replacement therapy at ICU admission. Studies evaluating the impact of ED care on outcome in critically ill patients are summarized in Table 3.
Table 3. Studie s e v al ua ting the impac t of e m erg en c y d epa rtme nt ca re on ou tc ome in c ritic al ly ill pa tie n ts. Study Patients Objective Delay in E D (h ou rs ) E ffect of E D s tay on ou tco m e Hos p ital m o rtal ity ri sk strati fi cati on Varon et al. 1994 5 0 ED p atien ts ad m itted to m e d ical IC U T o d eter m in e th e ED le n g th o f st a y a n d procedu res perf orm e d on m
edical critical care
p atien ts m edi an 4.3 (IQR 1.9-6.0) No dif fe ren ce bet w ee n IC U no ns ur vi vo rs a n d sur v iv o rs Sve n so n et al . 199 7 169 ED pat ie n ts ad m it te d t o m edical or s u rgical IC U T o ch aracterize th e ti m ing of care f o r criticall y ill patients m ean 6.1 (S D +/ -4 .6) N o d iffe re nc e b et w ee n no n-sur v ivo rs a n d sur v iv o rs ( p = .25 ) N guy e n et al . 200 0 8 1 cr itically il l ED p atien ts requ irin g I C U care w ith 2 SIR S cr iter ia + s y sto lic B P <9 0 m m HG af ter f lu id ch a lleng e or lactate > 4 m m o l/l T o a sse ss t h e i m p ac t o f E D in ter v e n tio n o n m o rb id it y a n d ho sp it al m o rt al it y usi n g A P A C HE II, S A P S II, an d MODS m ean 5.9 (S D +/ -2 .7) N o di ff eren ce bet w ee n su rv ivors an d n ons u rv iv o rs (p=.06) A U C 0.72 f o r A P A C H E II an d 0.76 f o r S A PS II at ED di sc h arg e Olsso n a n d L in d 2003 162 critically ill patie n ts tra n sf erred di rect ly f ro m ED t o IC U (+865 m edical ED patien ts ad m it ted to wa rd s) T o i m prov e predi ct ion of h o sp it al m o rt al ity in E D b y RA P S an d R EMS v s. AP AC H E I I no t in v e st ig ated A U C 0.85 f o r A P A C H E II m eas u red in ED i n IC U p atien ts Duk e et al. 2004 619 patien ts adm itted to IC U w it h in 24 h of ED arri v al requ iri n g MV an d/ or R R T T h e as se ss t h e i m pact o f IC U ad m is sio n d ela y o n o u tco m e m edi an 4.0 (IQR 2.4-6.8) In depen d en t predi ct o r of m o rt al it y (R R 1.06/ h , p=.015 ) Jo n es et al. 2005 91 n o n traum a ED pat ie n ts w it h sho ck a nd i na d eq ua te p er fus io n ad m itted to I C U T o a sse ss t h e p ro gno stic accu rac y of phy si olog ic sc o ring s y ste m s fo r m o rt alit y m ean 4.2 (S D +/ -2 .0) Sho rt er i n ho sp it al no ns ur vi vo rs th an i n su rv iv ors (p<.001) A U C 0.72 f o r S A PS II, 0.69 fo r M P M 0 , 0. 60 f o r L O D S m eas u red in ED T illu ck d ar ry et al . 200 5 443 patien ts adm itted to m edi cal IC U f ro m ED T o com p are th e ou tco m e of p at ie nt s s ta y in g i n E D mo re o r le ss t h an 2 4 h n o t r ep o rted No d if fe re n ce i n p atie n t m o rt a lit y bet w ee n t h os e st a y in g i n ED > 24 h a n d t h o se st a y in g < 2 4 h C arr et al. 2007 140 em erg e n tl y i n tu bat ed ED tr au m a p atie n ts T o in v es tig ate t h e as so ciation bet w ee n prol on g ed ED s ta y an d dev el o p m ent of pn eum o n ia P at ie nt s w it h p n e u m o ni a ( n = 3 3 ) ha d l o nge r E D st a y ( m ea n 4 .7 h) th an t h o se w ith o u t p n e u m o n ia (m ean 3.6 h ) (p<.05) R ich ards o n et al . 200 9 3918 ED t raum a pat ie n ts f ro m w h o m 1643 adm it ted t o IC U T o ev alu ate t h e i m pact o f th e len g th o f ED sta y o n o u tco m e in all: m ean 10.9 (S D +/ -10.3) Ind ep end ent ne ga ti ve p re d ic to r fo r m o rt al it y a m o n g ICU ad m it te d pat ie n ts (p=.0001) A P A C HE, A c u te P h y siology an d C h ro n ic Healt h Ev al u atio n ; A U C , ar ea u n d er cu rv e; BP , bl ood pres su re; ED , e m erg e nc y depart m en t; IC U, intens iv e care u n it; IQ R , in te rq ua rt il e r a nge ; LO D S , Lo gi st ic O rga n D y sf u n ct io n Sc o re ; M O D S , M u lt ip le O rga n D y sf u n ct io n Sc o re ; M P M 0 , Mo rb id it y P ro b ab ility Mo d el at ad m is sio n ; M V, m ech a n ical v e n tilatio n ; R A P S , Rap id A cu te P h y sio lo g y Sco
re; REMS, Rap
id E m er g e n c y Med icin e Sco re; RR, r is k r atio ; RRT , r en al r eplacem e n t t h er apy ; S A P S , Si m p li fi ed A c u te Phy si o logy S core; S D , st an dard dev iat io n ; S IR S , sy st e m ic i n fl a m m at o ry res pons e sy n d ro m e
23
The results of length of ED stay may vary because of different patient inclusion criteria: some studies have included only ED patients admitted subsequently to the ICU and some have included ED patients requiring critical care in ED. The definition of critical care provided in ED may have solely comprised telemetry (Nelson et al. 1998). In addition, only a few studies have been designed to assess the effect of length of ED stay on patient outcome.
In ED, the proportion of critically ill patients receiving central venous catheter has varied from 4% to 89%, and that of mechanically ventilated patients from 10% to 31% (Varon et al. 1994, Svenson et al. 1997, Nelson et al. 1998, Nguyen et al. 2000). Nguyen et al. (2000) reported that 89% received intra-arterial blood pressure monitoring and 69% vasoactive or inotropic medication. Their study, however, included patients who were hypotensive or lactatemic and who presented with at least two SIRS criteria.
Patients admitted to the ICU within 24 hours after hospital admission have been found to have lower predicted and actual mortality rates and to consume less resources (Rapoport et al. 1990). The longer ICU patients are in hospital before ICU admission, the higher their mortality (Goldhill et al. 2004). Patients admitted to the ICU from hospital wards tend to be older and to more often have coexisting disease than patients admitted to the ICU directly from ED (Parkhe et al. 2002, Simpson et al. 2005). Alterations in the patient’s condition and abnormal physiological values are found in ward patients before ICU admission (Goldhill et al. 1999). Heart rate, respiratory rate, and oxygen supplementation are the most important physiological determinants in ward patients requiring ICU treatment within 24 hours (Goldhill et al. 1999). The observed hospital mortality rate is significantly higher than that predicted by the SAPS II and APACHE II models in those critically ill patients admitted to ICU from the ward (Capuzzo et al. 2000).
No scoring system has been validated for hospital mortality risk stratification in ED patients, but some studies have investigated the performance of severity scoring systems regarding mortality prediction in ED patients (Table 3). Their results have been variable, perhaps because the scoring systems used in intensive care are not validated for use in ED or for repeated measurements. In addition, patient characteristics and study inclusion criteria have differed.
2.2 Biological perspectives and markers of critical illness
2.2.1 Tissue injury and repair
Acute severe illness activates multiple cascading pathways. Regardless of the insult, the biological response to injury, inflammation, infection, or shock is complex and usually involves activation of the innate immune system and common molecular patterns leading to burst of dozens of mediators. The response can generalize to SIRS and MOD if it escapes local control. Host response of septic patients is characterized by coagulopathy, inflammation, and endothelial injury, identified by increased concentrations of the following biomarkers indicating these phenomena: d-dimer, interleukin-6 (IL-6), soluble thrombomodulin, and prolonged prothrombin time. These responses are more impaired in patients with severe sepsis who die (Kinasewitz et al. 2004). Activation of strong pro-inflammatory response, such as in sepsis, is followed by increased anti-inflammatory cytokine levels and immune paralysis, tissue hypoxia, activation of coagulation, and dysregulated apoptosis (Gogos et al. 2000, Hotchkiss et al. 2005, García-Segarra et al. 2007). Pathophysiological pathways activated in critical illness are charcterized in Figure 1.
Infection Inflammation Trauma LPS MBL, TLR, CD14 Adhesion molecules Proinflammatory cytokines TNF-Į IL-1 IL-6 … Anti-inflammatory cytokines IL-10 IL-1ra sTNFR … Tissue injury HO-1 cell-free plasma DNA Organ dysfunction Cytoprotection NF-țB + + + + +
25 Injury can be defined as interruption of molecular, cellular, or organ function resulting from such stimuli as hypoxia, ischemia, trauma, toxins, infection, or inflammation. Repair response that restores structure and function follows, including coagulation, leukocyte activation, apoptosis, proliferation, regeneration, remodeling, and revascularization.
The magnitude of the body’s systemic inflammatory response, rather than the presence or absence of infection, is postulated to enhance the development of organ failure and be a more important determinant of patient survival. To avoid an excessive response, early recognition and management are essential. Increasing knowledge of these complex parallel pathophysiological cascades has enabled searches for novel biological markers to provide new information on the mechanisms of disease in critical illness and to serve as candidate prognostic markers in outcome prediction. Many studies have aimed at uncovering new biological markers of critical illness in order to identify those patients at highest risk and to predict outcome. Despite efforts, no reliable biological markers of illness severity or outcome have yet been discovered. The mechanisms underlying critical illness are very complex and heterogeneous, so finding a single predictive marker may remain elusive.
2.2.2 Inflammatory response
Nuclear factor kappa-B
The cell surface receptors toll-like receptors (TLRs) and CD14 are crucial for bacterial recognition and induction of innate immune responses to infection, leading to activation of nuclear factor kappa-B (NF-țB) and transcription of inflammatory genes (Medzhitov et al. 1997).
NF-țB is a transcription factor regulating gene expression involved in immune and inflammatory responses. The mammalian NF-țB family consists of five subunits: p50, p52, p65, reL, and reLB, which can homodimerize and heterodimerize in various combinations. These different combinations have varying activating abilities (Adib-Conquy et al. 2000). Inhibited NF-țB exists normally in cellular cytoplasm and is activated by various stimuli, such as pro-inflammatory cytokines, leading to its phosphorylation by protein kinases and entry into the nucleus. NF-țB activation increases transcription of chemokines, pro-inflammatory cytokines, adhesion molecules, and antiapoptotic proteins (Chen et al. 2003).
NF-țB activity was increased in mononuclear cells of septic and critically ill patients with SIRS who died in hospital compared with hospital survivors (Arnalich et al. 2000, Paterson et al. 2000). Despite septic nonsurvivors expressing more NF-țB than survivors, the mononuclear cells of septic patients, particularly of nonsurvivors, seemed to have a decreased response to stimuli such as lipopolysaccharide (LPS) (Adib-Conquy et al. 2000). This phenomenon, referred to as endotoxin tolerance, appears to be mediated by the NF-țB subunit p50 (Adib-Conquy et al. 2000). In a mouse model of gut ischemia-reperfusion injury, NF-țB activation led to acute systemic inflammatory response and lung inflammation via tumor necrosis factor-alpha (TNF-Į), but provided protection against enterocyte apoptotic injury (Chen et al. 2003). Strong systemic inflammation response can thus be considered one of the leading mechanisms for MOD, and NF-țB may serve as a potential therapeutic target for reducing overwhelming pro-inflammatory response and organ damage in critical illness. However, complete blocking may also be detrimental considering the major role of NF-țB in host defense.
Cytokines
Pro-inflammatory cytokines are upregulated in the early stages of inflammation. TNF-Į and IL-1 are secreted rapidly in minutes, whereas IL-6, IL-8, and high mobility group box-1 protein (HMGB-1) contribute later (Sundén-Cullberg et al. 2005) with anti-inflammatory cytokines such as IL-1 receptor antagonist (IL-1ra) and IL-10.
Increased cytokine concentrations can be measured in the early phase of critical illness, and levels can stay high in circulation over several days (Kinasewitz et al. 2004, Kellum et al. 2007, Rivers et al. 2007). However, the ability of monocytes to produce inflammatory cytokines seems to be downregulated in severe sepsis and septic shock (Brunialti et al. 2006). Septic patients with the most severe global tissue hypoxia had higher levels of inflammatory cytokines IL-1ra, TNF-Į, IL-8, and caspase-3, a marker of apoptosis, at 12-36 hours from hospitalization (Rivers et al. 2007), but the monocyte production of TNF-Į, IL-6, and IL-10 under LPS stimulation in patients with severe sepsis or septic shock was impaired compared with healthy controls or patients with simple sepsis diagnosis only (Brunialti et al. 2006). The severity of disease and stage of infection affects the cytokine profile as well (Oberholzer et al. 2005, Kellum et al. 2007). Interestingly, early temporal decrease in inflammatory cytokine levels can be seen by optimizing hemodynamics (Rivers et al. 2007), highlighting the benefit of early treatment.
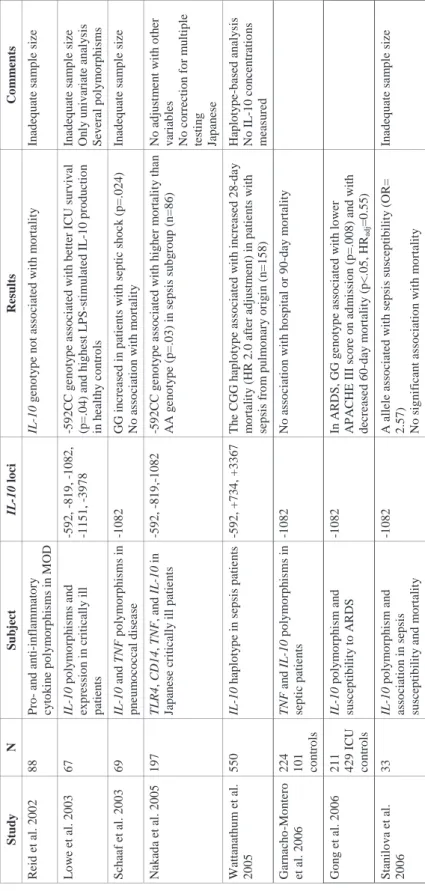
27 Several recent studies have analyzed multiple cytokines simultaneously, showing significant, but inconsistent, correlations between cytokine concentrations, such as IL-6, IL-8, and monocyte chemoattractant protein-1, and mortality in patients with severe sepsis (Oberholzer et al. 2005, Bozza et al. 2007). However, clinical applicability is lacking. In 39 patients with sepsis or severe sepsis, IL-10 had the best discriminative power for mortality, with an AUC of 0.90, although there were only five nonsurvivors (Heper et al. 2006). By measuring 17 cytokines simultaneously in 60 patients with severe sepsis, only monocyte chemoattractant protein-1 was an independent predictor for 28-day mortality, with an odds ratio of 1.4, but the AUC was only moderate (0.715) (Bozza et al. 2007). By contrast, baseline IL-6 concentration was an independent predictor for 28-day mortality (p=.019) in a study population of 124 patients with severe sepsis (Oberholzer et al. 2005).
The high mobility group box-1 protein, originally identified as a nuclear DNA-binding protein, can also be secreted into extracellular milieu by endotoxin-stimulated macrophages or under cellular stress, particurlarly in necrosis, acting as a “late” pro-inflammatory cytokine (Scaffidi et al. 2002). Its biological activities and role in critical illness is not fully understood. In patients with sepsis, severe sepsis, or septic shock, the association of HMGB-1 levels and 28-day survival was dependent on the laboratory methods, even though the levels remained very high for several days (Sundén-Cullberg et al. 2005). In patients with pneumonia, HMGB-1 concentrations were significantly higher in those who developed severe sepsis and died than in survivors in multivariate analysis (Angus et al. 2007). However, in a larger study of 247 patients with severe sepsis or septic shock, HMBG-1 had no predictive power for survival when measured at baseline or 72 hours later (Karlsson et al. 2008).
Discrepancy exists about whether highly upregulated anti-inflammatory cytokine activation is more disadvantageous than strong pro-inflammatory response. Recent studies have searched for an optimal cytokine profile. The highest risk of death among patients with community-acquired pneumonia and sepsis was in the combination of high levels of the pro-inflammatory IL-6 and the anti-inflammatory IL-10 (hazard ratio 20.5, p<.001) (Kellum et al. 2007), whereas in another study with 65 patients with severe sepsis the sustained anti-inflammatory profile, defined as persisting high IL-10 levels, was associated with adverse outcome (Gogos et al. 2000). IL-10 has also been found to be an independent predictor of hospital mortality in sepsis, although the AUC for fatal outcome was only moderate (0.71) (Hynninen et al. 2003). The inflammatory response itself as well as its regulation and time course may be too
complex for predicting the outcome of critically ill patients by cytokine measurements. Inadequate sample sizes and study designs are shortcomings and limitations in studies investigating the predictive value of inflammatory markers in critically ill patients. Although a marker may have an independent effect on mortality, the discriminative power may be deficient or a complete ROC analysis lacking. In addition, the magnitude of inflammatory response may be a matter of timing and the dynamic continuum at different stages of disease severity.
2.2.3 Apoptosis
Apoptosis has a major role in the pathophysiological process in sepsis (Hotchkiss et al. 2005). Apoptotic lymphocytes and gastrointestinal epithelial cells have been found in the spleen and colon of autopsy samples of septic patients (Hotchkiss et al. 1999). Depletion of B-lymphocytes and CD4-positive T-cells by caspase-9-mediated apoptosis, and dendritic cells, but not macrophages, is seen more often in the spleens of patients with sepsis compared with critically ill nonseptic patients or patients with trauma (Hotchkiss et al. 2001, Hotchkiss et al. 2002). Increased lymphocyte apoptosis is also found in the circulation of patients with sepsis (Le Tulzo et al. 2002, Hotchkiss et al. 2005), and this depletion of adaptive and innate immunity cells leads to immunoparalysis in sepsis. Apoptosis can be initiated by two divergent pathways: the death receptor-initiated pathway leading to caspase-8 activation, mediated by for example by Fas, and the mitochondrial pathway leading to caspase-9 activation. Both of these mechanisms are activated in septic patients (Hotchkiss et al. 2005) and lead to activation of caspase-3 in the final common pathway of the apoptotic cell death programme. Increased levels of Fas/Apo-1, a humoral factor involved in the innate immunity response and cell death signal transduction, and other apoptosis-associated molecules have been detected in serum and peripheral blood mononuclear cells of ICU patients with SIRS, sepsis, and MOD (Papathanassoglou et al. 2001, Torre et al. 2003, Freitas et al. 2004). Both apoptotic and necrotic cell death occur in severe sepsis (Hofer et al. 2009).
Cell-free plasma DNA
An increased concentration of cell-free plasma DNA, a possible marker of apoptosis, has been found in various clinical conditions, including trauma, myocardial infarction, stroke, burn, cancer, head injury, and acute abdominal pain (Lo et al. 2000, Jahr et al. 2001, Chang et al.
29 2003, Rainer et al. 2003, Chiu et al. 2006, Yurgel et al. 2007, Rainer et al. 2008). The predictive value of plasma DNA regarding mortality and morbidity has been evaluated in patients with stroke, chest pain, acute abdominal pain, and different trauma or injury (Lo et al. 2000, Rainer et al. 2003, Chiu et al. 2006, Lam et al. 2006, Rainer et al. 2006, Yurgel et al. 2007, Rainer et al. 2008), but several of these studies suffer from shortcomings in adequate statistical methods and patient sample sizes (Table 4).
Cell-free DNA has been detected in the circulation of septic patients (Martins et al. 2000). In addition, patients with severe sepsis and septic shock have been shown to possess increased plasma levels of nucleosomes, in which fragmented DNA is packed during apoptosis (Zeerleder et al. 2003). However, only a few studies have investigated the cell-free plasma DNA concentration in critically ill ICU patients (Martins et al. 2000, Wijeratne et al. 2004, Pachl et al. 2005, Rhodes et al. 2006) (Table 5). Although the results appear promising, inadequate patient sample sizes, no confidence intervals for AUCs, and the preliminary nature of these studies limit their value.
Evidence suggests that DNA is released into the circulation by apoptosis (Jahr et al. 2001, Jiang and Pisetsky 2005, Atamaniuk et al. 2006, Atamaniuk et al. 2008), although the exact mechanism remains obscure. Other possible additive mechanisms, such as necrotic cell death and active secretion, may also exist (Stroun et al. 2001, Jahr et al. 2001). Cell-free plasma DNA derived from patients undergoing hemodialysis and from 6-hour ultra-marathon runners showed typical apoptotic layers in gel electrophoresis (Atamaniuk et al. 2006, Atamaniuk et al. 2008). After the 6-hour run, plasma DNA concentration increased and the mononuclear mRNA expression shifted to pro-apoptotic state compared with the pre-run situation (Atamaniuk et al. 2008). Information from sex-mismatched transplantation patients suggested that most of the plasma DNA is of hematopoietic origin in healthy transplant recipients (Lui et al. 2002, Lui et al. 2003).
The exact characteristics of plasma DNA kinetics and clearance have not yet been specified. Clearance of fetal DNA in maternal plasma after delivery is rapid, with a mean half-life of 16.3 minutes (Lo et al. 1998). After hemodialysis, increased cell-free plasma DNA concentrations are normalized back to pre-dialysis concentrations 30 minutes after finishing the session (García Moreira et al. 2006). Atamaniuk and co-workers (2008) found that plasma DNA concentration increased after a 6-hour ultra-marathon and returned to normal levels in
24 hours, whereas in ICU patients with severe trauma plasma DNA increased early after injury and concentrations remained high for days, especially if organ failure developed (Lam et al. 2003). The circulating plasma DNA has been proposed to be eliminated in the liver and kidneys. Nucleotides are predominantly metabolized in the liver in mice (Gauthier et al. 1996). In humans, approximately 0.5–2% of the cell-free plasma DNA crosses the kidney barrier and is excreted in urine (Botezatu et al. 2000). The pre-dialysis plasma DNA concentrations of patients with chronic renal insufficiency did not differ significantly from the values of healthy controls (García Moreira et al. 2006). However, no clinical study has evaluated the impact of liver and renal failure on cell-free plasma DNA concentrations.
Table 4. Studies investig ating the pro g nostic v alu e of pl as m a DN A i n di ffe rent di seas e s tat es . Study Dia g n o sis Subjects pDNA v a lue M a in pDNA result s Co mm ents a m edi an , *m ea n ____ ___ ___ ___ ____ ___ ___ ___ ___ ___ ___ __ ____ ___ ___ ___ ___ ___ ___ __ ____ ___ ___ ___ ___ ___ ___ __ ____ ___ ___ ___ ___ ___ ___ __ ____ _ L o t raum a n = 84 1381 8-1813 03 k G E/ L a A U C fo r m o rt al it y 0 .8 2 9 no ns ur vi vo rs 2000 27 con trol s 3154 k G E/ L a R ai n er st rok e n = 88 6205 k G E/ L n ons u rv iv o rs a A U C 0.89 f o r 28-day su rv iv al , 11 di ed i n 6 m o n th s 2003 1334 k G E/ L s u rv iv ors a pD N A i n depen d en t predi ct o r fo r 6-m o n th s u rv iv al (O R 1.6) C h iu bu rn i n ju ry n = 28 1115 k G E/ L a pDNA i n creas ed in patie n ts 2006 12 con trol s 287 k G E/ L a w it h bu rn in ju ry vs . con trols (p=.00 01) L a m st rok e n = 44 N o t n o ti fi ed A U C 0.74 f o r 6 m o n th s O n ly 3 pat ien ts h ad pD N A 2006 X con trol s m o rbi d it y or m o rt al it y abov e n o rm al rang e R ai n er ch es t pai n n = 58 475-117 0 k G E/ L a A U C 0 .9 0 fo r 2 -y ea r 6 no ns ur vi vo rs 2006 21 con trol s 350 k G E/ L a m o rta lit y Y u rg el h ead t raum a n = 41 3664 85 k G E/ L* at ad m iss io n 24-h pD N A h igh er i n al l IC U pat ie n ts 2007 1317 08 k G E/ L* a ft er 24 h IC U n ons u rv iv o rs 20 IC U n o n su rv iv o rs 13 con trol s 3031 k G E/ L* A U C 0.709 R ai n er acu te n = 287 3450 G E /m L n ons u rv iv o rs* A U C 0.80, O R 1.4 f o r 2008 abdom in al pai n 40 con trol s 725 G E /m L su rv iv ors* 28-day I C U ad m is si o n or m o rt a li ty ( n = 1 2 ) ____ ___ ___ ___ ___ ___ ___ __ ____ ___ ___ ___ ___ ___ ___ __ ____ ___ ___ ___ ___ ___ ___ __ ____ ___ ___ ___ ___ ___ ___ __ ____ ___ ___ ___ ___ ___ _ A U C , area un der cu rv e; G E, gen o m e equ iv al e n ts ; IC U , i n te ns iv e care un it ; k G E, ki lo g e n o m e equ iv al e n ts ; O R , odds rat io ; pD N A , pl as m a DN A
Table 5. Cell-free plasma DNA studies in critically ill ICU patients.
Study Subjects pDNA valuea Results Comments
__________________________________________________________________________________________ Martins 18 patients pDNA is found in septic 11 sepsis patients
2000 11 controls patients
Wijeratne 94 patients 5493 GE/ml pDNA higher in non- ICU mortality= 2004 22 controls 1970 GE/ml survivors univariately hospital mortality (34%)
(p<.001)
AUC for mortality 0.889
Pachl 94 patients In medical patients Own method 2005 86 controls apoptotic pDNA
higher in nonsurvivors (n=15), p<.05, AUC 0.71
Rhodes 52 patients 80 ng/ml pDNA independent predictor 13 ICU nonsurvivors 2006 10 controls 17 ng/ml for ICU mortality (OR 1.002)
AUC for hospital mortality 0.79
__________________________________________________________________________________________
amedian; AUC, area under curve; GE, genome equivalent (1 GE=0.0066 ng); ICU, intensive care unit; OR, odds
ratio; pDNA, plasma DNA
2.2.4 Stress response
In addition to NF-țB, another extremely conserved cellular stress response system is the heat shock protein (HSP) family and their regulator, heat shock factors. HSPs have many important functions, such as the capacity to act as protein chaperones, protecting vital protein structures and functions, providing cytoprotection against cellular stress, and regulating apoptosis (Mosser et al. 2000). Two cellular response mechanisms, the heat shock response and NF-țB activation, interact with each other. Heat shock factor-1 inhibits NF-țB activity by preventing NF-țB phosphorylation, cytoplasmic release, and DNA binding, presumably by competing for the same or a very close binding site on the genome (Song et al. 2008). This may partly explain the inflammation-induced immune suppression universally seen in critically ill patients.
33 lethal stimulus (Chu et al. 1997). Induced HSP70 expression in lungs attenuated activation of the key pro-inflammatory transcription factor NF-țB and protected against experimental sepsis-induced acute respiratory distress syndrome (ARDS) in rats (Weiss et al. 2007). In septic patients, HSP70 and other HSP levels are elevated and apoptosis decreased in blood mononuclear leukocytes measured by flow cytometry (Hashiguchi et al. 2001). In children with septic shock, HSP70 levels are greater than in nonseptic ICU patients and controls (Wheeler et al. 2005). Polymorphisms in the genes encoding HSP70 have not been associated with outcome in critically ill surgical patients or in patients with community-acquired pneumonia (Schroeder et al. 1999, Waterer et al. 2003, Bowers et al. 2006).
Heme oxygenase-1
Heme oxygenase (HO) was originally identified in 1969 by Tenhunen and colleagues (Tenhunen et al. 1969). Three isoforms, HO-1, HO-2 and HO-3, have been found to date. HO catalyzes the oxidative degradation of heme to carbon monoxide (CO), free iron, and biliverdin. Biliverdin is subsequently reduced to bilirubin by biliverdin reductase (Stocker et al. 1987), and iron is sequestered by ferritin (Figure 2). HO-1 is highly inducible and is upregulated by various stress stimuli and phenomena related to critical illness such as hypoxia, heat shock, oxidative stress, cytokines, endotoxin, ischemia-reperfusion, and heme (Eyssen-Hernandez et al. 1996, Carraway et al. 1998, Terry et al. 1998, Schmidt et al. 2007). HO-1 is expressed in a variety of cells and tissues, e.g. in macrophages in the bone marrow, in circulating monocytes, in liver, in spleen, and in kidney (Morimoto et al. 2001, Yachie et al. 2003, Schaer et al. 2006, Schmidt et al. 2007). In the cell, HO-1 is localized in the endoplasmic reticulum, but it may also compartmentalize in other subcellular organelles and migrate to the nucleus (Lin et al. 2007).
Increased expression of HO-1 mRNA has been found in the blood cells of premature infants with respiratory distress syndrome and pediatric cancer patients with SIRS (Schmidt et al. 2004, Farkas et al. 2008), and increased expression of HO-1 protein in the lung tissue of patients with ARDS (Mumby et al. 2004), in monocytes of SIRS patients (Mohri et al. 2006), and in macrophages within the bone marrow of patients dying from severe sepsis or septic shock (Schaer et al. 2006).
Heme Biliverdin Bilirubin Carbon monoxide Fe++ Heme Oxygenase Biliverdin Reductase Ferritin
Figure 2. HO and its reaction products.
Only a few studies have investigated the plasma concentrations of HO-1. Elderly patients with Alzheimer’s disease have been found to have significantly lower plasma HO-1 levels than elderly controls (Schipper et al. 2000), and patients with silicosis had significantly higher serum HO-1 concentrations than patients with chronic obstructive pulmonary disease and controls (Sato et al. 2006). Ten patients with adult-onset Still’s disease had much higher HO-1 serum levels than patients with rheumatic, liver, or hematological disease (Kirino et al. 2005). The serum levels of HO-1 were also higher in pregnant women with pre-eclampsia than in healthy pregnant controls (Eide et al. 2008).
HO-1 is a cytoprotective enzyme with an important role in cellular defense; antioxidative, anti-inflammatory, antiapoptotic, and antiproliferative effects are mediated by HO reaction products (Stocker et al. 1987, Brouard et al. 2000, Otterbein et al. 2003, Sarady-Andrews et al. 2005). In murine model of aortic transplantation, the attenuation of proliferation and inflammation by IL-10 was mediated through HO-1 (Chen et al. 2005). HO-1-deficient mice have exhibited a dysregulated and highly enhanced inflammatory response with widespread apoptosis of immune cells in response to LPS (Tracz et al. 2007). The genetic deficiency of HO-1 is also extremely disadvantageous, leading to hepatomegaly, lymph node swelling, and anemia (Yachie et al. 1999). HO-1 induction protected against ischemia/reperfusion injury and improved microcirculation in the rat liver (Schmidt et al. 2007). HO-1 has also shown protective effects in lung injury models and on renal tubuli in oxidative injuries (Morimoto et al. 2001).
35 The human HO-1 gene, located in chromosome 22, has several polymorphisms. Evidence suggests that at least two HO-1 polymorphisms are functional. A short GT dinucleotide repeat length allele and one of the single-nucleotide polymorphisms (SNPs), a -413A allele, have been shown to enhance transcriptional activity of HO-1 gene relative to the long GT and -413T alleles (Chen et al. 2002, Hirai et al. 2003, Ono et al. 2003, Ono et al. 2004, Brydun et al. 2007). HO-1 polymorphisms have been associated with various clinical conditions, such as outcome of organ transplantation and susceptibility to emphysema, coronary artery disease, restenosis after peripheral angioplasty and coronary stenting, and ARDS (Yamada et al. 2000, Kaneda et al. 2002, Chen et al. 2004, Ono et al. 2004, Schillinger et al. 2004, Tiroch et al. 2007, Buis et al. 2008, Sheu 2009).
Metabolites of heme
There is vast evidence from experimental and animal studies of anti-inflammatory and antioxidative actions of bilirubin and CO, products of heme catabolism by HO-1, although the exact molecular mechanisms are unknown. Bilirubin and carboxyhemoglobin could serve as surrogate markers of HO activity in clinical setting.
CO shares some functional similarities with another diatomic gaseous monoxide, nitric oxide, which has a well-described role as a signaling molecule. CO has cytoprotective, antiproliferative, and anti-inflammatory effects mediated at least partly by the mitogen-activated protein kinase pathway (Otterbein et al. 2000, Otterbein et al. 2003). HO-1-derived CO increased inflammatory cells’ bacterial phagocytosis in a mouse model of abdominal sepsis (Chung et al. 2008), and CO inhalation showed protection against organ injury in a murine model of hemorrhagic shock by decreasing hypoxia and inflammation (Zuckerbraun et al. 2005). The exact mechanisms behind these protective and homeostatic effects of CO remain elusive. Increased exhaled CO concentrations have been reported in critically ill patients relative to healthy volunteers, and the concentrations also correlated significantly with arterial carboxyhemoglobin and serum biliverdin concentrations, indicating enhanced heme metabolism in critically ill patients (Morimatsu et al. 2006). Both very low and very high levels of arterial carboxyhemoglobin have been associated with increased mortality in patients requiring cardiothoracic intensive care (Melley et al. 2007). Hence, even though potentially protective, excessive induction of HO-1 may be deleterious, and there may be an optimal range for HO-1 induction. Whole-blood CO levels had a good correlation with monocyte HO-1 expression in 36 ICU patients with severe sepsis or septic shock and in 21