The Value of Prerequisite Courses for Statistics
*Faridul Islam, **Saleheen Khan, ***Ian Wilson, and ****Reed GoochUtah Valley University and Minnesota State University-Mankato
Business schools mandate prerequisites to help students prepare for the core business statistics course. A variety of courses are offered to fulfill the prerequisite requirement and students are free to choose which course they will take. Still, some consider the requirement an obstacle to graduation. This paper looks at the issue from a college perspective by empirically examining two questions: (a) Does the choice of prerequisite predict performance in the core course? And if so, (b) do grades earned in the prerequisite course correlate with grades earned in the core course? Results suggest that prerequisites are helpful to student learning, as measured by grades earned. Low elasticity of grades in the core course with respect to grades earned in the prerequisite course implies that colleges can impact leaning, albeit marginally.
Key Words:Education, Prerequisites, Core course, One-way ANOVA
Introduction
Many American students lack a basic competency in mathematics skills (Lemke et al., 2004). This makes it difficult for instructors to add depth and breadth, and for students to pass a business statistics course. To remedy the problem, colleges offer a variety of prerequisite courses from which students can choose. Students may view the prerequisite requirement as a hurdle to degree completion. This can interfere with the learning experience and can be a source of frustration to the course instructor. Research has focused on the role of students in educational outcomes, but the role of academic institutions has not received much attention. This paper focuses on the effectiveness of institutional intervention; it does not address the variables that are controlled by the students.
This paper examines the role institutions of higher learning play in helping students learn. This research purports to explore whether colleges can enhance the learning environment through offering additional academic preparation. Two hypotheses are tested:
(a) Does the choice of prerequisite predict performance in the core course?
(b) Do grades earned in the prerequisite course correlate with grades earned in the core course?
As yet, research has not empirically examined these questions from the point of view of the institution. Answers to these questions will have important policy implications for educational institutions in the development of curriculum and thus in the determination of an appropriate prerequisite mix.
The first United States Conference on Teaching Statistics (2005), hosted by the Consortium for the Advancement of Undergraduate Statistics Education, highlights the importance of the role of colleges in improving student performance. This research provides additional evidence and can be seen as a modest attempt to fill a gap in empirical knowledge on this important issue.
Motivation for the Research
Economic education has been found to affect beliefs, attitudes, and socio-political opinions
(Stigler, 1961). This finding has attracted significant research interest in student learning. A sound knowledge in statistics can add to the understanding of economic laws, thus creating a more informed workforce. This can augment productivity and prosperity, and perhaps make it easier to adjust to changes in technology. Statistics can help make informed managerial decisions. However, research in statistics education has been disproportionate to its importance.
Business students spend a semester on prerequisite courses to enhance their ability to learn statistics. Against that backdrop, it is proper to ask if the time students spend on prerequisites courses is worthwhile. It is also useful to assess whether colleges can be effective in creating an environment favorable for learning statistics.
A recent report by Lemke et al. (2004) found that math literacy and problem-solving skills in the United States were lower than the average in most OECD countries for the year 2003 compared to 2002. This report points to the fact that math skills in the US are falling behind. A solid background in math can improve learning (and teaching) statistics.
The emphases of business curricula vary widely from one institution to another. At Utah Valley University (UVU), the emphasis of the business statistics course is on applications instead of math. If concepts are understood, computations are only a mouse-click away. However, comprehension becomes increasingly difficult if students do not understand the meaning of a
mean or median score or the numbers on the printout from a multiple regression.
Hansen (1986) notes the challenges statistics teachers face in identifying the competencies students should gain in a statistics course. If students are to do more than regurgitate definitions, duplicate proofs, or perform
repetitive computations, expectations must be specified. It is critical to determine if the prerequisites enrich the learning process by providing them with needed skills. This is important to the administrators who must track institutional effectiveness, to the professors who struggle to teach the prerequisites and the statistics courses, and to students who often fail to see the relevance of business statistics in real life. The purpose of teaching statistics is to create a skill that students can apply in some real-world business situation.
Cain (1987) notes four major reasons for requiring prerequisites for a business course: 1) limited time in a one-semester course, 2) large and heterogeneous classes, 3) limited economics and math background of most students, and 4) limited skills of the teacher.
Review of Literature
Despite its importance, research on teaching undergraduate business statistics courses at colleges remains disproportionately low. An exception to this, however, is a two-decade- old work by Sowey (1983), then by Becker (1987), and more recently Becker (2001). Becker (2001) points to the need for greater effort on the part of students in applying their knowledge of statistics. Sowey discusses statistics as it relates to the econometrics course. McNown and Hunt, (1984) discuss econometrics teaching in a lab setting. These papers approach statistics teaching in an interesting way, but fail to address the role of colleges.
Success in a business statistics course depends on the quantitative skills of the students, which unfortunately are on the decline in the US. Opstal (2001) notes that deficiencies in science and math education appear to cut across all schools. The Third International Science and Math Study (TISMS) and its follow-up, TISMS-R, indicate that U.S. students perform significantly below the international average in
both science and math. Even more sobering is that student achievement actually declines over time in the school system. The relatively strong performance of US 4th graders gradually erodes by 12th grade.
Many students suffer from math anxiety as they try to learn quantitative courses in Business. Beasley, et al. (2000), point to the long-term effect when they write that mathematics anxiety seems to occur with high prevalence. Guwuegbuzie (2000) discusses statistics anxiety among graduate students. He finds an important relationship between basic math skills, number of college-level math courses completed and length of time since a math course was taken. Many students come with a preconceived notion of the course even before they are in the program.i
Methodology and Data
Responding to a 1995 pilot study, the Woodbury School of Business at UVU implemented the “Foundations of Business Statistics” course in the fall of 1996 as a prerequisite to the business statistics course. The aim was to prepare students to successfully complete the business statistics class by developing their preparatory skills. To monitor the success of the program, the School maintained records of student grades.
Students in public schools in the state of Utah generally score at or above the national average in mathematics (Davidson, 2002). At the same time, high-school students are required to take only two math courses to enter college. Due to the open admissions policy at UVU, students are not screened prior to admission. They often take placement tests and perform poorly. In the fall of 2001, about 19 percent of the students at UVU were enrolled in a remedial mathematics course. If the math-deficient students did not drop out before taking the statistics course, the number would have been higher.
This paper analyzes data on 2,085 students which was obtained from the Office of Institutional Research. This analysis formally assesses whether the prerequisite courses UVU offers enhance the student learning experience with business statistics. The findings of this paper may shed useful light on future policy directions. The data collected include chosen prerequisites and grades obtained in the core statistics and prerequisite courses. The Information Technology Services Database provided data on high school GPAs. About 16 percent (251) of the students, audited the course or dropped it before completion. This left 1834 students with whom to carry out the analysis. Students who registered for statistics courses between spring of 1998 and fall of 2004 were included.
To answer the research questions of this paper, both One-WayANOVA and multiple regression methodologies were the chosen statistical tools. The former technique answers our first question (Does the choice of prerequisite predict performance in the core course?); the latter answers our second question (Do grades earned in the prerequisite course correlate with grades earned in the core course?).
Some discussion concerns the data on grades. The numbers used for grades for both the prerequisite and the core course were converted from the students’ letter grades. Such data are ordinal and unique up to a monotonic transformation. This may raise questions about its use as a continuous variable. However, it is standard practice to award letter grades and then convert them to numerical equivalents, in a scale of [0, 5]. Since the grades use the same numerical scale, the ordinality should not pose a problem. The UVU scale is [1 – 4].
UVU offers several prerequisites courses: Foundations of Business Statistics (MGMT 2240), College Algebra (MATH 1050), and Introduction to Calculus (MATH 1100). The
Foundations course which emphasizes the application of mathematical tools to business, economics, finance, and statistics, is offered in the School of Business. The other courses are offered in the math department. The distribution of students according to prerequisite (including a “None” category) is presented in Table I. Those in the “None” category are composed of students without a prerequisite, perhaps because they have transferred from other schools.
Results
Measures of skewness, kurtosis, and other descriptive statistics for the residuals were used to check for conformity with the OLS procedure. The skewness is small at 0.247 and kurtosis is 1.341. Both point to a reasonably symmetric and bell-shaped distribution for the residuals. The Jarque-Bera test confirmed normality, which follows the chi-square distribution with 2 degrees of freedom. The p-value (0.28) fails to reject the null hypothesis of normality. A Heteroskedasticity test, which follows the Chi-square distribution with one degree of freedom (statistic computed from R2 of an auxiliary regression), revealed no such problem (p-value 0.2162).
UVSC grading is based on a scale where A = 4.0, A- =3.7, B+ =3.4, B = 3.0, and B- = 2.7. Similarly, C+ = 2.4, C = 2.0, and C- = 1.7. Not surprisingly, the 159 students (8.7%) who took calculus as a prerequisite had the highest average, with 2.988 (almost a B), in the statistics course. The 232 students (12.6%), recorded as having no prerequisites, earned a C in the statistics class. Their score of 2.367 was closer to the upper end of the C (2.0 - 2.4) scale. UVU permits a waiver for students who have passed an equivalent course elsewhere.
A total of 527 students (28.7%) took College Algebra as a prerequisite, earning a mean grade of B-, something closer to the lower end of the scale. They earned 2.74, compared to the 2.7 required for a B-. A total of 916 students (about 50 percent), took the Foundations of Business Statistics course. Although this course was specifically designed for the business majors, the mean score was 2.54. This is in the middle of a C+, which ranges between 2.4 and 2.69. Poor performance may have been due to the pressure factor to take the course and meet the requirement. This course provided the best option for those with relatively lower math skills.
TABLE 1 -Mean Score by Students by Prerequisites One-Way ANOVA Results
Pre Requisite Number of Students Mean Score
None 232 2.367
MGMT 2240 (Foundation) 916 2.538
MATH 1100 (Algebra) 527 2.743
MATH 1050 (Calculus) 159 2.988
F-Value = 28.37 P -Value 0.0000
Foundation of Bus Stat: MGMT 2240 College Algebra: MATH 1050 Introduction to Calculus: MATH 1100
Numerically, the averages in the prerequisites are close to each other. However, the differences are statistically significant (p-value of 0.000). A pair-wise comparison of the results also revealed that each of the p-values was under 0.0100. The differences in performance in the core measured by the grade earned are statistically significant when judged by which prerequisite was taken.
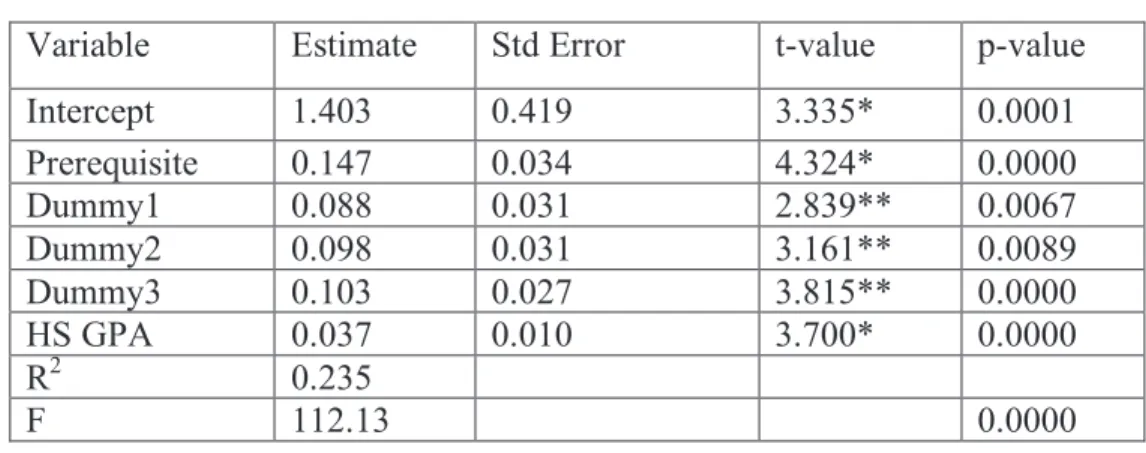
To address the second research question (do grades earned in the prerequisite course correlate with grades earned in the core course?), the multiple regression technique was employed. We hypothesized that grades earned in the core course could be predicted by the grades in the prerequisite courses. This we did by taking the numerical values of the grades in the core and then regressing the grade earned in the prerequisite courses.
To understand the impact of a prerequisite course taken by a student, they were introduced as explanatory variables. Since there are four categories
(including “None”), three dummy variables were used which take a value of 1 if the course is taken, and 0 otherwise. If the calculus course is selected by those with better math skills, selection bias may be created. High school GPA was introduced to filter out this bias.
The overall fit for the multiple regression was statistically significant (F = 112.30, p-value = 0.0000). The R-square was 0.235 (or 23.5%). About 24 percent of the variability in grade in the core course is explained by all the independent variables. The coefficients of the estimated regression equation have the expected signs, and each is statistically significant (p-values < 0.0100). The high school grade was also significant. The coefficients of the dummy variables were positive and low (around 0.10), implying that the prerequisite can affect the grade in the core course. The “None” category was used as the benchmark because its coefficient was lowest in ANOVA.
TABLE -2: OLS Regression Results
Variable Estimate Std Error t-value p-value
Intercept 1.403 0.419 3.335* 0.0001 Prerequisite 0.147 0.034 4.324* 0.0000 Dummy1 0.088 0.031 2.839** 0.0067 Dummy2 0.098 0.031 3.161** 0.0089 Dummy3 0.103 0.027 3.815** 0.0000 HS GPA 0.037 0.010 3.700* 0.0000 R2 0.235 F 112.13 0.0000
All tests are for an appropriate one tail test. *Estimates significant (p -value = 0.0000) ** Estimates significant at 1% or better levels
Sources: UVSC Institutional Research and Information Technology Services Database Dummy1: Foundation (MGMT2240)
Dummy2: Algebra (MATH 1050) Dummy3: Calculus (MATH 1100)
The elasticity was 0.179, computed by taking the percentage response of grades in core courses with respect to a 1 percent change in the grade in the prerequisite, at the mean of the variables. This implies that for every 1 percent increase in the prerequisite grade, the core grade could go up by 0.18 percent. Perhaps this low value can be interpreted as the sign that colleges can help students earn better grades by instituting prerequisites.
A discussion of the estimated partial slope of the regression equation (with respect to the prerequisite grade variable) and the coefficient of determination may be useful. The prerequisites are lower-level courses designed to support the core course. It is possible to earn a better grade in the prerequisite course compared to the core course, which is more challenging. Earning a high score in the prerequisite course does not necessarily translate into a better grade in the core course. Had this been the case, both the slope coefficient and the R2 would be much larger. Because the core is harder than the prerequisite, students tend to score lower in the former compared to the latter, thereby producing a smaller slope and a lower R2.
Concluding Remarks
The results of this study suggest that prerequisites are important, and that the specific choice from what is offered by an institution affects overall learning. Those taking calculus were the best performers, followed by college algebra. The Foundations of Business course (which was created for business majors), had a low average grade. This does not mean that this course has failed to deliver the desired outcome; rather it may have helped those who are relatively weaker in math. High enrollment in this course suggests that students may have perceived this to be less difficult because it is offered within the Business School as opposed to calculus and algebra (which are offered in the math department). The estimate of elasticity of grade in the core with respect to the prerequisite course (elasticity) is low. This perhaps points to the fact that under the current course
offerings of prerequisites, colleges can help students perform better in the statistics course in a limited way.
The findings of the paper suggest that colleges can create favorable educational opportunities for all, and thus enhance the learning environment. In view of this, it may be worthwhile to offer more broad-based courses as prerequisites which better match student background and ability. Both the students and the institution could benefit if future curriculum planning were to address this dimension more carefully.
*Farid Islam is an Associate Professor in the Department of Finance and Economics at Utah Valley University.
**Saleheen Khan is an Associate Professor of Economics at Minnesota State University-Mankato.
***Ian Wilson is a Professor of Finance and Economics at Utah Valley University.
****Reed Gooch is a Professor of Finance and Economics at Utah Valley University
References
Beasley, T., Mark, J. D. Long, and Michele Natali. 2004. “A Confirmatory Factor Analysis of the Mathematics Anxiety Scale for
Children,” Measurement and Evaluation in Counseling and Development, 34: 14-19.
Becker, W. 2001. “Teaching Undergraduate Statistics,” Journal of Economic Perspectives, 15(4): 169-82
Becker, W. 1997. “Teaching Undergraduate Economics,” Journal of Economic Literature, 35(3): 1347-73.
Becker, W. E. 1987. “Teaching Statistical Methods to Undergraduate Economics Student,”
Brown, K. H., Ken McCormick, and Fred Abraham. “The Principles of Macroeconomics Course as an Early Predictor of Undergraduate Business School Performance, 2002.”
Journal of the Academy of Business Education, Fall: 61-69.
Cain, G. G. 1987. “The Centrality of Economics in Teaching Economic Statistics,” American Economic Review, 77: 14-17.
Davidson, K. 2002. Institutional Research, Preliminary Report, UVSC, Mimeo
Grimes, P. W., and J. F. Niss. 1991. “Economic Understanding and Student Success in a Business Curriculum,” Journal of
Education for Business, May/Jun: 309-13.
Guwuegbuzie, J. A. 2002. “Statistics Anxiety and the Role of Self Perceptions,” Journal of Educational Research, 93: 32-3.
Hansen W. L. 1986. “What Knowledge is Most Worth Knowing for Economics Majors?”
American Economic Review, 76: 149-52.
Hinshaw, E. and John Sigfried 1991. “The Role of the American Economic Association in Economic Education: A Brief History,”
Journal of Economic Education, 22(4): 373-81.
Islam, Faridul, Janice Gygi, N. Gardner and Reed Gooch, 2005, “Relevance of Prerequisites to Business Statistics: Some Preliminary Hypothesis and Tests”, Journal of College Teaching and Learning, 2: 53 – 58
Islam, Faridul, N. Gardner, Janice Gygi and R. Gooch, 2004. "Prerequisites and Performance in the Core: Empirics of the Business
Statistics Course”, The Utah Academy Journal of Science Arts and Letters, Forthcoming
Lemke, M. A., Pahlke E. Sen, L. Partelow, D. Miller, T. Williams, D. Kastberg, and L. Jocelyn. 2004. International Outcomes of Learning in Mathematics Literacy and Problem Solving: PISA 2003 Results from U.S. Perspective http://nces.ed.gov/surveys/PISA/PISA2003H ighlights.asp?Quest=2
McNown, R. F. and Gary L. Hunt. 1984. “An Econometrics Laboratory,” The Journal of Economic Education, 15: 71-76.
Opstal, D. V. 2001. “The Skills Imperative: Talent and U.S. Competitiveness,” Issues in Science and Technology, 18: 51-55
Salemi, M. K. and John J. Siegfried, 1999. “The State of Economic Education,” American
Economic Review, 89(2): 355-361.
Siegfried, J. J. and Rendigs Fels. 1979, “Research on Teaching College Economics: A Survey,”
Journal of Economic Literature, 17: 923-69.
Sowey, E. R. 1983. “University Teaching of Econometrics: A Personal View,”
Econometric Review, 2(2): 255 -89.
Stigler, G. J. 1961. “The economics of information,” Journal Political Economy, 69: 213-25.
Walstad, W. and Max Larsen. 1992. A National Survey of American Economic Literacy. Lincoln, NE: Gallup,