THOMAS, MARIE HUFFMASTER, Ph.D. Modeling Differential Pacing Trajectories in High Stakes Computer Adaptive Testing Using Hierarchical Linear Modeling and
Structural Equation Modeling. (2006) Directed by Dr. Richard M. Luecht. 94pp.
This study compares two statistical methods for modeling changes in response latency (timing) patterns on a high-stakes adaptive test: (1) hierarchical linear modeling (HLM2) and (2) growth modeling using structural equation modeling (SEM). The testing context involves the NCLEX-RN®, a variable-length, computerized adaptive test used to license registered nurses in the United States and its territories. Item-level response-time data from 4,415 first-time takers of the NCLEX-RN® examination are used to create and evaluate the different “examinee pacing trajectory” models. The examinee pacing trajectory models are separately fit to examinees at three proficiency levels: (1) clear failers who take an abbreviated test of only 75 items; (2) indeterminate examinees who take a variable-length test of up to 265 items; and (3) clear passers who also take an abbreviated test of only 75 items.
The HLM- and SEM-based approaches provided comparable but not identical results. The estimated intercept terms for the pacing trajectory models were different for each of the three proficiency groups, indicating a possible association between ability and pacing skill. However, the intercepts did not differ dramatically across the two modeling methods because those estimates are essentially based on empirical means. The pacing trajectory slopes varied both in scale and relative magnitude across proficiency groups and by analysis method. The HLM slope estimates reflect the average scale variances of
modeling employs arbitrary constraints imposed to statistically identify the model. These scaling differences made it difficult to directly compare the HLM-based and SEM-based slopes. Ultimately, however, it was concluded that either method (HLM or SEM) is able to model pacing trajectories in a meaningful way.
MODELING DIFFERENTIAL PACING TRAJECTORIES IN HIGH STAKES COMPUTER ADAPTIVE TESTING USING
HIERARCHICAL LINEAR MODELING AND STRUCTURAL EQUATION MODELING
By
Marie Huffmaster Thomas
A Dissertation Submitted to the Faculty of The Graduate School at The University of North Carolina at Greensboro
in Partial Fulfillment
of the Requirements for the Degree Doctor of Philosophy
Greensboro 2006
APPROVAL PAGE
This dissertation has been approved by the following committee of the Faculty of Graduate School at The University of North Carolina at Greensboro.
Committee Chair ___________________________________________ Committee Members ___________________________________________ ___________________________________________ ___________________________________________ ___________________________________________ ____________________________ Date of Acceptance by Committee ____________________________ Date of Final Oral Examination
ACKNOWLEDGEMENTS
This project would not have been possible without the support of many people. I want to thank my adviser, Richard M. Luecht, PhD, for his encouragement and guidance. Also thanks to my committee members, Terry Ackerman, PhD, Daniel L. Bibeau, PhD, Robert A. Henson, PhD, and Rick Morgan, PhD who offered guidance and support. Thanks to Tom O’Neill, PhD, Associate Director, NCLEX® Examinations, and Casey Marks, PhD Associate Executive Director — Business Operations, National Council State Boards of Nursing (NCSBN), for their invaluable assistance.
TABLE OF CONTENTS
Page
LIST OF TABLES………. vi
LIST OF FIGURES………... vii
CHAPTER I. INTRODUCTION………1
II. LITERATURE REVIEW . . . ………...12
Definitions of Speededness……… 12
Definitions of Pacing Skills………... 15
Factors Affecting Pacing Skill in High-Stakes Examinations………... 17
Impact of Speededness on Test Performance in High-Stakes Examinations…… 21
Collection of Response-Time Data on Computer-Based Tests………. 24
Pacing and Speededness for CAT……….. 25
Modeling Speededness and Pacing ……….……….. 30
Rationale for the Present Study.……….38
III. METHODOLOGY……….40
Instrumentation……….. 40
Sampling……… 43
Data Preparation………. 43
Research Questions and Comparative Methods of Analyzing Response-Time Trajectories………... 44
Software Resources and Data Analysis………. 49
IV. ANALYSIS AND RESULTS……… 50
Descriptive Statistics……….. 50
Data Cleaning and Examinee Groupings………... 51
Item Blocking and Baseline Trajectories………... 52
Trajectory Modeling Results for SEM-Based Growth Modeling……….. 57
Trajectory Modeling Results for HLM……….. 74
Comparative Interpretations: SEM Growth Modeling Versus HLM ………82
LIST OF TABLES
Page
Table 4.1 Descriptive Statistics for Response Latency Raw Data ………55 Table 4.2. Parameter estimates and standard errors of estimation for the latent
growth model for clear passers at 75 items (Pass-75)……….. 59 Table 4.3. Parameter estimates and standard errors of estimation for the latent
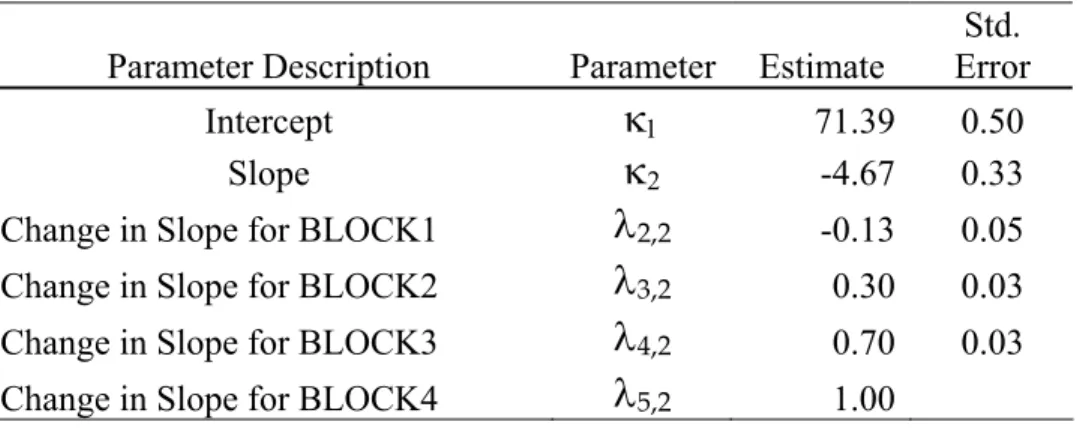
growth model for Fail-75 proficiency group………62 Table 4.4. Parameter estimates and standard errors of estimation for the latent
growth model for “indeterminate-at-75-items” group (Indeterminate)………65 Table 4.5. Parameter estimates and standard errors of estimation for the latent
growth model for Indeterminate group BLOCK0 through BLOCK7………. 68 Table 4.6. Λ rate of change t statistic for the Indeterminate at 75 items (for the first
120 items taken)..………..…………...70 Table 4.7. Parameter estimates and standard errors of estimation for the latent
growth model for indeterminate at 75 items BLOCK0 through BLOCK17………72 Table 4.8. Rate of change (λi - λi-1): t-statistics for the Indeterminate group subset
that took all 265 items……….. 74 Table 4.9. Complete HLM Model Estimates………. 77 Table 4.10. Condensed HLM Intercept and Slope Estimates by Group……… 78 Table 4.11. Level-1 standard deviations, variances, and significance tests for estimates of the intercepts and slopes………... 79 Table 4.12 Level-1 variances, covariances and correlations………. 80 Table 4.13 Reliability of the HLM parameter estimates……… 81
LIST OF FIGURES
Page
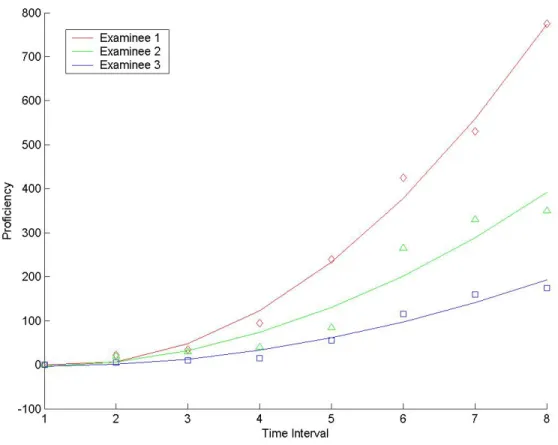
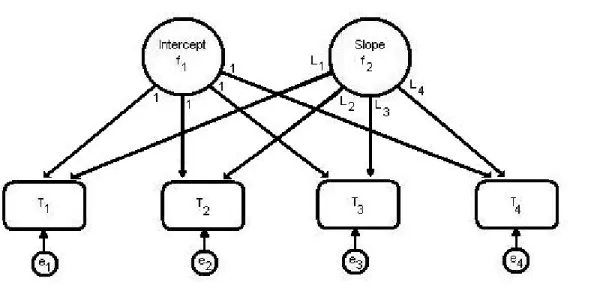
Figure 3-1. Example of individual growth trajectory using HLM………. 46 Figure 3-2. Path diagram for a latent growth model………. 48 Figure 4-1. Raw response-time trajectories for three examinee proficiency-level
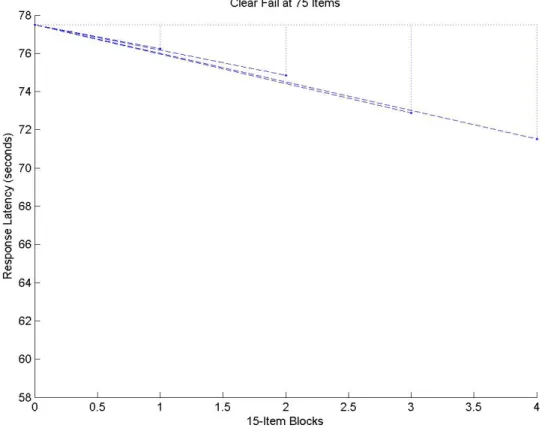
groups (N=4045)……….. 54 Figure 4-2. Average percent-correct scores by item block examinees in three
proficiency-level/test length groups.………... 56 Figure 4-3. Model-based parameter estimates, model-fit statistics, and graphic of the
model for the Pass-75 proficiency group………..…...60 Figure 4-4. Model-based parameter estimates, model-fit statistics, and graphic of the
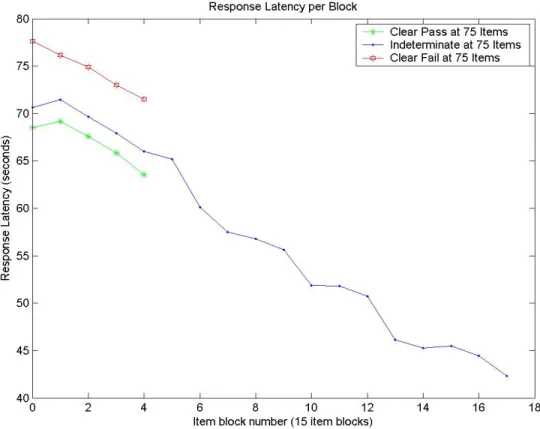
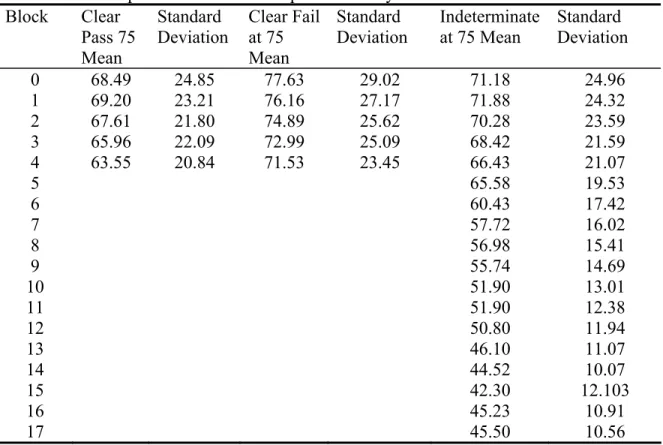
model for the Fail-75 group………...63 Figure 4-5. Model-based parameter estimates, model-fit statistics, and graphic of the model for the Indeterminate group...66 Figure 4-6. Model-based parameter estimates, model-fit statistics, and graphic of the model for the Indeterminate group on BLOCK0 to BLOCK7... 69 Figure 4-7. Trajectories for the subset of the Indeterminate group who took 265 items
(maximum test length)...73 Figure 4-8. Graphic representation of the HLM response-time model...82
CHAPTER I INTRODUCTION
Testing is a ubiquitous part of everyday life but nonetheless a source of anxiety for most people. Historically, testing was a very regimented, structured, and orderly process. Every test taker took the same test under the same conditions. All examinees were given the same amount of time and took a test of the same difficulty. This was an important basis for the comparability of test scores. Final scores could be compared directly to determine the relative level of performance (Plake, 1999).
Computerized adaptive testing (CAT) engenders a different environment for test taking. Based on a particular probabilistic item response theory (IRT) model, adaptive testing allows the administration of very different tests measuring the same latent construct or trait (Plake, 1999). In its typical implementation, CAT requires a large pool of items that have been developed and calibrated to determine the item characteristics (estimated parameters) for a particular IRT model. For example, the common three-parameter (3PL) IRT model mathematically expresses the probability of a correct answer to item i—that is, ui=1 (and where ui=0 indicates an incorrect response) as
(
1 ; , ,)
1(
)
1 exp i i i i i i i i i c prob u a b c P c a b − = θ ≡ = + + ⎡⎣− θ − ⎤⎦ (1) where:θ denotes the examinee’s proficiency score with respect to the measured construct or latent trait;
bi represents the item difficulty;
ai, indicates the item’s capability to differentiate between high and low
proficiency examinees—often called the item discrimination or sensitivity; and
ci is the assumed probability that the low proficiency examinee will be able to answer the item correctly due to chance guessing.
The items in the CAT database or item bank are pre-calibrated using experimental field-test or pilot data to determine statistical properties (ai, bi, and ci in Equation 1-1). The CAT item selection algorithm then proceeds as follows. First, each examinee is given several initial items from the item bank—usually selected randomly from items within the mid-range of difficulty. Based on the examinee’s initial or provisional
proficiency score, as estimated using his or her scored performance on those initial items, the CAT algorithm selects the next item for administration to maximize the accuracy of the current provisional proficiency estimate. In the simplest IRT models, this “accuracy maximization” is accomplished by matching the item’s difficulty to the examinee’s provisional proficiency estimate. Accordingly, the next item selected by the CAT algorithm will be easier if the examinee answers most of the initial items incorrectly and more difficult if the examinee gets most of the initial set of items correct. In general, an adaptive test actually maximizes the IRT test information function
(
)
(
)
(
(
)
)
2 2 2 2 2 2 1 1 1 1 1 1 2 2 1 1 1 1 n i i i i n n n n n i i i n n D a Q P c D a Q P c I I P c P c + + + + + = + + − − + = + − −∑
(2)by incrementally selecting items that provide the greatest contribution to the test
information function for n + 1 items—i.e., choosing the item with the largest value of the
rightmost term in Equation 2. This is a type of statistical optimization. The adaptive testing process continues until one of the stopping criteria is met. Common stopping rules are: (a) reaching a fixed number of items; (b) attaining a specified degree of
accuracy with respect to the provisional proficiency score estimates; or (c) when a certain degree of decision accuracy is attained (in the context of mastery or with respect to a pass/fail standard).
Because the adaptive mechanism selects maximally “challenging” items for each test taker, there may be pacing and other consequences that are experienced by some examinees. The purpose of this study is to understand the nature of the interactions between items and examinees over the course of a computer adaptive test in terms of pacing.
It is helpful to distinguish between the related concepts of “pacing” and “speededness” before proceeding. Speededness is a characteristic of the test that is related to time constraints. A speeded test is often contrasted with a power test. A
speeded test requires examines to work as quickly as possible. Items are typically written to be at a uniformly low difficulty level and time constraints are so severe that nobody can finish all of the items. Many early performance tests were speeded by design, with a typical example being a typing test. Power tests are incrementally ordered by difficulty and provide ample time for everybody to at least attempt every item. It often becomes
clear how much a test taker knows by how far he or she can progress in the power test by providing consistently correct answers.
Bridgeman, McBride and Monaghan (2004) in their work with the Graduate Record Examination (GRE) define speededness in testing as the effect that time limits have on test takers’ scores. If examination time limits prevent examinees from
considering and answering each question, the examination is “speeded”. The examinee score would be lower than if the examinee had been given an unlimited amount of time to complete the test. Henderson (2004) in his work with the Law School Aptitude Test (LSAT) concluded that measures of speed and level of ability (ability to accurately perform difficult tasks) have very low correlations. In the psychometric field, the general consensus is that the results of an assessment or aptitude test can be confounded if the speededness component is large and speed is construct irrelevant for the construct being measured by the test. A speed test is one where an examinee is given the minimum amount of time that is adequate for a typical student to complete the exam while feeling pressure to complete it. For a power exam the examinee is given as much time as
needed. Hornke (2000) in her work with German military services computer adaptive test data found low correlations between test scores under timed and un-timed conditions. Bridgeman and Cline (2004) also found similar results when manipulating the time per item allowed on the Graduate Record Examination and Scholastic Aptitude Test.
Examinees under restrictive time limits use different test-taking strategies than when they take the same exam under unlimited time conditions. Thus, speededness is a test validity issue (Stout & Heck, 1997). The validity of any inferences we make about an
examinee’s proficiency is often based solely on his or her test score. If examination factors such as speededness or secondary examinee proficiency factors such as pacing skill directly or indirectly affect performance on the test, the resulting score will not properly represent the examinee’s true proficiency level. Speededness and pacing therefore both represent potential threats to test score validity (Wise & Kong, 2005).
As noted earlier, CAT has further changed testing by altering the difficulty of the test for each test taker. Therefore, examinees do not receive the same items. The
definition of test speededness has evolved to measure the extent that time limits affect examinee test performance (Hadadi & Luecht, 1998). In contrast, when testing was paper and pencil; speededness was commonly assessed by computing the percentage of examinees failing to reach a percentage of items on the exam (Schnipke & Scrams, 1997). With the advent of computer-based testing, it is easy to store actual response times on each question and even track test taking strategies such as item review and how often answers are changed.
Examinations with a time limit evoke two possible strategies for examinees who do not normally respond fast enough to complete the examination: some examinees do not change their pace, running out of time, while other examinees resort to rapidly guessing at items as time nears the end. Speededness in the CAT environment is linked
to rapid guessingbehaviors (Schnipke & Scrams, 1997). Rapid guessing behavior is
triggered as a test taking strategy when the examinee has an external cue that he or she is running out of time or in the case of the NCLEX-RN® examinee that the test is
guessing behavior, the examinee works rapidly through the items, skimming for
keywords, answering based on partial information or guessing the answer. Contrast this with solution behaviors that demonstrate the examinee read and answered each question
carefully. Solution behavior is demonstrated when the examinee reads each item carefully and fully considers the solution. Response times resulting from solution behavior depend on item length, item difficulty and person specific characteristics. Accuracy depends on examinee ability and item difficulty and other item characteristics (Schnipke & Scrams, 1997).
Hadadi and Luecht (1998) in their work with the National Board of Medical Examiners argue that speededness is not an isolated test characteristic; they posit that in order to understand speededness an understanding of examinee pacing strategies is needed. Speededness is a characteristic of the exam while pacing is an examinee characteristic. Pacing strategies may lead to item omission or rapid guessing. Self-governing functions such as confidence, persistence, test-wiseness, test anxiety, cognitive or personal characteristics may explain examinee test taking behaviors when taking a test they find speeded (Martinez, 1999). The examinee’s ability is a mix of his mental ability, the time devoted to the item, and the persistence given to finding the right solution. A correct answer is given if the examinee has sufficient ability and stays on task, working on the problem until the solution is found. An incorrect answer is more likely if the examinee shifts away from the problem and ceases to work on the task despite his or her sufficient ability (Hornke, 2000).
Conflicting research relating response time to ability does exist. Smith (2000) in working with Graduate Management Admission Test (GMAT) data states that it is possible those items, which are similar with respect to difficulty and discrimination, differ with respect to cognitive demand or the number of necessary procedures to correctly answer an item. It is possible for two examinees of equal ability to be administered items that are equal in terms of item characteristics of difficulty, discrimination and propensity for guessing correctly, but that one examinee was administered a set of items that was more cognitively demanding. The increased
cognitive demand requires more mental energy and time. Test designed to be equivalent in item parameters can vary significantly in testing time. Hornke (2000) reported that the wrong responses required more time than right responses in an adaptive testing environment, indicating that total response time is independent of proficiency. Correct solution response times may represent an effort based on response time of a successful mental process, while wrong solution response times may represent time of lesser effort plus loss of interest leading to failure. Some examinees give up mental effort on an item and guess, thus indicating that they may employ different cognitive processes.
Bridgeman and Cline (2000) found that because more difficult items, which by their nature tend to take longer, are administered disproportionately to higher ability students, there is a positive correlation between test time and ability of the student. Thus for CAT the usual relationship between ability and speededness is totally reversed so that the examination is more speeded for the higher ability student.
New strategies are needed to identify not only speededness but also pacing
strategies and changes in response patterns that could provide valuable information to test designers to allow for an even distribution of questions with a similar time demand and cognitive load.
An example of how speededness research can inform test design practices comes from the NCLEX-RN®, the subject test for the present study. Under the original test design, Bontempo and Julian (1997) found that at least five percent of the examinee population was significantly affected by the time limit on the NCLEX-RN® examination. An implication of Bontempo and Julians’ research was that for this five percent of the examinee population, the NCLEX-RN® may have been somewhat speeded. As a result, the original time limit for the NCLEX-RN® examination was increased from four hours and forty-five minutes to five hours and forty-five minutes.
However, NCLEX-RN® examinees are still required to take different length tests, depending on how they perform. As of 2005, the NCLEX-RN® can be from 75 to 265 items long. The number of items administered must be completed within the total time limit of six hours for the NCLEX-RN®. The time limit includes the tutorial, sample items, all breaks and the examination. The initial test length is determined by the examinee responses to the first 75 test items. Examinees are then gated as “clear passers”, “clear failers”, or are required to continue testing. Some examinees actually make it all the way to 265 items or five hours and forty-five minutes of testing, at which time a final pass/fail decision is made. It is important to note that the total testing time limit does not change for this latter group that continues testing beyond 75 items.
In this study, a sample from the examinee population of 1999-2000 was analyzed to evaluate the interaction between items and examinees over the course of the
examination for these three groups: clear passers, clear failers, and the extended testing group. Using Hierarchical Linear Modeling (HLM) and Structural Equation Modeling (SEM) this study explores the performance and timing trends for items and examinees over the course of the examination. This study specifically attempts to identify
examinees with inadequate pacing and performance trajectories in a high stakes computer adaptive test.
Ultimately, this study focuses on a primary research question. That is, what do pacing trajectories look like in a computer adaptive test for groups at various proficiency or mastery levels and how can statistical models help understand any apparent pacing trajectories?
The following hypotheses will be tested.
H1 : There is no difference in pacing trajectory among Clear pass at 75 items
(clear passers), Indeterminate at 75 items (indeterminate at 75), Clear fail at 75 items (clear failers) and Indeterminate at 76 to 265 items (indeterminate at 76 to 265 items) proficiency groups.
H2 : The Clear pass at 75 items proficiency group establishes a pacing trajectory
above the pass cut score and maintains that trajectory for 75 items.
H3 : The Indeterminate at 75 items proficiency group fails to establish a consistent
H4 : The Indeterminate at 76 to 265 items proficiency group fails to establish a
consistent pacing trajectory above or below the pass cut score and is unable to maintain a consistent trajectory for 265 items.
H5 :The Clear fail at 75 items proficiency group establishes a pacing trajectory
below the pass cut score and maintains that trajectory for 75 items.
The application of statistical modeling to identify pacing/speededness problems is not new. Several researchers have attempted to use statistical models to understand the extent of speededness effects and examinee pacing behaviors. Bontempo (2000) used the NCLEX-RN® data and a probabilistic model to identify speededness and adjust time limits; Yamamoto (1995) used a latent-class HYBRID model and data from the Test of English as a Foreign Language (TOEFL) to identify speededness. He went on to propose adjustments to the IRT parameters that would minimize the impact of speededness, Bergstrom, Gershon, and Lunz (1994), using a hierarchical linear model and data from a national real estate examination, attempted to identify test items with detectable
characteristics that tend to make the items too time consuming. Their intent was to exclude those items from the item bank or to adjust the item selection algorithm to account for the differential item speededness.
Halkitis, Jones and Pradhan (1996) developing a regression model using data from a real estate appraisers national licensing examination to identify test characteristics and properties of test items that could be adjusted so accurate testing time required by examinees could be identified. Similarly, Schinpke and Scrams (1997) used a mixed effects IRT model and data from a non adaptive version of the GRE to measure response
time and detect rapid guessing on individual items. In one of the most comprehensive modeling efforts to date, van der Linden and van Krimpen-Stoop (2003) (also see van der Linden, 2005) developed a lognormal model for time that is capable of estimating a pacing parameter for each examinee and a timing parameter for each item. Van der Linden (2005) has demonstrated some interesting results for simulated data, based upon the Law School Admissions Test, as well as for the Uniform Certified Public
Accountants Examination.
The present study involves an item-by-item analysis of the interaction between items and examinees over the course of the NCLEX-RN® examination. Although other research has dealt with pacing and speededness issues, no one has specifically examined the conditional response and pacing patterns of examinee groups on an item-by-item basis over the course of the examination (i.e., based on examinees’ apparent levels of proficiency).
In addition to the primary research question and hypotheses stated earlier, the study examines whether any of the variance in response time may be due to specific item types or other surface item characteristics. This study further explores identifiable
patterns of examinee behavior that could explain how different types of examinees progress through the test. Ultimately, understanding subject performance domains may reveal aspects of examinee performance that are employed, such as self-regulatory abilities and meta-cognitive abilities that are crucial for high levels of performance (Martinez, 1999).
CHAPTER II LITERATURE REVIEW
This chapter presents a summary of the relevant research literature on
speededness and pacing in high-stakes assessment settings. The chapter begins with some attempts to operationally define speededness and pacing and moves on to cover findings from research studies that highlight the impact of test speededness and that explore pacing as an examinee attribute. Some of the advantages of computer-based testing are discussed insofar as making it possible to collect item-level timing data on every test taker. Finally, various past attempts at and proposals for modeling
speededness and pacing are summarized.
Definitions of Speededness
Previous researchers have searched for a definition of speededness. Anastasi (1976) defines a pure speed test as one in which individual differences depend entirely on speed of performance. These tests are constructed from items of low difficulty with a time limit so short that no one can finish all the items. Each person’s score reflects only the speed with which he worked. Power tests have a time limit long enough to permit everyone to attempt all items. The difficulty is steeply graded and includes items too difficult for anyone to solve so no one gets a perfect score. Both tests are designed to prevent the achievement of perfect scores. The essential question is: to what extent
is the individual difference in test scores attributable to speed? Speededness in testing in the most simplistic view is the effect of time limits on the candidate’s scores. An exam is speeded to the extent that a candidate has a lower score taking the test within the time limit than they would if they had had unlimited time. Bontempo and Julian (1997) proposed that speededness be defined as how much faster examinees work when an examination has a particular time limit versus how fast the examinees would work on an examination with an infinite amount of administration time. Oshima (1994) states by definition a test is a power test when a candidate’s total incorrect score is equal to the number of items for which the person is not pressured by time and simply responds incorrectly. A test is speeded when the candidate’s total incorrect score is equal to the number of items that the candidate does not attempt. Bejar (1985) states that a test is speeded when a portion of the test-taking population does not have sufficient time to attempt every item. Stafford (1971) supports a speededness quotient (SQ) based on the percentage of un-attempted items. A SQ of zero would result if all errors on the test resulted from inaccurate responses. Such a test is a power test: all errors are due to lack of ability or knowledge. If all items are correct but not all items were attempted, a SQ of one would result. That would indicate that an examination is a speeded test and errors are due to slowness rather than lack of ability or knowledge. Bugbee and Bernt (1992) propose examinee feedback as a means of evaluating exam speededness. Postulating that two students might still be working when the time limit is reached but the tasks they are engaged in may be different; they propose an analysis of examinees’ perceptions of time
examinee completes all items on the exam, the allotted time are used as the estimated time needed; if not, then an estimate is calculated based on the number of items completed.
There is not much support for the validity of speeded tests in academic and
certification/licensure contexts. Mislevy (1996) suggested that speeded tests ignore the learners’ active search for meaning, constructing and representing the subject matter. He argues that levels of proficiency or achievement might be better defined and measured not in terms of numbers of facts recalled or recognized, but by determining the test-takers’ levels of understanding of key concepts and principles. Linn (2000) states that speededness; the rate at which questions are presented and the kinds of responses that are required is an equity issue. He suggests that changing the rate of responding required by individual changes the pattern of responses of ethnic, gender, and cultural groups. Is this because the ethnic groups/gender groups use different pacing strategies or that because less able students are generally slower on paper-and-pencil tests and that gender and ethnic group distributions differ on the ability that speededness impacts the groups differently? Linn (2000) asks, what is the mechanism? And why does rate of question response influence the performance of ethnic, gender, and cultural groups? A major mechanism governing conditions where the examinee expects failure yet hopes for success is heightened anxiety. Heightened anxiety typically causes examinees to devote some of their reasoning capacity to the anxiety and less capacity to selecting from their repertoire. Do learners select more conservative or safer strategies under vulnerable conditions, or do they make poor choices? Linn’s (2000) spatial reasoning studies
indicate that heightened anxiety might cause the examinee to check to be sure they are following procedures and waste time in checking and rechecking their behaviors. In high-stakes testing these measures waste valuable testing time. Safe practices increase the time required to solve individual problems and stand in the way of achieving a higher score.
Despite the denial of speededness by most testing organizations, Oshima (1994) argues that speededness remains a significant problem on many large-scale tests. However, his arguments are based upon research involving paper and pencils tests administered with precise time limits, where speededness was ascertained by calculating the percentage of candidates who did not reach the items toward the end of the test. As noted below (also see Luecht & Hadadi, 1998), computer-based testing (CBT) has greatly enhanced our ability to detect speededness and investigated related examinee pacing issues.
Definitions of Pacing Skills
Pacing skill may be defined as time-management proficiency exhibited by the examinees. That is, whereas speededness tends to be viewed as a characteristic of a test and associated test administration time limits, pacing skill is more clearly a test-taker attribute. It should be noted that speededness factors and pacing skill can, and often do, interact.
collected for each examinee. That is, each examinee-by-item transaction can be timed, and the resulting timing variables stored as part of the examination records.
The role of pacing skill in measuring a prescribed proficiency is largely a validity issue. The more pacing skill enters into the mixture of knowledge and skills being assessed (intentionally or by accident), the greater is the onus on the testing organization to justify its inclusion.
Mislevy (1996) explains that a learner’s state of competence at any given point is a complex constellation of facts and concepts, and the networks that interconnect them; of automated procedures and conscious heuristics, and their relationships to knowledge patterns that signal relevance; of perspectives and strategies, and the management capabilities with which the learner focuses his efforts. Tests need to present tasks that learners are likely to carry out in observably different ways: not only correctly as opposed to incorrectly, at what speed, with what products, looking for patterns of similarity, dissimilarity or independence across tasks that probe knowledge structures and problem-solving strategies. Poor or faulty pacing strategies may lead to item omissions or to rapid guessing. Self-regulatory functions such as confidence, persistence or test-wiseness, test anxiety, cognitive or personal characteristics may explain examinee performance
(Martinez, 1999). The examinee’s ability is a mixture of his mental or cognitive ability, the time devoted to the item, and the persistence devoted to finding the correct solution. A correct answer is ideally given if the examinee has sufficient ability and stays on task, working on the problem until the solution is found. An incorrect answer is more likely if the examinee shifts away from the problem and ceases to work on the task despite
whether he or she has sufficient ability or proficiency to correctly respond to the test item (Hornke, 2000).
Factors Affecting Pacing Skill in High-Stakes Examinations
The research literature covering test speededness and examinee pacing skill on high-stakes, large-scale tests per se is rather sparse. Different views of pacing skill and its
consequences are presented in the literature, with most of the discussion focusing on characteristics of the test (e.g., item formats) that might interact with performance. There is little to no specific discussion of pacing skills. Rather, the subject of pacing skills is often relegated to the general category of “nuisance” characteristics within an examinee population. Nonetheless, the literature does at least indirectly suggest that pacing skill should be a matter of great concern.
In most testing settings—at least those in which speed is not a crucial component in the measured proficiency—examinees need adequate time to complete an examination without pressure. If pressures such as time limits are imposed, inaccurate responding or omissions may result, reflecting factors or examinee-test interactions that include more than the examinee’s lack of knowledge or proficiency (Bugbee & Bernt, 1992).
Anastasi (1976) points out that speededness can cause undesirable consequences increasing examinee anxiety, encouraging guessing behaviors, and offering an obvious advantage to those skilled in pacing and applying related test-taking strategies. Under her perspective on speededness, “pacing” is viewed more or less as a consequence of the test
taking process, affected by off-proficiency-construct behaviors or psychological traits such as anxiety.
Martinez (1999) approached the issue from more of a cognitive-science perspective that relates general cognitive demands of various item types to
speededness/pacing skill. Martinez recognized that multiple-choice (MC) items can be written to require simple cognitive processes such as recognizing a correct answer or recalling isolated facts, or they can be constructed to activate complex cognitive states and complicated performances, including understanding, prediction, evaluation, and problem-solving. MC items that merely require recall and recognition skills are far less cognitively demanding than items that mandate the retrieval of complex, associative information (i.e., declarative or procedural knowledge) from long-term memory. The relationships between cognitive demands and speededness/pacing skill are obvious. Test items that require very complex search strategies to access and organize memories stored from multiple learning episodes may be more time-consuming than those that only require low-level associative searches (e.g., retrieval of a common vocabulary word). However, MC items can also change the cognitive demands by interacting with examinee characteristics. A typical example is a MC item that penalizes high-ability examinees by including distracters that are partially correct under only certain conditions. The high-ability examinees “think too much” about the distracters.
Messick (1995) argues that multiple-choice items are limited in that cognition must lead to convergence on a single response selected from a small set of options. The ability to generate novel applications of scientific principles or to posit original
interpretations of solutions does not fit within this constraint. The essence of such
competencies is lost when forced into this mold. Cognitive performances such as problem solving involve divergent production and complex performance. If adequate assessment of a construct requires cognitions of this sort, the construct may not be adequately measured in the multiple-choice format (Messick, 1995).
Examinee characteristics such as age can also affect pacing skill. Henderson (2004) states older examinees tend to do worse on analytical reasoning related to
differences in test-taking speed. Psychometric literature cautions that the variable of age must be controlled in correlation studies because test-taking speed changes for the worse after early adulthood.
Bridgeman (2004) found that various assessments of mental speed have been proposed as measures of intelligence and evaluating semantic processing speed (response time). Although some indicators of mental speed may be related to existing measures of fluid intelligence, crystallized intelligence is unrelated to performance on a broad variety of speed measures composed of cognitive tasks (Roberts & Stankov, 1999).
Bridgeman (2004) also pointed out an indirect consequence of speededness and pacing on performance in an adaptive testing setting. Because of the dependence between item-selection and examinee performance, aberrant responses on examination scores induced by pacing or speededness artifacts can alter the subsequent items selected as well as the estimated proficiency of the examinee. Speededness effects early on tend to have greater impact than effects present later in an adaptive test because, near the end
of the adaptive test, the provisional ability estimate is less likely to change as a function of specific item responses.
Other researchers have taken a more direct line of research in looking at pacing and associated speededness effects. Embretson and Prenovost (2000) examined information processing efficiency by analyzing response times. Cognitive processes examined in this study were attention, mood, motivation and personality. Embretson and Prenovost demonstrated that attention has a significant impact on response time. They went on to suggest that attention involves task-relevant and task irrelevant thoughts. Relevant cognitive intrusions are extraneous thoughts that relate to the testing situation. Task relevant intrusions appear related to tension and worry. Greater attention relates to better task performance. Embretson and Prenovost went on to discuss the cognitive links between attention and arousal. Arousal is a complex cognitive system. An energetic arousal is a subjective experience of high energy or alertness where deactivation of this system is experienced as low energy or feeling tired. A tense arousal system leads to an experience of tension where as deactivation relates to a sense of calm. Tense arousal activation inhibits performance while energetic arousal facilitates performance.
Personality traits may be related to cognitive performance. Longer response times were associated with task relevant intrusions. Response time was postulated to be the mental analogue of cognitive processes. Long response times indicate less effective processing and are associated with solving items. Response time represents a sum of processing speed, the number of processes attempted and other activities the examinee is engaged in while solving complex tasks. Long response time represents processing difficulties and
are positively associated with attentional failures. Longer response times are also associated with successfully solving matrix completion problems requiring correct discovery of several relationships. Response time, measured as persistence on task, is highly related the completion of the multiple relationships required to correctly complete the matrix. Embretson and Prevenost concluded that response times provide distinct information and may provide new information about individual differences. van der Linden (2005) has very recently expanded on this research area by developing a statistical modeling framework for response times.
Impact of Speededness on Test Performance in High-Stakes Examinations Jones (1999) points out that it is important to understand the purpose of high-stakes assessments as well as the population of interest. Examples of high-high-stakes examination purposes include high-school graduation, college admissions, professional certification, and professional licensure. High-stakes assessments are usually given to gauge a student’s proficiency or achievement relative to an expected standard or norm. Some high-stakes examinations offer unlimited retakes, other severely restrict or may even preclude retakes.
The testing environment for most professionally developed, high-stakes assessments is usually standardized so that most of the examinees (except for special accommodations granted by the testing agency) take the test under the same conditions. That is, the testing environment is made as equivalent as possible and every examinee is
provided the same amount of time to complete the assessment. Most high-stakes assessments have time limits ranging from two hours to 2 days (14 to 16 hours).
These fixed time limits have a pragmatic basis. The cost of testing “seat time” is usually based upon facility and related test administration costs. It is simply not feasible to allow every examinee unlimited time to complete his or her assessment.
Where there are time limits, test speededness and pacing become issues. In many high-stakes testing situations such as licensure and certification examinations, there is a conscientious and concerted effort to remove any extraneous testing factors that might influence the examinee (Bontempo & Julian, 1997).
As noted above, most high-stakes examinations allow a reasonably large block of time for examinees to complete a fixed or minimum/maximum number of items. For example, the NCLEX-RN® (which is the subject of this study) allows examinees to have almost six hours to complete between 75 and 265 multiple-choice items. Many
examinees only take 75 items, at which point, a clear pass/fail decision is made. “Indeterminate” examinees proceed with testing until an accurate pass/fail decision can be made or until they complete 265 items, whichever comes first. The test is designed so that every examinee has, on average, more than one minute to answer each item and therefore may only be speeded for the subset of test takers who take all 265 items. The 2005 NCLEX-RN® Examination Candidate Bulletin states that the examinee needs to maintain a steady pace spending one minute on each item. That recommended pacing rate allows the examinee to easily complete the examination in the allotted time if all 265 items need to be administered in order to make a pass/fail decision.
The current time limits for the NCLEX-RN® only came about following some speededness research by Bontempo and Julian (1997). They found that examinees who take the minimum number of items (75 items) seldom run out of time. Only examinees who perform close to the passing standard, and who must take a longer examination, are at risk of running out of time. Bontempo and Julian further predicted that if the early-finishing examinees had been required to take the maximum number of items, and if their pacing levels did not change, over one-third of those examinees would have also run out of time. To come to this conclusion, Bontempo and Julian (1997) used a large sample of over 86-thousand NCLEX-RN® examinees. They reported a mean response time rate of 61.8 seconds per item. The average examinee could therefore be expected to finish 265 items in 4 hours and 33 minutes. Under the previous NCLEX-RN® time limits of 4 hours 45 minutes, Bontempo and Julian predicted that 80 percent of examinees would answer 229 items and 99 percent of examinees would answer 149 items. Therefore, given the opportunity, only 63 percent of the examinees would finish a 265 item examination in 4 hours and 45 minutes.
Bontempo and Julian (1997; also see Julian and Bontempo, 1996) also found that the examinees tended to increase their response rate after the initial 75 items. Note that this finding resulted from the examinees designated as neither clear passers nor failers. Eight-eight percent of the examinees increased their response rate by 12.5 seconds per item and 91 percent increased their response rate on the last 50 items by 18.6 seconds per item. The researchers suggested that the initially slower examinees increased their speed
similar findings for a field trial of the United States Medical Licensing Examination. Bontempo and Julian reported that 66 percent of the examinees increased their speed after the initial 75 items, while 77 percent increased their speed for the last 50 items. Ultimately, Bontempo and Julian (1997) estimated that only about five percent of examinees were affected by the time limit. This was similar to the three percent number that Julian and Bontempo (1996) reported in an earlier study. Nonetheless, these studies jointly suggested that the NCLEX-RN®, as a 265-item fixed-length computer-adaptive test (CAT) was slightly speeded for a small percentage of examinees under the four-hour-and-forty-five-minute time limit. As a result of this research, the time limits for the NCLEX-RN® were increased to 5 hours and 45 minutes in 2005.
However, there are still pacing issues to consider for the NCLEX-RN®. Because response times are longer for items near an individual’s ability level when taking an adaptive test (i.e., the “challenge” factor is approximately equal for all examinees on all items), an adaptive test may indirectly impose an element of test speededness by design. Overton and Harms (1997) actually found a reduction in test length did not lead to a decrease in testing time.
Collection of Response-Time Data on Computer-Based Tests
Computer-base test (CBT) administration allows researchers to collect timing data on every examinee-by-item transaction. These times can be averaged across all items and called “item-response latencies”, or across examinees, in which case they become a measure of pacing skill. Timing data can also be analyzed conditionally—that is, for
examinees at different proficiency levels or across the course of the examination—which provides interesting options for modeling speededness and examinee pacing.
Pacing and Speededness for CAT
Computer-adaptive testing (CAT) applies another dimension to the speededness issue by modifying the difficulty of a test as a function of an examinee’s apparent
(provisional) ability or proficiency level. The adaptive item selection mechanism in CAT actually equalizes the “challenge” (i.e., the probability of a correct response) for each examinee, but may also add to the cognitive load—especially for higher ability examinees who are accustomed to confidently and correctly answering a majority of items. Assessments should include efforts to reduce the mental effort and fatigue
associated with performance, and reduction of performance deterioration related to stress. Assessment of appropriate action control and self-regulation, i.e,. coping strategies, is important as well. CAT puts a new twist on the assumption of non-speededness by changing the difficulty of the test items that are presented. Item difficulty increases and decreases according to the estimated proficiency level of the examinee and the issue of response time becomes time used with the examinee facing progressively more difficult items with less and less time to complete the items. The issue is no longer one of omitted or not reached areas because omitting items is no longer an option; therefore, even when the intent is not meant to be speeded, the result is a speeded examination. An attempt at incorporating speededness constraints into a CAT assembly algorithm has been proposed
That does not imply that time limits should be eliminated in CAT. Examinee seat time at a commercial testing center—the site of choice for many professional certification and licensure testing programs that have migrated to CBT—is extremely expensive and time limits are necessary. The question, however, is, “Are the established time limits contributing to differential test speededness that affects test scores, and, by extension, score validity?”
Bridgeman (2000) states that time limits may contribute to the validity of an assessment but raise equity issues if the limit is imposed for administrative convenience rather than an essential part of what the test in measuring. Bridgeman and Cline (2004) concluded that higher ability students tend to take substantially longer than lower ability student because higher ability students are administered more difficult items. Thus, it may be that the expected relationship between cognitive ability and pacing skill is reversed for a CAT; that is, the test becomes more speeded for higher ability students. Test taking strategies are also confounded by the fact that most CAT implementations prevent the test taker from reviewing previous answers, as well as from omitting answers. Pacing skill, as a examinee-controlled attribute, is therefore complicated by the forced answering and the changing item difficulty implicit in most CAT implementations. Bridgeman (2004), in his work with the Graduate Record Examination-Analytical, found that an examinee who worked at the mean rate for the first 20 items would take 71 minutes to complete the test or 11 minutes longer than the 60 minutes allowed. For higher ability students generally working faster but taking harder and more time consuming items the entire exam would take 77 minutes. Earlier, Bridgeman (2000)
explored the possibility that higher ability examinees might have lower scores if they have a greater number of items that take longer to complete. They found that examinees that took the test items that should have taken longer got higher test scores. There was no evidence that examinees taking long tests were disadvantaged in terms of total scores, at least when using IRT scoring to take difficulty into account. However, Bridgeman (2000) recommended that some index of estimated solution time be incorporated in the item selection algorithm so that no individual gets more than a fair share of
time-consuming items. This recommendation was also proposed by van der Linden, Scrams, and Schipke (1999) and by van der Linden (2005).
Bridgeman, Cline and Hessinger (2003), again using GRE data, found that speededness is a potential threat to the validity of the test because examinations should reflect the intellectual power of the examinees work, not the rate at which examinees work. They concluded that the variation among examinees in the rate of response to test items constitutes an irrelevant source of difficulty in test performance. Nonetheless, the capacity to work rapidly or process information efficiently may be relevant to academic ability. Speededness may be an irrelevant or relevant indicator of academic ability, to the extent that scores are dependent on time is of interest to potential score users. Random guessing substantially drops the ability estimate because the scoring algorithm assumes the missed items reflect lower ability rather than random guessing. It would be useful to know if any test taking strategies or test wiseness might help students use their time more effectively.
Plake (1999) states that with CAT it is possible for one test-taker to be
administered the most challenging questions from the item pool while another could be administered easier items. The scoring model for the situation determines a person’s score not only by the number of questions answered correctly but accounting for the level of difficulty of the test items answered. The stronger candidate answering more difficult items correctly than her weaker friend will receive a higher overall score even if they get the same number of items correct. In computerized adaptive testing the probability of a correct response is a function of the ability level of the examinees (latent proficiency), the item difficulty, item discrimination, and the probability that an examinee with very low ability will be able to answer the item correctly due to chance alone (guessing). In computer adaptive tests all critical dimensions of testing in terms of item content coverage, item selection, and balance of differing levels of cognitive load must be
anticipated and the item selection algorithm must take all of these into account, as well as item difficulty, discrimination and guessing, as the items are sequentially selected. There is a possibility that the examinees will be administered examinations with items that differ in substance, not just difficulty, discrimination, and the propensity to be guessed correctly. Because the examination is developed dynamically, the item selection
algorithm makes its selections based on pre-calibrated item characteristics; items that are equal on these calibrations are considered equivalent in the algorithm selection. Item selection algorithms do not consider length, cognitive complexity, or number of steps. The possibility exists for pairs of items to be equivalent in calibrated features but differ dramatically on other features. One examinee could be administered an examination that
is loaded with more cognitively demanding, time consuming questions than another equally able examinee. Test dynamics can unfairly affect the examinee that will use more cognitive energy and potentially be more time challenged than an equally able examinee that got equally calibrated but differentially less cognitively challenging questions.
Issues of fairness arise when high stakes decisions are based on the results of such differences by psychometrically equivalent tests. High stakes tests should be able to assure that equally able examinees receive tests equal in cognitive demand. Smith (2000) used Graduate Record Examination (GRE) and Graduate Management Admission Test (GMAT) data to show that it may be possible for two examinees of equal ability to be administered items that are equal in terms of item difficulty, item discrimination and propensity for guessing correctly, but one examinee will be administered an examination that was more cognitively demanding. The difficulty level of problem solving and critical reasoning items increase the number of steps required to answer a problem correctly. Smith (2000) went on to demonstrate a quadratic relationship between response time and difficulty and critical reasoning. The response time increases
monotonically with the cognitive demand. Item difficulty and examinee ability may be highly correlated on an adaptive test and evidence suggests the computer adaptive tests do not control for needed response time. The assumption here is that more difficult items require greater cognitive loads, which leads to an increased processing time.
Modeling Speededness and Pacing
The literature provides differing perspectives about the nature of the interaction between test speededness factors and examinee pacing skill. Some of these differences are purely theoretical, others stem from empirical research.
Following a strictly statistical efficiency rationale, Mislevy and Bock (1989) suggested that adaptive testing reduces the time needed for testing. That is, a CAT is theoretically more time efficient because equally reliable tests can be constructed with fewer items, requiring less time. Therefore, speededness is essentially ignorable.
Presenting a contrasting perspective, Overton and Harms (1997) suggested that adaptive testing required more time than the paper-and-pencil testing (PPT). They found that items chosen under the adaptive testing conditions appeared to be more difficult for the examinees because more items were at the appropriate levels for the examinees. Their findings recommended that the test should be shortened (i.e., fewer items administered to the examinees) in order to retain the same amount of total-testing time. They further found no evidence that the adaptive testing enabled a more accurate selection based on equivalent total-testing times. Overton and Harms analysis suggested that average response time per item depends on nature of the relationship between the item difficulty and the examinee’s apparent proficiency. They concluded that items requiring extensive problem-solving and analytical-reasoning steps tend to slow down the examinee. This issue of depth-of-processing/item complexity, pacing, and test speededness would definitely appear to confound the increased efficiency/time reduction assumed by Mislevy and Bock (1989). Scrams and Schnipke (1997) proposed using response times
in standardized tests to compare speed and accuracy as different components of proficiency. Although speed and accuracy have long been used in employment-based performance assessments such as typing tests and in athletic competitions, the idea of considering pacing as a legitimate and valid measure of proficiency has not been widely accepted in educational and psychological testing.
Psychometricians and psychologists tend to look at human performance as involving both speed and accuracy aspects, but assessment of these attributes have decidedly different goals. Cognitive psychologists are commonly interested in the mechanisms of cognitive processing. Information-processing speed can be used as a surrogate for depth of processing, efficiency or generalization of search strategies, etc. In contrast, psychometricians tend to have a [somewhat dated] view of psychology that focuses on proficiency as demonstrated knowledge or skill in a prescribed content domain such as “mathematics” or “reading comprehension”. Many psychometricians are essentially unconcerned about any data other than the scored item responses they
consider the measure(s) of proficiency. Scrams and Schnipke (1997) suggested taking advantage of both approaches—that is, using response accuracy and response speed to provide separate measures of performance. Computer-based tests, as noted earlier, allow us to record cumulative response times for each item. This provides a new measured variable for each examinee and for each item. Considerations changing the relationships between the response-time and performance-related variables may have important implications for research involving different ability groups, different ethnic groups, etc.
Earlier psychological research did consider modeling pacing skills and modeling speededness but was hampered by the lack of accurate ways to collect timing data. Donlon (1980) looked at four methods of evaluating test speededness: (1) the Gulliksen approach; (2) the Cronbach and Warrington approach; (3) the Stafford approach and (4) the Swineford approach. However, because of the lack of specific item-level response time data, all four approaches assume a constant rate of responding throughout the exam. That assumption is probably false. In fact, work by Luecht and Hadadi (1998)
specifically demonstrates that constant timing rates of response are not evident and vary by proficiency level of the examinees (perhaps due to differential pacing skills) and other factors.
Yamamoto and Everson (1997) proposed a HYBRID model to estimate the proportion of examinees that switch to a guessing strategy as each item is sequentially administered. Their model assumes that, if an examinee switches to a guessing strategy halfway through an examination, the probability of making correct responses on the subsequent items no longer adheres to the IRT model. Changes in the conditional probabilities of a correct response under a particular IRT model are therefore most noticeable for the more proficient examinees. The HYBRID model incorporates the notion of speededness of an examination by directly modeling changes in conditional probabilities while analyzing omitted responses. This model-based approach effectively looks at the impact of potential speededness on estimated item parameters and is very useful for examinations in which item difficulty systematically increases. This model characterizes examinee strategy use, detects extraneous strategy influences in estimated
model parameters and incorporates partial knowledge of latent classes. The model is limited by an inability to handle random responses in the first part of the test or to deal with random guessing versus the induced rapid guessing that occurs when examinees run out of time. Like the Schnipke and Scrams’ (1997) mixture model, the HYBRID model has not yet been used in any operational testing settings.
Bergstrom, Gershon and Lunz (1994) proposed using hierarchical linear modeling to compute variance components or facets for different item and test factors. Using increasingly complex models, Bergstrom, et al, computed variance component estimates for within-person and between-person facet models. They found that while relative item difficulty, item correct, item sequence, item length, item content and position of the correct answer did predict detectable amounts of variance in response times, these effects did not vary across persons. In general, they found that more difficult items took longer to answer. They also found that examinees spend more time on items they got incorrect than on items they got correct. Increased total item-text length and increasing item difficulty resulted in proportionately increases in response times as well. Interestingly, examinees took longer to respond if the correct answer is A, B, or C than D, possibly due to the requirement to backtrack and re-evaluate the distracters relative to one another. Some other findings were: (a) that test anxiety significantly predicted variance between examinees—hence anxious examinees take longer on their tests; (b) items answered earlier in the test took longer response times—perhaps due to a caution or warm up period—and examinees increased their rates of responding as they progressed through the
Halkitis, Jones, and Pradhan (1996) found that accurate projections of testing time required by examinees was important to insure that unintended effects due to response speed did not compromise score interpretations in computer administered tests. Their study found that the determination of testing times for credentialing examinations has a significant impact on test validity, testing efficiency and resource allocation. They developed a regression model based on item difficulty, item discrimination and word count that explained 50 percent of the variance in response time.
Item response theory (IRT) modeling strategies have been proposed to deal with pacing as a separate skill. Thissen (1983) was one of the first to formally develop an IRT model for response times. Unfortunately, the parameters of Thissen’s model are difficult to estimate and the model has not seen operational use. Scrams and Schnipke (1997) used a mixture model of response times and item-level performance scores to estimate
proficiency as having two component traits: (1) response accuracy and (2) pacing/response speed. They investigated two different types of speed-accuracy relationships: (a) a within-examinee relationship modeled as a speed-accuracy tradeoff and (b) an across-examinee relationship that was modeled as a covariance between the two traits. Examinees are assumed to require some minimal amount of time to respond above a chance guessing level. Scrams and Schnipke (1997) used a minimal
encoding/intuition response time of 10 seconds in their model. After this minimal processing time—modeled as the lower asymptote of the response time function—the performance given infinite amount of time moves toward the upper asymptote. Once the examinee reaches the upper asymptote in terms of his or her performance (i.e., given his
or her estimated accuracy or proficiency trait), further processing time has little effect on performance. The concepts of minimal processing time, a monotonic increase in
accuracy as a function of processing time and upper asymptote appear to be
psychologically useful constructs for considering response time in a testing context. Scrams and Schnipke (1997) provided a psychological rationale for their approach to modeling speed and accuracy relationships. Examinees have direct control over their choice of test taking strategies and their response time but only indirect control over accuracy. Strategies selected affect the speed-accuracy relationship and increased
processing time generally results in better performance. Strategies can affect the minimal processing time, the solution time and accuracy. Examinees choose their response speed based on their selected strategy. Measures of response time alone do not provide enough information to predict the examinee’s performance. Speededness is linked to rapid
guessingbehaviors. Rapid guessingbehaviors are indications that the examinee is
working rapidly through the items—that is, changing his or her pacing strategy—
skimming for keywords, answering based on partial information or guessing the answer. In contrast, solution behaviors demonstrate that the examinee reads and answers each
question carefully (Schnipke & Scrams, 1997). Schnipke and Scrams (1977) developed an estimate or an index of what they termed rapid guessingbehavior. Strict time limits
can cause examinees to focus on processing speed to the detriment of response accuracy. As time begins to expire, examinees may begin to respond with minimal processing.
that sense, rapid guessing is not the same as “random guessing” in that it does involve some strategic attempt at correctly answering the remaining items. However, the response patterns that emerge in the data are often too noisy to provide usable
measurement information about the examinees’ proficiency levels. Identifying rapid guessing responses is necessary to eliminate those response times that are statistically higher than expectation, using a likelihood ratio. Luecht and Hadadi (1998) attempted to expand on Schnipke and Scrams work by providing empirical criteria for determining the point where rapid guessing might be activated, as well as some of the first attempts to model differential trajectories in response times and performance occurring over the course of an examination. It should be noted that Schnipke and Scram’s (1997) model has not been operationally used on any examinations to date.
Van der Linden and van Krimpen-Stoop (2003) developed a log-normal model for response times to check times for aberrance in examinee behavior on computerized adaptive tests. The detection rates of the Bayesian checks outperformed those for the classical checks but with more false positives. In all conditions, initial estimate of theta (θ) was set equal to zero. Unfortunately, the results from the empirical examples were more discouraging than anticipated. This method is not recommended for checks at the level of the individual response.
Van der Linden (2005) has extended this log-linear model for response times and helped to distinguish between ability and speed as separate, intentional proficiency factors, versus speededness as a nuisance factor. Van der Linden’s response-time model provides ways of estimating specific item and person parameters that respectively
characterize item-level speededness for a population and examinee-level pacing
proficiency. The estimated item timing parameters can subsequently be constrained using automated test assembly algorithms or heuristics (van der Linden, 2005) to ideally
minimize the influence of speededness when it is considered to be a nuisance factor. Bontempo and Julian (1997) attempted to model speededness in a variable-length computer-adaptive test (CAT). They focused on the NCLEX-RN® and suggested three methods of analyzing speededness: (1) computing an examinee response rate; (2) investigating changes in response rate within an individual’s examination; and (3) exploring changes in examinee response rate across repeated examinations. Bontempo (2000) went on to develop a probabilistic model assessing speededness. Bontempo’s rationale was that, given the pass/fail outcomes from tests like the NCLEX-RN® examination, examinees whose proficiency scores place them near to the cut score must have their test score estimated with greater precision than examinees whose proficiency is well above or well below the cut score. (That is, it takes less measurement precision to classify clear passers and clear failers than to classify individuals in the region of the pass/fail cut score.) At the same time, administering these “indeterminate” examinees more test items to increase the decision accuracy of the test may put them at risk for exceeding the time limits. In the NCLEX-RN® context, the problem does not extend to clear passers and clear failers. In fact, each year, less than 5 examinees fail to complete the minimum 75 items within the required time limit. In any case, examinees that need the maximum number of items may change their pacing strategies in an effort to