High School Exit Exam
Have Recent Policies Improved
Student Performance?
Julian R. Betts Andrew C. Zau Yendrick Zieleniak
Karen Volz Bachofer
Supported with funding from the Donald Bren Foundation
T
he California High School Exit Examination (CAHSEE) plays an important role in California’s public school accountability program. Beginning in grade 10, students have multiple chances to pass the mathematics and English Language Arts components of this exam. If they do not pass both components by the end of grade 12, they will not receive a high school diploma.Statewide analysis has shown that many students struggle with this exam and, despite modest improvements in recent years, about 1 in 16 fails to pass the exam before the end of grade 12.
To determine which types of interventions might be most effective, we considered two statewide policies and one local San Diego program designed to help struggling students pass the exam.
y Assembly Bill (AB) 128, which provides districts with funding for tutoring students, primarily in grades 11 and 12.
y Assembly Bill 347, which authorizes and provides funding to districts to provide at least two years of support services for students who failed to pass the CAHSEE by the end of grade 12.
y The San Diego Unified School District’s program that offers a set of CAHSEE preparatory classes in mathematics and English Language Arts for students in grades 11 and 12 who have not yet passed the exam.
DaviD Butow/corBis
Our findings suggest that the tutoring provided under AB 128 does not help students pass the exam, and that the other two interventions we studied—extending student enroll-ment and providing prep classes directly related to the exam—help only a small percentage of students pass the test. We estimate that only 1.5 to 3 percent of the students who failed the CAHSEE in grade 10 later passed the test as a result of these interventions. In other words, the interventions unfortunately do not help the vast majority of those failing the CAHSEE in grade 10 to pass the test in a later grade.
Thus, we conclude that either new or improved interventions are needed in high school, or new interventions are needed to help students prepare for the exit exam well before they first undertake it in grade 10.
An earlier PPIC report by Zau and Betts (2008) demonstrated that forecasting models using data in earlier grades could accurately identify students at risk of failing the CAHSEE. The current report shows that data from as early as grade 2 are highly predictive, and thus districts could intervene in elementary school to assist students likely to have trouble with an exit exam many years in their future.
To help teachers and administrators identify at-risk students, we have developed a CAHSEE Early Warning Model. Individual districts can use this model to predict the probability of their own students passing the exit exam when they reach grade 10, using test scores from the California Standards Test (CST) and several other variables gathered in grades 6 or 8.
The CAHSEE Early Warning Model is available at
www.ppic.org/main/dataSet.asp?i=1234 and http://sandera.ucsd.edu/resources/index.html For the full report and related resources, please visit our publication page:
Introduction
Over the past decade, high school exit exams have become widely used throughout the United States (Warren 2007). Designed to measure how well students are meeting state standards in core subject areas, these tests have become an integral part of many states’ educational accountability systems.
In California, beginning with the class of 2006, public high school students have been required to pass both the mathematics and the English Language Arts (ELA) sections of the California High School Exit Examination (CAHSEE) in order to obtain a high school diploma. Thus, from a student’s perspective, the CAHSEE (or “Kay-See,” as it has come to be known) is the lone “high stakes” ele-ment in California’s mandated assessele-ment and account-ability system.1
The primary purpose of the exit exam is to boost student achievement in California’s public high schools and to ensure that every graduate meets minimum compe-tency standards in reading, writing, and mathematics.2
A secondary goal of exit exams, usually unstated, is to signal to postsecondary institutions and employers that high school graduates have met those standards.3
From its very beginning, the CAHSEE has generated controversy and lawsuits. In response, the California State Legislature has created laws that provide funds to school districts to support students who do not pass the exit exam during their first attempt in grade 10 and, more recently, to provide two additional years of support for students who did not pass the CAHSEE before the end of grade 12.
In this report, we examine the effectiveness of these legislative interventions and also the results of promising intervention efforts in the San Diego Unified School District (SDUSD), the second largest school district in California. In a previous study, Zau and Betts used data from this dis-trict to develop a forecasting model able to determine which students are likely to pass or fail the exit exam, based on data available from as early as grade 4. We discuss further refine-ments in this model and its potential for enabling districts to effectively identify students at risk of failing the CAHSEE and to intervene preemptively many grades before students first take the exit exam in grade 10.
Questions Addressed in This Study
How effective are each of the interventions in helping students pass the exit exam?
y AB 128 allocated funding to schools to support tutoring for students in grades 11 and 12 who had not yet passed the CAHSEE. With the availability of several more cohorts of students than the single cohort studied by Zau and Betts in 2008, can we say anything more about whether this funding improved the ability of students to pass the exit exam?
y SDUSD independently created CAHSEE prep classes
in mathematics and ELA for students who had not yet passed a given component of the exit exam in grades 11 and 12. Have these courses improved pass rates on the exam?
y AB 347 provides funding for districts to re-enroll students who failed to pass the exit exam by the end of grade 12 and thus failed to graduate from high school. Did this funding lead to greater re-enrollment among non- graduates and greater passage rates on the CAHSEE? We find that, taken together, these interventions have produced quite limited gains for struggling students. This raises the question of whether we might be able to inter-vene earlier in students’ education to better prepare them for the exit exam in grade 10. For such an intervention to be cost-effective, we would need to identify the students specifically at risk of failing the exam, so that we could
Statewide analysis has shown that
many students struggle with the CAHSEE and
about one in 16 fails to pass the exam
before the end of grade 12.
provide targeted assistance. To explore this issue, we relied upon the forecasting model developed by Zau and Betts to address two additional questions.
How accurate is the Zau and Betts forecasting model? Zau and Betts maintain that their predictive model can be used to forecast pass/fail rates on the CAHSEE for students beyond those in their study sample (the class of 2006 in San Diego). Because we now have data from the classes of 2007, 2008, and 2009, we can make predictions using the model based on the class of 2006 to determine the model's accuracy. This leads to a question of direct interest to poli-cymakers: Can districts construct such a model and use it for younger cohorts to identify students for early academic intervention?
Can we forecast results on the CAHSEE using student outcomes even earlier than grade 4?
The Zau and Betts forecasting models use snapshots of student background and achievement as early as grade 4. In the interest of assisting students even earlier in their education, can we use data based on students’ report cards in grade 3 or even grade 2 to accurately predict their subse-quent performance on the CAHSEE?
We find that the 2008 model predicts CAHSEE out-comes for later cohorts remarkably well. Armed with this knowledge, we have come up with a new and simplified CAHSEE Early Warning Model with variables that should be readily available to any district. We have published this model as an Excel spreadsheet on the PPIC website. The model can be used by any California district to identify students at risk of failing the CAHSEE many years before they reach grade 10.
In the following sections, we describe the exit exam and the three interventions mentioned above. We evaluate the effects of these interventions, describe the CAHSEE Early Warning Model we developed to help districts identify stu-dents who may need help preparing for the exit exam, and conclude with a brief discussion of policy considerations.
California’s High School Exit Exam
The CAHSEE is a high-stakes exam—not only for students but for schools and districts as well. Students who fail the exam will not be granted a diploma from a public high school in California. Student performance also affects schools and districts, since CAHSEE results are used to calculate the Academic Performance Index (API)—the measure used in California’s public school accountability program—and are the sole measure used to determine Adequate Yearly Progress (AYP) at the high school level under the No Child Left Behind Act of 2001.
The CAHSEE consists of two parts—an English Language Arts (ELA) test and a mathematics test— designed to evaluate whether students have mastered English at approximately a grade-10 level and mathematics at a grade-8 level. Students are offered multiple opportuni-ties to take the CAHSEE—once in grade 10, twice in grade 11, and up to five times in grade 12.4 For accountability
purposes, all students are required to take the CAHSEE for the first time in grade 10. Students must pass both parts of the exam in order to receive a high school diploma, but if students pass one part and fail the other, they need to retake only the part they failed.5
BoB Daemmrich/corBis
The Early Warning Model may be able to predict CAHSEE performance based on student performance in either grade 6 or 8.
Supportive Legislation
In light of early concerns about the number of students who were failing the exit exam, California enacted legisla-tion that authorized funding to districts for the remedia-tion of students who failed the CAHSEE on their first attempt in grade 10.
Assembly Bill 128
In September 2005, the California State Legislature passed AB 128, earmarking $20 million in state funds to provide “intensive instruction and services” for students in the graduating class of 2006 who had yet to pass both parts of the CAHSEE. The types of instruction and services allowed under AB 128 include (1) individual or small group instruction; (2) counseling; (3) instruction designed to meet specific needs of eligible pupils; (4) additional teachers; (5) the purchase, scoring, and review of diagnos-tic assessments; and (6) appropriate teacher training to meet the needs of eligible pupils.
In the 2009–10 school year, California shifted AB 128 funding into flexible funding, allowing districts to use the state money however they see fit and thus creating the possibility for districts to provide tutoring or any type of assistance far earlier than grades 11 and 12.
Assembly Bill 347
The legislature passed AB 347 in October 2007. This law requires districts to provide support services for up to two consecutive academic years after grade 12 to students who do not pass the exit exam by the end of grade 12, effective with the class of 2006. The law specifies that districts must (1) post notices in all 10th-, 11th-, and 12th-grade classrooms informing students of their eligibility to receive services beyond grade 12; (2) notify students who have completed grade 12, but have not passed both parts of the exam, that they are eligible to receive services for two years beyond grade 12; (3) provide English proficiency instruction to English Learners who have not passed the test; and (4) tailor remedial services specifically toward passing the CAHSEE. As with AB 128, AB 347 services may be provided during
the regular school day if they do not supplant students’ instruction in core curriculum areas. Services may also be provided on Saturdays or before or after school hours.6
Assembly Bill 1802
Starting with the 2006–07 academic year, AB 1802 provides $200 million (approximately $80 per student in grades 7–12) to increase the number of school counselors in the state’s middle and high schools. Counselors hired under AB 1802 are required to review all student records to identify students who failed, or are at risk of failing, the exit exam. They are also required to conduct individual meetings with students and their parents to discuss each student’s transcript and performance on standardized assessments, the consequences of not passing the high school exit exam, the coursework necessary to complete middle/high school, and, if applicable, remediation opportunities. Counselors are to explain each student’s options for continuing education if he/she fails one or both parts of the CAHSEE, including enrolling in adult
education or a community college, continuing enrollment in his/her school district, and continuing to receive intensive instruction and services until he/she passes both parts of the CAHSEE (for up to two consecutive academic years after completion of grade 12).
CAHSEE Support in the
San Diego Unified School District
Well before the state legislature allocated funding for support services through AB 128, AB 347, and AB 1802, the San Diego Unified School District recognized the importance of providing targeted assistance for students having difficulty with the exit exam. During the 2003–04
The CAHSEE is a high-stakes exam—
not only for students but for schools
academic year, SDUSD developed and piloted CAHSEE prep courses in ELA and mathematics for students in grades 11 and 12 who had yet to pass both parts of the exam. Beginning with the 2004–05 school year, these elec-tive courses were offered at all district high schools during the school day, before or after school, and during summer school; the prep courses are still being offered as of the 2011–12 academic year (San Diego Unified School District 2003–2010).
District administrative records indicate that from the 2005–06 through the 2008–09 academic years, SDUSD used the “intensive instruction and services” funding provided under AB 128, AB 347, and AB 1802 to support the full range of services specified in the legislation and that nearly all eligible students received at least one type of service.
Although SDUSD used most of the funding it received through the legislative interventions to support intensive instruction related to the exit exam, the district also used a portion of the funding to provide CAHSEE-specific coun-seling for students (in both individual and group settings), convene parent meetings and student assemblies, engage translation services, and notify post-grade-12 students about their eligibility for CAHSEE support services to help them pass the exam.7
Are the Interventions Helping?
AB 128 Tutoring
AB 128 provides districts with per capita funding to sup-port tutoring and other assistance for students in grades 11 and 12 who have not yet passed the CAHSEE. To assess whether this funding was successful, we compared cohorts of students who were offered such assistance to cohorts of students who were not. Students who were scheduled to graduate in spring 2006 or spring 2007 were offered AB 128–funded assistance only in grade 12, while later cohorts were offered assistance in both grades 11 and 12. We can therefore compare student performance on the
CAHSEE in grade 11 for the classes of 2006 and 2007, which did not receive tutoring, with the performance of later cohorts of students that did receive tutoring.
We estimated models to test for a difference between these two sets of students, while taking into account student and school characteristics (details are presented in Technical Appendix A). We found no statistically signifi-cant difference in CAHSEE passage in grade 11 between the cohorts that received tutoring and those who did not, leading us to conclude that AB 128 funding did not have an appreciable effect.
CAHSEE Preparatory Classes
SDUSD provides struggling students with special CAHSEE prep classes during school, before and after school, as well as during summer school. The classes provide explicit instruction on the structure of the CAHSEE and test-taking strategies, as well as content-based instruction focusing on the knowledge and skills necessary to pass the ELA and mathematics components of the exam.8
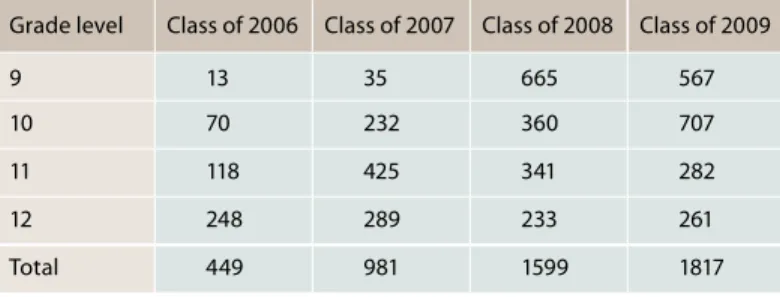
Data gathered from student transcripts from 2005–06 through 2008–09 show that, over time, a growing num-ber of students participated in these courses (Table 1). Some students enrolled in these courses before taking the CAHSEE for the first time, as evidenced by the enrollment of students in grades 9 and 10. One interesting trend is the growing number of students taking these courses at lower Table 1. Participation in CAHSEE prep classes has increased, especially at lower grade levels
Grade level Class of 2006 Class of 2007 Class of 2008 Class of 2009
9 13 35 665 567
10 70 232 360 707
11 118 425 341 282 12 248 289 233 261 Total 449 981 1599 1817
source: authors’ calculations.
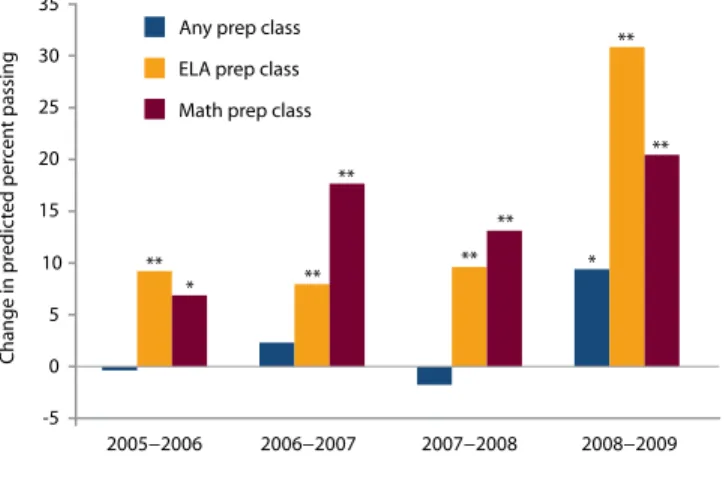
There seems to be very little relation between taking a prep class and passing the CAHSEE overall. Not surpris-ingly, the effects are larger when we study the relationship between taking a prep class in a given subject and the results on the corresponding part of the exam. As shown by the middle (orange) bars in each trio of bars, the effects of taking an ELA prep class are positive and statistically meaningful in all four years, with by far the largest effect occurring in 2008–09, where the probability of passing the ELA portion of the CAHSEE is predicted to increase by 31 percent. Similarly, taking a mathematics prep course improves the probability of passing the mathematics por-tion of the CAHSEE by up to 20 percent by 2008–09, as shown by the red bars in Figure 1. We cannot say with certainty why the effect of the prep classes appears to have increased over time. It might be that the quality of the prep classes has improved over the years.
As mentioned above, the CAHSEE prep classes are offered at various times during the regular school day, as well as outside of regular school hours and, in a few cases, during the summer. We used a model that allowed for the effects of these courses to vary across these three settings. grade levels. When the CAHSEE was first required, it was
probably necessary to provide considerable assistance to those who had not passed the test by grade 12; hence the large number of grade-12 students in the first year. In later years, more students in lower grades enrolled in these courses, possibly because they and their teachers were more likely to be aware that they were at risk of failing in grade 10.
To determine which types of students were directed into CAHSEE prep classes, we examined various char-acteristics of grade 11 students who had not passed the CAHSEE in grade 10. When we divided students into those who took a CAHSEE prep class and those who did not, we found strong evidence that schools were directing students with weaker achievement into the prep classes. We found that students with lower CAHSEE scores and lower CST scores, as well as English Learners and non-white/non-Asian students, were particularly likely to enroll in the CAHSEE prep classes.9
We estimated models of performance on the CAHSEE from 2006 to 2009 for students who did not pass CAHSEE by grade 10, or by grade 11 in the case of grade-12 students. Our goal was to test whether enrollment in one of the prep classes in grade 11 or 12 led to better outcomes. Figure 1 shows the estimated effects of taking a CAHSEE prep class in a given subject on student pass rates in the correspond-ing CAHSEE subject test (in mathematics or ELA) in that same school year. We also estimated the relation between taking a CAHSEE prep class in either subject area on the probability of overall passage of the CAHSEE. The height of each bar indicates the estimated effect.
Looking specifically at whether taking any prep class leads to overall passage of the CAHSEE, as shown by the leftmost bars in each trio of bars in the figure, we see a noticeable change from 2005–06 to 2008–09. The first year the prep classes were made available, there was no improvement in CAHSEE passage rates. However, by the last year included in this study, there is a moderate, statistically significant improvement in the probability of passing the CAHSEE related to taking any prep course.
Figure 1. English or mathematics prep courses improved students’ performance in the corresponding subject in the CAHSEE but did not increase their chances of passing the overall exam
source: author calculations.
Notes: ** denotes statistical significance at the 1 percent level and * denotes statistical significance at the 5 percent level. For instance, significance at the 1 percent level means that if there were truly no effect, there is a 1 percent or less probability that we would have estimated such a big effect.
Any prep class ELA prep class Math prep class
-5 ** * ** ** ** ** * ** ** 0 5 10 15 20 25 30 35 Change in pr edic ted per cen t passing 2005−2006 2006−2007 2007−2008 2008−2009
(Technical Appendix A also includes estimates of the sepa-rate effects for each school year.)
Figure 2 shows the results when we differentiate between CAHSEE prep classes taught at different times. Mathematics and ELA prep classes taken during the regu-lar school day, and mathematics classes taken during the summer, have strong positive associations with passing the corresponding subject in the CAHSEE.
Figure 2. Student performance on the CAHSEE depends in part on the time period of the prep course
source: author calculations.
Note: ** denotes statistical significance at the 1 percent level and * denotes statistical significance at the 5 percent level.
-10 ** ** ** -5 0 5 10 15 20 25 30 35 Change in pr edic ted per cen t passing
Type of prep course ELA prep class during school ELA prep class after school ELA prep class during summer
Math prep class during school Math prep class after school Math prep class during summer
AB 347 Funding for Non-Graduates
The obvious policy questions are whether AB 347 encour-ages a greater percentage of non-graduates to return to high school, and whether it increases the percentage of these students who pass the CAHSEE within one or two years after the year in which they failed to graduate.
We find that a large percentage of students in the classes from 2007 to 2009 who failed to pass the CAHSEE during grade 12 did return the following year, but a substantial fraction of these students were special needs students enrolled in non-diploma-bound programs.10
We include, but distinguish, these students in Figures 3 through 5. Because it is unlikely that many of these stu-dents would pass the CAHSEE, and because the main reason they re-enrolled was to take life skills classes, we exclude them from our statistical analyses following the figures.
One important question is whether the percentage of students who failed to graduate in the classes of 2007 through 2009 who came back and passed the CAHSEE after grade 12 exceeds the corresponding percentage for the class of 2006, for whom AB 347 was not available at the end of grade 12. Figures 3 through 5 present the outcomes for seniors by cohort, illustrating the percentage re-enrolling and the percentage who subsequently passed the CAHSEE.11 As shown in Figure 3, the percentage of
seniors who re-enroll within the first year after they fail to graduate because they did not pass the CAHSEE increases sharply after the class of 2006, reaching a plateau of about 50 percent for the classes of 2008 and 2009. As for those who came back two years after their senior year, Figure 4 shows a steady increase in re-enrollment progressing from the class of 2006 to the classes of 2007 and 2008, although as might be expected, smaller percentages of students return during the second year.
Students who returned to school to take the CAHSEE did not fare well on the test. As shown in Figure 5, the percentage of those failing to graduate in grade 12 due to not passing the CAHSEE who then passed the CAHSEE within a year of finishing grade 12 increased for the classes ap photo/paul sakuma
Mathematics and ELA prep classes seem to help in each subject area but do not meaningfully improve the overall CAHSEE passage rate.
of 2007 and 2008 compared to 2006, but then fell sharply in 2009. The corresponding results for the percentage of students who retook and passed the exam within two years are slightly better: they rose from 1.9 percent in the class of 2006 to 6.3 percent in the class of 2007, 7.5 percent in the class of 2008, and 6.3 percent in the class of 2009 (see Technical Appendix A).12
It should be noted that the increases in re-enrollment and pass rates shown in Figures 3 through 5 occur in years that coincided with the recent recession. It is possible that students had difficulty finding jobs during that time and decided to return to school to complete their education.13
Thus, we cannot claim with certainty that AB 347 brought these students back to school after they failed to graduate. However, it is unlikely that all of the increase in CAHSEE
passage rates in 2008 and later years was due to the reces-sion. We discuss this issue in Technical Appendix A, where we examine the effects of the recession on labor-force participation rates between 2006 and 2009 among young adults lacking a high school diploma.
The Combined Effect of AB 128 Tutoring, CAHSEE Prep Classes, and AB 347 “Re-Enrollment” Funding on CAHSEE Pass Rates
To obtain a sense of the overall effect of CAHSEE inter-ventions, we examined the population of students in the classes of 2008 and 2009, focusing on the students who failed one or both subject exams in grade 10. We estimated the number of students in this sample who passed the CAHSEE within two years after grade 12 who would not have passed had the three interventions not been in place.14
Figure 3. Since AB 347 (starting in 2007), there has been a sharp increase in seniors re-enrolling within one year of failing to graduate
source: author calculations.
0 10 20 30 40 50 60 %
Class of 2006 Class of 2007 Class of 2008 Class of 2009 Diploma bound
Non-diploma bound
Figure 4. Since AB 347 there has been only a slight increase in seniors re-enrolling in the second year after they failed to graduate
source: author calculations.
0 10 20 30 40 50 60 %
Class of 2006 Class of 2007 Class of 2008 Diploma bound
Non-diploma bound
Figure 5. Since AB 347 (starting in 2007) there were modest increases in the percent of students failing to graduate who passed the CAHSEE within one year after grade 12
source: author calculations.
0 5 10 15 20 25 %
Class of 2006 Class of 2007 Class of 2008 Class of 2009 Diploma bound
Non-diploma bound
One interesting trend is the growing
number of students taking prep courses
Figure 6 presents our “more optimistic” and “less optimistic” estimates of the combined effect. In our more optimistic calculation we use all estimated effects, even if they are not statistically significant. The less optimistic calculation sets the effects that are not statistically signifi-cant to zero.
We find that, at most, 3 percent of those who failed the CAHSEE in grade 10 subsequently passed the exam as a result of AB 128 tutoring in grade 11, CAHSEE prep classes, and AB 347. Our lower bound estimate is an effect of about 1.5 percent, with AB 347 accounting for almost all of the effect. It may seem surprising that the prep classes do not play a larger role, until we recall that although the CAHSEE prep classes in each subject increased the prob-ability of passing that same subject on the exit exam, we found that they had little effect on passing the CAHSEE overall.
Although Figure 6 shows a small degree of success, it is clear that these high school interventions, either by them-selves or taken together, don’t provide much help to most students who fail the CAHSEE in grade 10.15
The Dual Need for
Accurate Forecasting
and Earlier Intervention
Developing a New Forecasting Model
Given that the interventions in grades 11, 12, and after grade 12 have helped only a small percentage of students struggling to pass the exit exam, an obvious question arises: Might it not be better to try to help at-risk stu-dents by offering them assistance well before they take the CAHSEE for the first time in grade 10?
Early intervention, in grade 9, in middle school, or even earlier in elementary school, makes sense for a number of reasons. First, the mathematics portion of the CAHSEE covers material that is normally taught between grades 6 and 8. If students have trouble mastering mathematical concepts, why wait until grade 11 to help them? Similarly, although the ELA portion of the exit exam is nominally pitched at a grade-10 level, English is a cumulative subject. Students who fail to exhibit reading and writing skills in grade 10 have struggled with basic literacy in earlier grades.
Second, tutoring and extra classes like the ones pro-vided by AB 128 and CAHSEE prep are relatively inexpen-sive interventions. Inviting students who did not graduate to re-enroll in high school for up to two additional years is far more expensive. It follows that assisting students years before they reach high school can save a considerable amount of taxpayer money, not to mention two years in the lives of students.
A third reason for intervening early is that a steady and reliable set of supports for students spread over many grades is more likely to have a lasting effect on students’ capabilities than any number of eleventh-hour interventions.
Figure 6. Even the more optimistic estimates of student pass rates after grade-10 failure suggest that existing CAHSEE interventions are not very helpful
source: author calculations.
0 0.5 1.0 1.5 2.0 2.5 3.0 3.5 % 2007 2008 Year of expected graduation
More optimistic estimates
2009 AB 347 CAHSEE Prep AB 128 tutoring in grade 11 0 0.5 1.0 1.5 2.0 2.5 3.0 3.5 % 2007 2008 Year of expected graduation
Less optimistic estimates
The logic for early intervention seems clear. But educa-tors need to have some way to identify students at risk of failing the CAHSEE before they reach grade 10. In an earlier PPIC report, Zau and Betts (2008) created models that used data from grade 9 to explain CAHSEE outcomes and found that they could predict success on the exit exam quite well. More surprisingly, they could explain the student’s eventual CAHSEE outcomes using data from grade 4 almost as well as they could using data from grade 9. This finding opens up the possibility that districts could quite accurately identify students who are likely to fail the exit exam many grades before they first take the exam in grade 10. If this is the case, districts could provide targeted assistance much earlier.
A practical issue with such a forecasting model would be whether a school district could estimate a model once and then use it for several years. If this were possible, it could be financially feasible for a district to use such a model, because district statisticians wouldn’t need to tin-ker with the model every year. Seeking to create a reliable, streamlined model, we tested the reliability of the forecast-ing model developed by Zau and Betts for the class of 2006,
applying it to three cohorts of high school students after the 2006 cohort.
We then tested whether it is possible to use student data from as early as grade 2 or 3 to predict which stu-dents will have trouble with the exit exam, opening up the possibility of intervention very early in elementary school.
Finally, we unveil our CAHSEE Early Warning Model, which uses a small set of student variables that should be available to any school district in the state. The model could help any school district in California to identify students at the end of grade 6 or grade 8 likely to require additional assistance in order to pass the CAHSEE in grade 10.
Early warning models have been developed for many different educational objectives, and 16 states have devised models to provide information on at-risk students (Davis 2012). An early warning model designed specifically to forecast which students will have trouble passing the CAHSEE seems especially valuable, since—as we discussed earlier—it is a high-stakes test that determines whether a student will graduate from high school.
ap photo/DamiaN DovargaNes
How Reliable is the Zau and Betts Forecasting Model?
Figure 7 offers an example of the predictive accuracy of the model published by Zau and Betts (2008). On the horizon-tal axis we group students from the class of 2006 into 10 groups, based on the predicted probability that they would pass the CAHSEE by the end of grade 12. (There are two bars in each range, one showing predicted results based on information available on students in grade 4, and the other based on information available on students in grade 9.) On the vertical axis we show the actual percentage of each group who passed the CAHSEE by the end of grade 12.
If neither grade 4 nor grade 9 characteristics had any ability to predict passing the exam, all the bars in the figure would be the same height, indicating that the same percentage of students in all groups passed the CAHSEE. Instead, Zau and Betts found a very strong positive rela-tionship between predicted and actual pass rates. For instance, based on grade-4 information gathered in 1998,
the predicted probability of passing the CAHSEE for the students represented in the first set of bars was below 0.1—that is, below 10 percent—and the actual percentage of these students who passed the CAHSEE by 2006 was 6.3 percent. The predicted probability of passing the CAHSEE for the students represented in the far right set of bars was over 0.9—that is, over 90 percent—and 98.9 percent of these students did pass the exam.
Next, we set out to answer an extremely important question for policymakers: Can a model that uses one cohort of students (in this case, the class of 2006) accu-rately identify students in future cohorts at risk of failing the exit exam? If so, individual districts could create such a model once and continue to use it in later years to identify students most at risk of failing the CAHSEE (as long as the exam content remains the same).
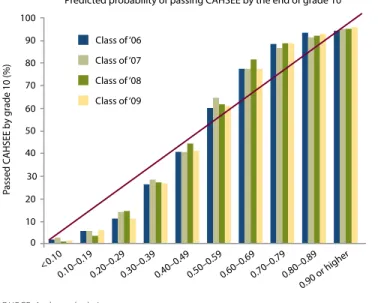
We used the models of the probability that a student in the class of 2006 would pass the CAHSEE by grade 10 or by grade 12 to forecast the probability that students in the classes of 2007, 2008, and 2009 would pass the exit exam. Figure 8 compares the percentage of students in the classes of 2006 through 2009 who passed the CAHSEE in grade 10 to their predicted probability of passing the exam given their characteristics in grade 9.16
We have drawn a 45-degree line through this figure to give a rough indication of the bar height we would expect if the Zau and Betts model accurately predicts pass rates for the class of 2006 (on which the analysis is based) and also for the classes of 2007–2009. Figure 8 suggests that the Figure 7. Zau and Betts found a strong relationship between the
predicted and actual percentage of students who passed the CAHSEE
source: Zau and Betts (2008), Figure 4.4.
Note: this chart shows the percentage of students who passed the cahsee by the end of grade 12 plotted against the predicted probability of their passing, based on information about the students available in grades 4 and 9.
0 10 20 30 50 40 60 70 80 90 100 Passed C AHSEE b y g rade 12 (%) 0.10–0.19 <0.10 0.20–0.290.30–0.390.40–0.490.50–0.590.60–0.690.70–0.790.80–0.89 0.90 or higher Grade 9 Grade 4
Predicted probability of passing CAHSEE by the end of grade 12
Can a model that uses one cohort
of students (in this case, the class
of 2006) accurately identify students
in future cohorts at risk of failing
the exit exam?
predictions are remarkably stable across all four cohorts. The increasing height of the bars as we move to the right indicates that the actual mean probability of passing the CAHSEE by the end of grade 10 is increasing as the pre-dicted probability of passing increases. The differences between actual and predicted pass rates are generally quite small.17
How Early Can CAHSEE Results Be Predicted?
Zau and Betts showed that it is possible to identify students at risk of failing the CAHSEE using data from grade 4, with only a small loss of predictive reliability compared to the estimates obtained using grade-9 data. This sug-gests that we might be able to go back even further in a student’s educational history to find information that could predict later outcomes. The earlier we can identify students at risk of failing the CAHSEE, the more time schools will have to provide the assistance necessary for student success on the exam.
Our SDUSD data for the class of 2006 go back only as far as grade 4. Thus, we used later cohorts to estimate
grade 3 and grade 2 models of success on the CAHSEE: for grade-3 models we used data for the graduating class of 2007, and for grade-2 models we used data for the graduat-ing class of 2008.18
Because our findings with grade-2 data were similar to our findings with grade-3 data, we will focus only on grade-2 results here. (For grade-3 results, see Technical Appendix B.)
Our findings reveal several important factors that strongly predict grade-2 students’ probability of pass-ing the CAHSEE in grade 10 and by the end of grade 12. Figures 9a and 9b show, for passage by grade 10 and grade 12, respectively, the predicted effect of a one-point increase in grade point average (GPA), a similar one-point increase in a “behavioral GPA” that we created using information on report cards, and a 5 percent increase in the percent-age of days a student is absent. Toward the right side of the figures, estimated effects of being an English Learner and of being in a given racial/ethnic group are shown, with the comparison group being a white student who is not an English Learner. A one-point increase in GPA
or behavioral GPA is associated with large increases in the predicted probability of passing the CAHSEE. For example, the model shown in Figure 9a suggests that a grade-2 student with a 4.0 GPA and a 4.0 behavioral GPA is 22 percent more likely to pass the CAHSEE by the end of grade 10 than a student with a 3.0 GPA and 3.0 behavioral GPA. The magnitude of the effect of academic GPA is about three times that of behavioral GPA, which is not surprising Figure 8. The Zau and Betts model, based on the class of 2006,
accurately predicts CAHSEE passage rates for classes 2007–2009
source: author calculations.
Note: Based on student data available in grade 9. 0 10 20 30 50 40 60 70 80 90 100 Passed C AHSEE b y g rade 10 (%) 0.10–0.19 <0.10 0.20–0.290.30–0.390.40–0.490.50–0.590.60–0.690.70–0.790.80–0.89 0.90 or higher Class of ‘06 Class of ‘07 Class of ‘08 Class of ‘09
Predicted probability of passing CAHSEE by the end of grade 10
The earlier we can identify students
at risk of failing the CAHSEE, the more
time schools will have to provide
the assistance necessary for
student success on the exam.
given that the former directly measures academic achieve-ment. Students who are absent a greater percentage of time are slightly less likely to pass the exit exam in grade 10. Even after controlling for academic and behavioral GPAs and time absent, we find that English Learners in grade 2 are about 7 percent less likely to pass the exam in grade 10. Strikingly, all of the major racial/ethnic groups have differ-ent probabilities of passing the exam than the comparison group of white students. Asian students are the most likely to pass the exam while African American students are the least likely. (Asian students were 7.2 percentage points more likely than white students to pass, while African American students were 9.6 percentage points less likely than white students to pass.)
Figure 9b shows the corresponding results for a model of passing the exit exam by the end of grade 12, again based on students’ characteristics in grade 2. The estimated
effects of academic GPA and behavioral GPA are broadly similar to the model of grade-10 outcomes, but there are important differences with regard to student demographic and linguistic characteristics. Although we can see in Figure 9a that students who are English Learners in grade 2 are significantly less likely than fluent speakers to pass the CAHSEE in grade 10, the difference becomes smaller and statistically insignificant when we model pass rates by the end of grade 12. This suggests that English Learners generally overcome their disadvantages on the exit exam by the end of high school. Zau and Betts (2008) came to a similar conclusion. Even more notable is that the large gaps across racial and ethnic groups in the grade-10 model shrink dramatically by the end of grade 12. At that point, African American students are the only racial group for which there remains a statistically significant gap with the comparison group (white students).19
source: author calculations.
Notes: Behavioral gpa is a variable we constructed, ranging from 0 to 4, that averages teacher comments on the report card about whether the student begins promptly, follows directions, exercises self-discipline, and exhibits good overall classroom behavior. the bars for academic gpa and behavioral gpa show the predicted effect of a one-point increase in the given type of gpa, while the percentage-of-time-absent bar shows the predicted effect of a five-percentage-point increase in time absent. the five bars at the right of the figure show the predicted effects of being a student who is an english learner or a member of a given racial/ethnic group, relative to a white student who is not an english learner. ** denotes statistical significance at the 1 percent level and * denotes statistical significance at the 5 percent level.
Figure 9a. Differences between students in grade 2 strongly predict grade-10 pass rates on the CAHSEE
Figure 9b. Racial and language differences between students in grade 2 are generally less influential in predicting pass rates on the CAHSEE by the end of grade 12
** ** ** ** ** ** ** -15 -10 -5 0 5 10 15 20 Change in the pr edic ted pr obabilit y of passing b y g rade 10
GPA grade 2 % time absent Behavioral GPA English Learner African American Asian Hispanic Other race
-15 ** ** ** ** -10 -5 0 5 10 15 20 Change in the pr edic ted pr obabilit y of passing b y g rade 12
% time absent Behavioral GPA English Learner African American Asian Hispanic Other race GPA grade 2
Another notable difference is that, as we move toward the model of passing the exam by the end of grade 12, the effect of academic GPA falls, while the effect of behavior GPA rises modestly. A one-point increase in GPA is pre-dicted to increase the probability of passing the exit exam in grade 10 by 17 percentage points compared to just over 11 percentage points in grade 12. The converse is true for behavioral GPA, where a one-point increase in this GPA is predicted to increase the probability of passing the exam by 5.3 percentage points in grade 10 and 6.6 percentage points by grade 12. The latter pattern applies to absences as well. A 5 percent absence rate is correlated with a reduction (relative to a student with zero absences) in the probability of passing the CAHSEE by the end of grade 10 by 3.6 per-cent, compared to 4.7 percent by the end of grade 12.20
Using information from early grades as predictors of success on the CAHSEE entails a tradeoff between early detection and the precision of the predicted probability of passing. On one hand, using data from early grades introduces additional noise to the estimation, decreasing the precision of the model. On the other hand, the reduc-tion in precision has to be balanced against the ability to identify students at risk—and to then intervene—as early as grade 2. Technical appendix figures B3 and B4 address these concerns. The first figure shows that SDUSD could
target quite narrowly. For instance a focus on students with a predicted probability of passing by grade 12 below 50 percent would identify about one-seventh of grade-2 students for assistance.
The finding that student performance as early as grade 2 can be used to identify students at risk suggests room for improvement in the current support system associated with CAHSEE. At the same time, we recognize that using a model based on grade-2 characteristics as the primary method for identifying students at risk will not be feasible for some students. A significant fraction of high school students are not observed in the district before they enter middle or high school. Thus the grade-2 framework would have nothing to say about their probability of success on the CAHSEE. This logistical challenge suggests that the models using grade-8 or -9 data could be used as the main forecasting tool, and the models using earlier student characteristics could be used in supplementary ways. It might be best to gauge the achievement of students as early as elementary school in order to focus remedial attention on extremely low-performing students who will need many years of attentive support to pass the CAHSEE, and to use the analysis of students in middle or high school to assess the needs of a broader set of students who on average may be able to pass with less intensive interventions such as a one-semester CAHSEE prep course.
Introducing the CAHSEE Early Warning Model
Our CAHSEE Early Warning Model is designed to help districts outside San Diego identify students who may need help preparing for the exit exam. The model, available on the PPIC website, provides a spreadsheet that districts can use to identify grade-6 or grade-8 students at risk of failing the CAHSEE in grade 10. A natural question that district administrators might ask is “Can this model more success-fully identify at-risk students than district administrators can by simply examining CST test scores?” The answer is a qualified “yes.” To explore this question, we re-estimated two versions of the grade-specific Zau and Betts 2008 models. The first set of models included the same explana-tory variables used by Zau and Betts as well as the additional saNDy huFFaker/corBis
Forecasts based on grade-8 or -9 data could be the main early warning tool, and earlier data could be used in supplementary ways.
student samples available to us. The second set of models used only CST test scores in the given grade. We found that we could explain more of the variation across students using the full models, but the models that used only the test scores performed quite well. We compare these models in more detail in Technical Appendix B.
This comparison has shown that although test scores can provide fairly accurate predictions, we can do better using several other variables, including GPA, percent of days absent, and English Learner status. Districts can plug their own data into the spreadsheet and test whether the SDUSD-based model provides accurate predictions for recent cohorts of their students. If their predictions are accurate, they can, with a reasonable degree of confidence, use the model with younger cohorts that have not yet reached grade 10.
Finding students at risk of failing the CAHSEE using this new model offers several advantages over simply examining CST test scores. First, the information from multiple variables used in combination can produce a more accurate prediction. Second, the model allows district administrators to experiment with different cut-offs—levels at which students are identified as at risk and in need of intervention. Once they establish a given cutoff, administrators can apply the model to a cohort of students
for whom actual grade-10 CAHSEE outcomes are known;
the spreadsheet will then produce three useful numbers: 1. The number of students who would be included in the intervention, given the choice of cutoff;
2. The percentage of students who failed the CAHSEE
who would have been included in the intervention;
3. The percentage of students who passed the CAHSEE
who would have been included in the intervention.
The first statistic is useful because it can help the district to estimate the number of students who would have received help, and the attendant costs. The second two statistics are helpful because they indicate for various cutoffs, how many of the students who really did need help would have received assistance, and how many students who passed the exam
without any new interventions would have received the intervention.
Once district administrators have checked the degree to which the model predicts accurately for cohorts that have already reached grade 12, they can apply the model to cohorts of students still in middle or early grades of high school to tailor support to the neediest students.
Conclusion
Our findings suggest that two interventions have helped some students pass the exit exam—AB 347 funding for stu-dents who return to school after failing to pass the CAHSEE by the end of grade 12, and San Diego’s CAHSEE prep classes for students who fail to pass the exam in grade 10. The third intervention, AB 128 tutoring, did not appear to have any significant influence. These interventions have not helped as many students as we would like. Of the students who failed one or both components of the exit exam in grade 10, fewer than 1 in 30 subsequently passed because
of these interventions. Or to put it another way, only 1 to 2 percent of all grade 10 students passed the exam because of these interventions.
Thus it is clear that although these interventions are somewhat helpful, they have not helped get all students over the hurdle of the exit exam. The logical conclusion is that we need better interventions in high school or new interventions that can begin to help students before they first take the exit exam in grade 10.
Intervening before students first take the CAHSEE in grade 10 makes a great deal of sense, especially given that the skills needed to pass both the ELA and mathematics components of the test are taught to students throughout elementary and middle school. It could also be cost effec-tive to intervene earlier, given the high costs of re-enrolling non-graduates for up to two years beyond grade 12.
Early intervention, however, requires that school districts be able to identify students at risk of failing the CAHSEE several grades before they first take the exam in
grade 10. Our updates of the forecasting models in Zau and Betts (2008) provide several important messages. First, districts need not go to the expense of updating their forecasting models annually; the Zau and Betts model based on the class of 2006 worked very well for three later cohorts. Second, it seems that a unified school district
could, if it so desired, intervene in the early elementary grades: our model could quite accurately forecast grade-2 students’ performance on the CAHSEE 8 to 10 years in the future. Our updated and simplified forecasting model, the CAHSEE Early Warning Model, is available to any district as a spreadsheet on the PPIC website. Districts can test the validity of this model using past graduating classes from their own districts, and if the forecasts prove accurate, can then with reasonable assurance use the model to identify students entering grade 7 or grade 9 who should receive additional help on the content covered by the exit exam. Another important consideration is that the state of California has decided to bundle intensive instruction and services funds supported by AB 128 into flexible funding,
which enables districts to provide tutoring or any other
type of assistance far earlier than grades 11 and 12 (the original limitation of AB 128). Unfortunately, for districts that are not unified but include only secondary grades, it will not be possible to use these funds at earlier grade levels, since the district provides education only to students in the higher grades.
A question that naturally arises is “What is the best use of this funding by districts that desire to boost per-formance on the CAHSEE?” We need to learn a great deal more about what works best. However, districts may want to develop their own versions of the San Diego CAHSEE prep classes. Students who took these classes in a given subject area were much more likely to pass the exit exam in the same subject area, although the impact on overall pas-sage of the exit exam was more muted, probably because many students fail both parts of the exam in grade 10. The key feature of these classes is that they extend far beyond basic test-taking strategies, focusing on the mathematics and ELA content being tested in the exit exam. Combined with a readily available forecasting tool—such as the CAHSEE Early Warning Model that can identify at-risk students in earlier grades—such courses offered before grade 10 could provide a significant service to school dis-tricts and their students. This dual policy of early warning and early intervention could provide a cost-effective way to save students from both the needless anxiety of failing the exit exam later in high school, and worse, giving up one or two years of their lives after grade 12 to master basic com-petencies in order to receive a high school diploma.
Technical appendices to this report are available on the PPIC website: www.ppic.org/content/pubs/other/612JBR_appendix.pdf
We need better interventions in high school
or new interventions that can begin
to help students before they first take
Notes
1 Through the Early Assessment Program (EAP)—a collaborative
effort of the California State University (CSU), the California Department of Education, and the California State Board of Education—grade 11 students in California may voluntarily take an augmented version of the California Standards Tests in ELA and mathematics. Students who meet CSU expectations on the EAP need not take placement tests when entering the CSU system. Thus, although the EAP is not a mandated assessment for all students, it could be considered a “high-stakes” moment by those who take the test.
2 “Overview of the California High School Exit Examination,”
downloaded 3/17/11 (www.cde.ca.gov/ta/tg/hs/overview.asp).
3 While it may be true that exit exams motivate most students to
work harder in school and learn more, the notion that passing the exit exam signals ability to employers—who then pay higher wages—is largely untested. A recent paper by Martorell and Clark (2010) finds that grade 12 students in Texas and Florida who pass the exit exam on their final attempt earn no more in their early twenties than do grade 12 students who do not pass the test. This result implies that the signaling value of passing a high school exam may not be high, at least for this marginal group of students.
4 The CAHSEE is administered five times statewide for grade 12
students, but because state guidelines do not allow students to retake the test until results from a prior test have been received, most districts offer the test fewer than five times in grade 12. In SDUSD, grade 12 students have at least three opportunities to take the CAHSEE in grade 12.
5 The skills embodied in the exit exam should have direct payoff
in the labor market. For instance, Rose and Betts (2004) show that high school students who complete Algebra I have signifi-cantly higher earnings in the labor market in their late twenties, and that this course in particular predicts earnings well. Thus the exit exam, by including an algebra component in the math-ematics portion of the exam, tests students on skills with direct labor-market rewards.
6 See letter from State Superintendent Jack O’Connell (October
26, 2007) regarding implementation of AB 347 (www.cde.ca.gov/ ta/tg/hs/implement347.asp).
7 A summary of the findings of earlier research on the CAHSEE
(based on analyses of San Diego data, data from other dis-tricts, and statewide studies) is available in Appendix C in the technical appendices, which we refer to throughout this report and which are available at www.ppic.org/content/pubs/ other/612JBR_appendix.pdf. Appendix C also provides further details on state legislation with examples of how SDUSD imple-mented some of the state-mandated measures.
8 For instance, the description of one of these courses, Math
CAHSEE Support (4088) reads as follows: “In this course, students study structure of the California High School Exit Examination (CAHSEE) and the requisite mathematics skills they will need to pass the mathematics portion, including tips for studying and taking a multiple-choice exam. Students receive explicit instruction, facilitated practice, and independent prac-tice with feedback. This course is designed to be offered within the regular school day.” Thus the courses are a blend of content instruction and instruction on test-taking strategies.
9 This is important because it shows that students were
“nega-tively selected” into these classes, which should lead, if anything, to an understatement of the effect of the preparatory classes on performance on the CAHSEE. See Technical Appendix A for a statistical description of the differences between the subsamples of students who took and did not take a CAHSEE preparatory class.
10 These students were enrolled in Transition Resources for Adult
Community Education (TRACE), a community-based program that helps young adults (18–22 years old) with disabilities to transition from public school to adult life as mandated by the Individuals with Disabilities Education Act (IDEA).
11 Technical Appendix A presents detailed tables showing the
number of non-graduates by category for each year.
12 These figures also show the differing trends in re-enrollment
and test taking between regular students and non-diploma-bound students. Although the percentage of regular students who re-enroll after one year form an increasing percentage in the classes from 2007 through 2009, non-diploma bound students also make up a large percentage of re-enrollments. The percentage is even more skewed when looking at two-year re-enrollments. It is clear that non-diploma bound students make up a large share of the students re-enrolling two years after grade 12. In contrast, diploma-bound students constitute the vast majority of the students who took and passed the CAHSEE one year after their senior year. Very few non-diploma-bound students took and passed the CAHSEE upon re-enrollment. This is not surprising given that CAHSEE is not a binding require-ment for these students who do not expect to receive a diploma. We also note that it is in some ways a misnomer to refer to these students “re-enrolling” after grade 12 because, for most, the norm is to remain in school up to age 22 to gain life skills.
13 Although we know of no study that tests whether
non-gradu-ates return to high school in greater numbers during recessions, Betts and McFarland (1995), using national data, show that community college enrollments rise sharply in recessions, but-tressing our argument that when young adults encounter weak labor markets they are more likely to invest their time in further education.
14 Our method of estimating the number of students who passed
because of an intervention varied by intervention. For AB 128, because we have an “intent to treat” estimate, we conclude that the percentage of the sample who failed in grade 10 and who later passed because of tutoring in grade 11 to be 100 percent times the increase in the probability of passage. For CAHSEE prep classes, we multiplied the predicted increase in the prob-ability of overall passage from taking any CAHSEE prep class by the number of grade-11 and -12 students actually taking a prep class, and we expressed this as a percentage of all those who had failed in grade 10. For AB 347, we multiplied the predicted increase in the probability of passing the CAHSEE within two years after graduation by the number of non-graduating grade-12 students, and we then expressed this number of affected stu-dents as a percentage of those who had yet to pass the CAHSEE at the end of grade 10.
15 Another way of stating our result is as a percentage of all grade
10 students. We find that the overall CAHSEE passage rate rises by 1 to 2 percent as a result of these three interventions.
16 Technical Appendix Figure B1 serves as a counterpart of
Figure 8, showing the probabilities of passing the CAHSEE by grade 12. Technical Appendix Table B1 provides details on the percentage of students in each of the predicted probability groups presented in Figures 8 and A4 in the technical appendix.
17 This pattern is not consistent with the possibility of mean
reversion. Mean reversion, in the present context, refers to the effects of statistical noise in testing, whereby students who have a low score one year will tend to move toward an average score the next year, while those with a high score will tend to move down toward the average score the next year. In such a situa-tion, students who have low achievement could experience large gains in the future, while students with high achievement could experience unusually small gains. This is not the pattern in San Diego, where a student who performs below average in the lower grades does even worse than expected on the exit exam several grades later. This implies that achievement gaps may be increas-ing as students get older.
18 The full set of variables used in the estimation of grade-2
and grade-3 models are as follows: an indicator for whether the student is female, as well as ethnicity identifiers, an English Learner identifier, elementary GPA in the given grade (2 or 3), percent of time absent from school, school ethnic composition variables, percent of students within the school on free lunch, and behavioral GPA, which is a variable ranging from 0 to 4 that averages teacher responses on the report card indicat-ing whether the student begins promptly, follows directions, exhibits self-discipline, and has good overall classroom behavior. Regression results are provided in Technical Appendix B.
We also estimated probit models which take into account the binary nature of the outcome, and results were similar. We made one important change to the models estimated for grades 2 and 3 compared to the models estimated for grades 4 through 9 by Zau and Betts (2008). The California Standards Test did not exist when these two cohorts of students were in grades 2 and 3. Although a state test did exist, it was somewhat different than the CST in focus. More important, the classes of 2006 and 2007 took grade-2 and grade-3 tests in an era before No Child Left Behind. In the NCLB era, state testing is taken much more seri-ously, with schools facing potential penalties unless virtually all students take the test. This means that test results are missing for a greater number of students who were in grades 2 and 3 before NCLB than in later years. For these reasons, in the grade 2 and 3 models we do not include test scores, relying instead on the academic GPA to capture student achievement.
The concern that the models are estimated using different cohorts than the previously discussed models is a valid one. However, the fit of predicted probabilities across all four cohorts used in the out-of-sample predictions suggests there was no significant shift in the characteristics of the student population across the four graduating classes. Hence, the fact that different groups of students are used to estimate models of success on the CAHSEE using grade-2 and grade-3 data is not likely to pose a significant problem. We also tried variants of these models that used the grade-2 and -3 Stanford 9 test results as explanatory variables. Results were similar to those we discuss in the text.
19 The sample of grade 2 students for whom we estimate the
grade 12 model is smaller than the sample for whom we estimate the grade 10 model because some students move away from the district between grades 10 and 12. To see if the difference in samples could explain the stronger predicted effects of EL status and race/ethnicity in the grade 10 forecasts, we repeated the grade 10 model with the subsample used for the grade 12 model. The results for the grade 10 model changed only slightly. We also compared grade 10 test scores and demographics of the sample of grade 2 students in the district in grades 10 and 12, and there were no major differences. Students who persisted until grade 12 had slightly higher achievement in grade 10 than the full sample of grade 10 students. Overall we conclude that differences in samples do not explain the differences between Figures 9 and 10.
20 Technical Appendix B shows the underlying regression results
as well as results when using grade 3 student data to forecast pass rates on the exit exam. The grade 3 results are similar. The most important difference is that being an English Learner in grade 3 is no longer a significant negative predictor of CAHSEE outcomes.
References
Betts, Julian R., and Laurel L. McFarland. 1995. “Safe Port in a Storm: The Impact of Labor Market Conditions on Community College Enrollments.” Journal of Human Resources 30 (4): 741–65. Davis, Michele R. 2012. “Data Tools Aim to Predict Student Performance: How Data Can Forecast Future Struggles or Success for Students.” Education Week, February 8.
Martorell, Paco, and Damon Clark. 2010. “The Signaling Value of a High School Diploma.” Working Paper # 557, Industrial Relations Section, Princeton University,.
Rose, Heather, and Julian R. Betts. 2004. “The Effect of High School Courses on Earnings.” Review of Economics and Statistics 86 (2): 497-513.
San Diego Unified School District. 2003–2010. Course of Study, K–12.
Warren, John Robert. 2007. State High School Exit Examinations for Graduating Classes since 1977.
Minneapolis: Minnesota Population Center. Available at www.hsee.umn.edu.
Zau, Andrew C., and Julian R. Betts. 2008. Predicting Success, Preventing Failure: An Investigation of the California High School Exit Exam. San Francisco: Public Policy Institute of California.
About the Authors
Julian R. Betts is an adjunct policy fellow and a Bren policy fellow at the Public Policy Institute of California. He is professor and former chair of economics at the University of California, San Diego, where he is executive director of the San Diego Education Research Alliance (sandera .ucsd.edu). He is also a research associate at the National Bureau of Economic Research and UC San Diego Campus director of the University of California Educational Evaluation Center. He has written extensively on the link between student outcomes and measures of school spending and studied the role that educational standards, accountability, teacher qualifications, and school choice play in student achievement. He has served on three National Academy of Sciences panels, the Consensus Panel of the National Charter School Research Project, and various advisory groups for the U.S. Department of Education. He is also principal investigator for the federally mandated National Evaluation of Magnet Schools. He holds a Ph.D. in economics from Queen’s University, Kingston, Ontario, Canada.
Andrew C. Zau is a senior statistician for the San Diego Education Research Alliance in the Department of Economics at the University of California, San Diego. Previously, he was a research associate at PPIC. Before that, he was a SAS programmer and research assistant at the Naval Health Research Center in San Diego, where he investigated the health consequences of military service in Operations Desert Shield and Desert Storm. He holds a B.S. in bioengineering from the University of California, San Diego, and an M.P.H. in epidemiology from San Diego State University.
Yendrick Zieleniak is a doctoral student in the Department of Economics, University of California San Diego. He is also a graduate student researcher at the University of California Education Evaluation Center.
Karen Volz Bachofer is the director of the San Diego Education Research Alliance in the Department of Economics at the University of California, San Diego (sandera.ucsd.edu). Previously she was the executive director of the San Diego Unified School District’s Research and Evaluation Division, where her responsibilities included oversight of national, state, and district assessment and accountability processes and reporting, including the CAHSEE; internal, external, and commissioned research and evaluation activities; and the development and roll-out of the district’s data management tool. She served as a member of California’s Academic Performance Index (API) Technical Design Group and the Advisory Committee for the national evaluation of Title I Accountability Systems and School Improvement Efforts (TASSIE). She holds a Ph.D. in Education from the Claremont Graduate School and San Diego State University.
Acknowledgments
We are grateful to the University of California Educational Evaluation Center, which provided funding for Yendrick Zieleniak’s work on this project. This research was conducted by members of the San Diego Education Research Alliance at UCSD (sandera.ucsd.edu). The report has benefited significantly from reviews by Hans Johnson, Paco Martorell, and Rick Miller. We thank Gary Bjork, Lynette Ubois, and Mary Severance for editorial assistance. Many more thanks especially to our SDUSD colleagues Ron Rode, Peter Bell, Dina Polichar, Linda Trousdale, and Marc Gottuso for many helpful conversations.
State of Califor nia
M A R K BA L DA SSA R E
President and CEO
Public Policy Institute of California
R U B E N BA R R A L E S
President and CEO
San Diego Regional Chamber of Commerce
M A R í A B L A N CO
Vice President, Civic Engagement California Community Foundation
B R I G I T T E B R E N
Chief Executive Officer
International Strategic Planning, Inc.
R O B E R T M . H E R T Z B E R G
Partner
Mayer Brown, LLP
D O N N A LU C A S
Chief Executive Officer Lucas Public Affairs
DAV I D M A S M A SU M OTO
Author and Farmer
S T E V E N A . M E R K SA M E R
Senior Partner
Nielsen, Merksamer, Parrinello, Gross & Leoni, LLP
K I M P O L E S E
Chairman ClearStreet, Inc.
T H O M A S C . SU T TO N
Retired Chairman and CEO Pacific Life Insurance Company
PPIC is a private operating foundation. It does not take or support positions on any ballot measures or on any local, state, or federal legislation, nor does it endorse, support, or oppose any political parties or candidates for public office. PPIC was established in 1994 with an endowment from William R. Hewlett.
© 2012 Public Policy Institute of California. All rights reserved. San Francisco, CA
Short sections of text, not to exceed three paragraphs, may be quoted without written permission provided that full attribution is given to the source and the above copyright notice is included.
Research publications reflect the views of the authors and do not necessarily reflect the views of the staff, officers, or Board of Directors of the Public Policy Institute of California.
Library of Congress Cataloging-in-Publication data are available for this publication. ISBN 978-1-58213-150-4
PU B L I C P O L I C y I N S T I T U T E O F C A L I F O R N I A
500 Washington Street, Suite 600 San Francisco, California 94111
Telephone 415.291.4400 Fax 415.291.4401
PPI C SAC R A M E N TO C E N T E R
Senator Office Building 1121 L Street, Suite 801 Sacramento, California 95814