Human capital in growth regressions:
how much difference does data quality make?
Angel de la Fuente*
Instituto de Análisis Económico (CSIC) and
Rafael Doménech Universidad de Valencia
January 2000
Abstract
We construct a revised version of the Barro and Lee (1996) data set for a sample of OECD countries using previously unexploited sources and following a heuristic approach to obtain plausible time profiles for attainment levels by removing sharp breaks in the data that seem to reflect changes in classification criteria. It is then shown that these revised data perform much better than the Barro and Lee (1996) or Nehru et al (1995) series in a number of growth specifications. We interpret these results as an indication that poor data quality may be behind counterintuitive findings in the recent literature on the (lack of) relationship between educational investment and growth. Using our preferred empirical specificaction, we also show that the contribution of TFP to cross-country productivity differentials is substantial and that its importance relative to differences in factor stocks increases over time.
______________________
* We gratefully acknowledge financial support from the European Fund for Regional Development, the Spanish Ministry of Education through CICYT grants SEC99-1189 and SEC99-0820 and the European TNR "Specialization vs. diversification: the microeconomics of regional development and the propagation of macroeconomic shocks in Europe." We thank José Emilio Boscá, Anna Borkowsky (Swiss Federal Statistical Office) and Gunilla Dahlen (Statistics Sweden) for their helpful comments and suggestions, and María Jesús Freire and Juan Antonio Duro for their helpful research assistance.
Correspondence to: Angel de la Fuente, Instituto de Análisis Económico, Campus de la Universidad Autónoma de Barcelona, 08193, Bellaterra, Barcelona. Tel: 93-580-6612. Fax: 93-580-1452. E-Mail address: [email protected]. or
Rafael Domenech, Departamento de Análisis Económico, Universidad de Valencia, Campus de los Naranjos, 46022 Valencia, Spain; email: [email protected]
1.- Introduction
Recent empirical investigations of the contribution of human capital accumulation to economic growth have often produced discouraging results. Educational variables frequently turn out to be insignificant or to have the "wrong" sign in growth regressions, particularly when these are estimated using first-differenced or panel specifications. The accumulation of such negative results in the recent literature has fueled a growing skepticism on the role of schooling in the growth process, and has even led some researchers (notably Pritchett (1995)) to seriously consider possible reasons why the contribution of educational investment to productivity growth may actually be negative.
In this paper we argue that counterintuitive results on human capital and growth may be due, at least in part, to deficiencies in the data or inadequacies of the econometric specification. When we compare the different studies in the recent empirical literature on human capital and growth, perhaps the clearest regularity we find is that results are typically much better when we focus on cross-section or pooled data estimates, and get considerably worse when we consider the results of first-differenced, fixed effects or
within specifications -- which rely more heavily on the time-series variation of the data.1 To put it in a
slightly different way, the data seem to be telling us that, controlling for other things, more educated countries do tend to be more productive than others, but that it is not true that productivity rises over time with human capital in the manner suggested by the cross-section profile.
This pattern of results, which is not unusual in panel data estimation,2 may reflect a number of (not
mutually exclusive) problems that have nothing to do with the ineffectiveness of educational investment. One possibility is measurement error. If human capital stocks have been measured with error (and, as we will argue below, we have every reason to believe this is the case), their first differences will be even less accurate than their levels, a fact that could explain their lack of significance in some of the relevant studies. A second possibility has to do with the trends of the human capital variables and the growth rate of output. Since productivity growth has declined over time while both enrollment rates and schooling levels rose sharply in the last decades (especially in developing countries), a negative sign on the human capital variable is not really surprising when we eliminate the cross-section variation of the data, but it may simply reflect the omission of some other factors that may account for the growth slowdown.
We provide some evidence that data deficiencies are at least partially responsible for the poor empirical performance of human capital indicators in growth equations. On the other hand, correcting in a simple way for a potential "trends problem" does not significantly affect the results in the OECD sample we consider when a production function specification is used, although we suspect this may change in a broader sample or with a convergence equation specification.
1 See among others Mankiw, Romer and Weil (1992), Knight, Loayza and Villanueva (1993), Benhabib and Spiegel
(1994), Barro and Lee (1994), Islam (1995), Caselli et al (1996) and Hamilton and Monteagudo (1998). De la Fuente (2000) surveys this literature.
The paper is organized as follows. In Section 2 we briefly review the available data on educational attainment levels and document some of the problems they display. In Section 3 we describe the construction of new schooling series for a sample of 21 OECD countries. These series are essentially a revised version of (a subset of) Barro and Lee's (1996) data set that incorporates a greater amount of national information than the original series and tries to avoid implausible breaks in the data by correcting for what appear to be changes in classification criteria. We focus on the OECD in part for reasons of data availability and in part because this is the sample for which Mankiw, Romer and Weil (MRW 1992) find
weakest support for their human capital-augmented Solow model.3 In Section 4 we show that our revised
data perform much better than Barro and Lee's (1996) or Nehru et al's (1995) series in a number of fairly standard growth accounting specifications. Our best results are obtained with a specification in first differences that allows for a technological catch-up effect following de la Fuente (1996). We use this model to explore the relative importance of total factor productivity (TFP) and factor stocks as sources of cross-country productivity differences and find that the contribution of the first factor is substantial and increasing over time. Section 5 concludes.
2.- International data on educational attainment: a brief survey and some worrisome features
The basic source of schooling data is a diverse set of indicators provided by national agencies on the basis of population censuses and educational and labour force surveys. Various international organizations collect this information and compile comparative statistics that provide easily accessible and (supposedly) homogeneous information for a large number of countries. Perhaps the most comprehensive regular source
of international educational statistics is UNESCO's Statistical Yearbook. This publication provides
reasonably complete yearly time series on school enrollment rates by level of education for most countries in the world and contains some data on the educational attainment of the adult population, government expenditures on education, teacher/pupil ratios and other variables of interest. Other UNESCO publications contain additional information on educational stocks and flows and some convenient
compilations. Other useful sources include the UN's Demographic Yearbook, which also reports educational
attainment levels by age group and the IMF's Government Finance Statistics, which provides data on public
expenditures on education. Finally, the OECD also compiles educational statistics both for its member states (e.g. OECD (1995)) and occasionally for larger groups of countries.
The UNESCO enrollment series have been used in a large number of empirical studies of the link between education and productivity. In many cases this choice reflects the easy availability and broad coverage of these data rather than their theoretical suitability for the purpose of the study. Enrollment rates can probably be considered an acceptable, although imperfect, proxy for the flow of educational investment. On the other hand, these variables are not necessarily a good indicator of the existing stock of human capital since average educational attainment (which is often the more interesting variable from a theoretical point of view) responds to investment flows only gradually and with a very considerable lag.
In an attempt to remedy these shortcomings, a number of researchers have constructed data sets that attempt to measure directly the educational stock embodied in the population or labour force of large samples of countries. One of the earliest attempts in this direction is due to Psacharopoulos and Arriagada (PA, 1986) who, drawing on earlier work by Kaneko (1986), report data on the educational composition of the labour force in 99 countries and provide estimates of the average years of schooling. In most cases, however, PA provide only one observation per country.
More recently, there have been various attempts to construct more complete data sets on educational attainment that provide broader temporal coverage and can therefore be used in growth accounting and other empirical exercises. This requires panel data for as many countries and years as possible.
2.1. Educational data bases: coverage and construction
The existing data sets on educational attainment have been constructed by combining the available data on attainment levels with the UNESCO enrollment figures to obtain series of average years of schooling and the educational composition of the population or labour force. Enrollment data are transformed into attainment figures through a perpetual inventory method or some short-cut procedure that attempts to approximate it. We are aware of the following studies:
• Kyriacou (1991) provides estimates of the average years of schooling of the labour force (h) for a sample
of 111 countries. His data cover the period 1965-1985 at five-year intervals. He uses UNESCO data and
PA's attainment figures to estimate an equation linking h to lagged enrollment rates. This equation is then
used to construct an estimate of h for other years and countries.
• Lau, Jamison and Louat (1991) and Lau, Bhalla and Louat (1991). These studies use a perpetual inventory method and annual data on enrollment rates to construct estimates of attainment levels for the working-age population. Their perpetual inventory method uses age-specific survival rates constructed for representative countries in each region but does not seem to correct enrollment rates for dropouts or repeaters. "Early" school enrollment rates are estimates constructed through backward extrapolation of post-1960 figures. They do not use or benchmark against available census figures.
• Barro and Lee (B&L 1993) construct education indicators combining census data and enrollment rates. To estimate attainment levels in years for which census data are not available, they use a combination of interpolation between available census observations (where possible) and a perpetual inventory method that can be used to estimate changes from nearby (either forward or backward) benchmark observations.
Their version of the perpetual inventory method makes use of data on gross enrollments4 and the age
composition of the population (to estimate survival rates). The data set contains observations for 129 countries and covers the period 1960-85 at five-year intervals. Besides the average years of education of the population over 25, Barro and Lee report information on the fraction of the (male and female) population
4 The gross enrollment rate is defined as the ratio between the total number of students enrolled in a given
educational level and the size of the population which, according to its age, "should" be enrolled in the course. The net enrollment rate is defined in an analogous manner but counting only those students who belong to the relevant age group. Hence, older students (typically repeaters) are excluded in this second case.
that has reached and completed each educational level. In a more recent paper (B&L, 1996), the same authors present an update of their previous work. The revised database, which is constructed following the same procedure as the previous one (except for the use of net rather than gross enrollment rates), extends the attainment series up to 1990, provides data for the population over 15 years of age and incorporates some new information on quality indicators such as the pupil/teacher ratio, public educational expenditures per student and the length of the school year.
• Nehru, Swanson and Dubey (NSD 1995) follow roughly the same procedure as Lau, Jamison and Louat (1991) but introduce several improvements. The first one is that Nehru et al collect a fair amount of enrollment data prior to 1960 and do not therefore need to rely as much on the backward extrapolation of enrollment rates. Secondly, they make some adjustment for grade repetition and drop-outs using the limited information available on these variables.
We can divide these studies into two groups according to whether they make use of both census attainment data and enrollment series or only the latter. The first set of papers (Kyriacou and Barro and Lee) relies on census figures where available and then uses enrollment data to fill in the missing values. Kyriacou's is the least sophisticated of the two studies. This author uses a simple regression of educational stocks on lagged flows to estimate the unavailable levels of schooling. This procedure is valid only when the relationship between these two variables is stable over time and across countries, which seems unlikely although it may not be a bad rough approximation, particularly within groups of countries with similar population age structures. In principle, Barro and Lee's procedure should be superior to Kyriacou's because it makes use of more information and does not rely on such strong implicit assumptions. In addition, these authors also choose their method for filling in missing observations on the basis of an accuracy test based on a sample of 30 countries for which relatively complete census data are available.
The second group of papers (Louat et al and Nehru et al) uses only enrollment data to construct time series of educational attainment. The version of the perpetual inventory method used in these studies is a bit more sophisticated than the one in Barro and Lee, particularly in the case of Nehru et al. Both Nehru et al and Louat et al use estimates of age-specific survival probabilities constructed for a representative country in each region. This procedure should be more accurate than Barro and Lee's rough estimate of survival probabilities (which is not really age-specific and therefore can bias the results if attainment levels differ significantly across age groups, as seems likely). Unlike Barro and Lee (1993), Nehru et al also make a potentially important correction for repeaters and drop-outs using (limited) country-specific information
on these variables.5 On the other hand, these studies completely ignore census data on attainment levels.
To justify this decision, Nehru et al observe that census publications typically do not report the actual years of schooling of individuals (only whether or not they have completed a certain level of education and/or whether they have started it) and often provide information only for the population aged 25 and over. As a result, there will be some arbitrariness in estimates of average years of schooling based on this data and the
omission of the younger segments of the population may bias the results, particularly in LDCs, where this age group is typically very large and much more educated than older cohorts. While this is certainly true and may call for some adjustment of the census figures on the basis of other sources, in our opinion it hardly justifies discarding the only direct information available on the variables of interest.
2.2. A closer look at the OECD data
Methodological differences across different studies would be of relatively little concern if they all gave us a consistent and reasonable picture of educational attainment levels across countries and their evolution over time. As we will see presently, this is not the case. Different sources show very significant variations in terms of the relative positions of different countries. Although the various studies generally coincide when comparisons are made across broad regions (e.g. the OECD vs. LDCs in various geographical areas), the discrepancies are very important when we focus on the group of industrialized countries. Another cause for concern is that practically all available data on educational stocks and flows, including UNESCO's enrollment series, present anomalies which, to some extent, raise doubts about their accuracy and consistency. In particular, the schooling levels reported for some countries do not seem very plausible, while others display extremely large changes in attainment levels over periods as short as five years
(particularly at the secondary and tertiary levels) or extremely suspicious trends.6
To illustrate these problems and to get some feeling for the overall reasonableness of the existing data, in this section we will take a closer look at the most sophisticated data sets within each of the groups of studies identified in the previous section -- i.e. the Barro and Lee (B&L 1996) and Nehru et al (NSD 1995) data sets. As in the empirical section of the paper, we will concentrate on a sample of OECD countries. One of the main reasons for this choice is that educational statistics for this set of advanced industrial nations are presumably of decent quality. Any deficiencies we find in them are likely to be compounded in the case of poorer countries.
The degree of consistency between the various sources varies a lot depending on the level of aggregation we consider. Table 1, taken from NSD (1995), shows that the overall correlation (computed over common observations) of the different estimates is reasonably high. The correlation between the B&L and NSD figures over the whole sample, for example, stands at a respectable 0.81. An examination of average figures over different geographic regions and over time also reveals a fairly consistent and reasonable pattern. Industrialized countries and socialist economies display much higher attainment rates than less developed countries. Within this last group, Africa lies at the bottom, while Latin America does fairly well and Southeast Asia presents the largest improvement over the period.
Table 1: Correlation among alternative estimates of avge. schooling _________________________________________________________
NSD PA BL Kyr
Nehru et al (NSD) 1
Psch. and Arr. (PA) 0.84 1
Barro and Lee (B&L 93) 0.81 0.92 1
Kyriacou (Kyr) 0.89 0.86 0.89 1
_________________________________________________________ - Source: Nehru et al (1995).
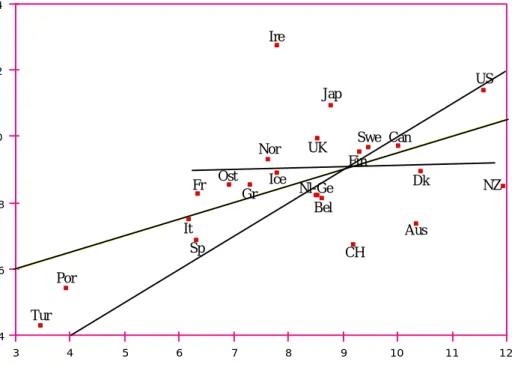
Figure 1: Average years of schooling in1985: B&L (1996) vs NSD
3 4 5 6 7 8 9 10 11 12 4 6 8 10 12 14 Tur Por Ire Sp It US NZ CH Aus Dk Can Jap Fr Ost Nor Gr Ice Bel Nl-Ge UK Swe Fin
Barro and Lee (1996) Nehru et al
Notes:
- The estimates refer to the population over 15 in the case of Barro and Lee and to the age group 15-64 in Nehru et al. - The estimated equation is of the form h.nsd = 4.50 + 0.503 h.b&l, t = 3.21, R2 = 0.329. The flatter line in the figure is the regression line fitted after excluding the four countries with the lower schooling levels. The thinest and steepest line is the "diagonal", where all the observations would fall if both sources agreed.
- Legend: Tu = Turkey; Por = Portugal; CH = Switzerland; Sp = Spain; Aus = Australia; It = Italy; Be = Belgium; Ge = West Germany; Nl = Netherlands; Fr = France; NZ = New Zealand; Gr = Greece; Ost = Austria; Is = Iceland; Dk = Denmark; Nor = Norway; Fin = Finland; Swe = Sweden; Can = Canada; UK = United Kingdom; Jap = Japan; USA = United States; Ir = Ireland.
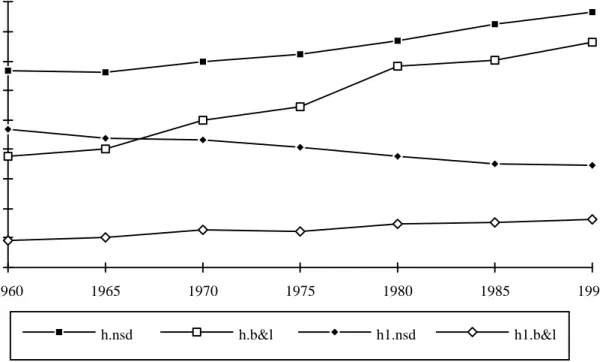
Figure 2: Average years of schooling by level in the OECD: B&L (1996) vs. NSD 4,5 5 5,5 6 6,5 7 7,5 8 8,5 9 1960 1965 1970 1975 1980 1985 1990 h.nsd h.b&l h1.nsd h1.b&l 0 0,5 1 1,5 2 2,5 3 1960 1965 1970 1975 1980 1985 1990 h2.nsd h2.b&l h3.nsd h3.b&l Notes:
- Unweighted averages over the available OECD countries. Neither source reports data for Luxembourg. The sample excludes New Zealand except for average total years of schooling, as NSD only provide data on this variable but not its breakdown by level.
- The data are for the age group 15-64 in the case of NSD and for the population aged 15 and over in Barro and Lee (1996).
This high overall correlation, however, hides significant discrepancies between the two data sets, both over time and across countries. Figure 1 shows B&L's (1996) and NSD's estimates of the average years of total schooling of the population over 15 for OECD countries in 1985. The correlation for the 23 countries (there are no data for Luxembourg) is now 0.574, but when we exclude the four countries with the lowest levels of schooling in the sample, the correlation drops to zero (0.063). When we disaggregate, the correlation is fairly high at the university level (0.767) and much lower for primary (0.362) and secondary (0.397) attainment.
Figure 2 shows the evolution of the average years of total schooling (h) in the average OECD country
and their breakdown by levels (h1, h2 and h3) according to the same two sources (B&L vs NSD). If we
focus on average years of total schooling, both data sets display an increasing trend, although it is much more marked in the case of B&L. In terms of their levels, NSD's figures on average attainment are significantly higher, although the difference between the two sets of estimates diminishes over time and becomes minor towards the end of the period. In principle, this discrepancy may be due at least in part to the difference between the age groups considered in the two studies. While B&L focus on the population aged 15 and over, NSD attempt to measure the educational attainment of the 15 to 64 age group. Since the older cohorts included in the B&L sample and excluded by NSD are typically less educated than the rest of the population, we would expect Barro and Lee's attainment estimates to be somewhat lower than Nehru et al's.
Significant differences between the two sources emerge when we disaggregate by educational level. In terms of secondary schooling the trend is quite similar in both cases but NSD's estimates are, unexpectedly, lower on average than B&L's. At the primary level, NSD's attainment figures are implausibly high, exceeding the duration of this school cycle (which is around six years on average), and display a downward trend. This "finding" that primary schooling levels have decreased over time in industrial countries is extremely suspicious, for it implies that new entrants into the labour force have less primary schooling than the older generations -- in spite of the rapid increase of enrollment rates over the period.
For OECD countries we have some alternative sources that can be used to assess the likely accuracy of the B&L and NSD series. In particular, the OECD has published some reasonably complete educational statistics for most of its member countries. Although these data refer only to the last few years, and are not therefore an alternative to the other sources for the statistical analysis of the impact of education on growth, a comparison of the three sets of figures may perhaps give us some clues as to the possible shortcomings of the B&L and NSD data sets.
Table 2 summarizes the most relevant data. Notice that although both the year and the age groups differ somewhat across the three sources (see the notes to the table), the figures should be roughly comparable. The breakdown by educational level is also comparable with the one used by Barro and Lee (1996), although the OECD provides more detail. In particular, they disaggregate secondary attainment into two levels and, for most countries, report figures on advanced vocational programmes (ISCED5 level) separately.
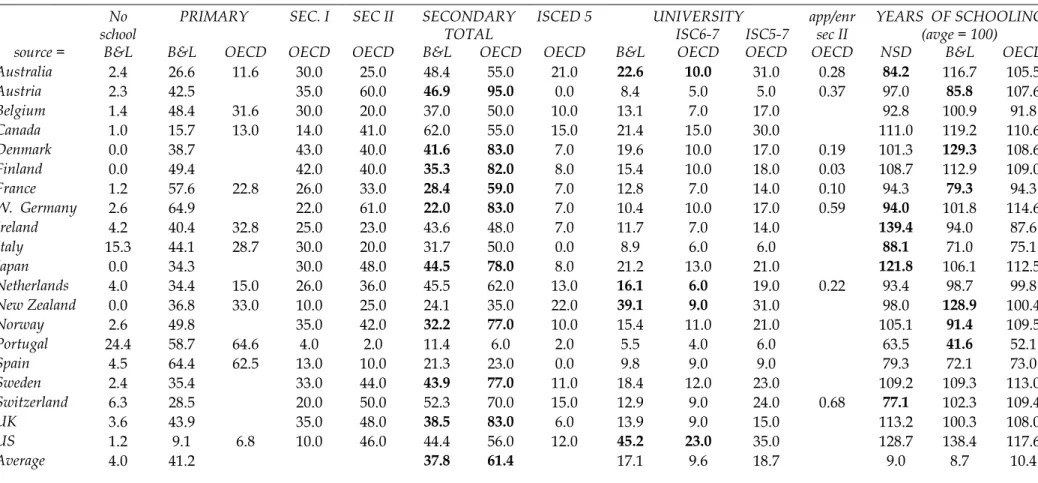
Table 2: B&L (1996) and NSD vs. OECD (EAG), Educational attainment of the adult population
___________________________________________________________________________________________________________________________________________ No
school PRIMARY SEC. I SEC II SECONDARYTOTAL ISCED 5 ISC6-7 ISC5-7UNIVERSITY app/enrsec II YEARS OF SCHOOLING(avge = 100)
source = B&L B&L OECD OECD OECD B&L OECD OECD B&L OECD OECD OECD NSD B&L OECD
Australia 2.4 26.6 11.6 30.0 25.0 48.4 55.0 21.0 22.6 10.0 31.0 0.28 84.2 116.7 105.5 Austria 2.3 42.5 35.0 60.0 46.9 95.0 0.0 8.4 5.0 5.0 0.37 97.0 85.8 107.6 Belgium 1.4 48.4 31.6 30.0 20.0 37.0 50.0 10.0 13.1 7.0 17.0 92.8 100.9 91.8 Canada 1.0 15.7 13.0 14.0 41.0 62.0 55.0 15.0 21.4 15.0 30.0 111.0 119.2 110.6 Denmark 0.0 38.7 43.0 40.0 41.6 83.0 7.0 19.6 10.0 17.0 0.19 101.3 129.3 108.6 Finland 0.0 49.4 42.0 40.0 35.3 82.0 8.0 15.4 10.0 18.0 0.03 108.7 112.9 109.0 France 1.2 57.6 22.8 26.0 33.0 28.4 59.0 7.0 12.8 7.0 14.0 0.10 94.3 79.3 94.3 W. Germany 2.6 64.9 22.0 61.0 22.0 83.0 7.0 10.4 10.0 17.0 0.59 94.0 101.8 114.6 Ireland 4.2 40.4 32.8 25.0 23.0 43.6 48.0 7.0 11.7 7.0 14.0 139.4 94.0 87.6 Italy 15.3 44.1 28.7 30.0 20.0 31.7 50.0 0.0 8.9 6.0 6.0 88.1 71.0 75.1 Japan 0.0 34.3 30.0 48.0 44.5 78.0 8.0 21.2 13.0 21.0 121.8 106.1 112.5 Netherlands 4.0 34.4 15.0 26.0 36.0 45.5 62.0 13.0 16.1 6.0 19.0 0.22 93.4 98.7 99.8 New Zealand 0.0 36.8 33.0 10.0 25.0 24.1 35.0 22.0 39.1 9.0 31.0 98.0 128.9 100.4 Norway 2.6 49.8 35.0 42.0 32.2 77.0 10.0 15.4 11.0 21.0 105.1 91.4 109.5 Portugal 24.4 58.7 64.6 4.0 2.0 11.4 6.0 2.0 5.5 4.0 6.0 63.5 41.6 52.1 Spain 4.5 64.4 62.5 13.0 10.0 21.3 23.0 0.0 9.8 9.0 9.0 79.3 72.1 73.0 Sweden 2.4 35.4 33.0 44.0 43.9 77.0 11.0 18.4 12.0 23.0 109.2 109.3 113.0 Switzerland 6.3 28.5 20.0 50.0 52.3 70.0 15.0 12.9 9.0 24.0 0.68 77.1 102.3 109.4 UK 3.6 43.9 35.0 48.0 38.5 83.0 6.0 13.9 9.0 15.0 113.2 100.3 108.0 US 1.2 9.1 6.8 10.0 46.0 44.4 56.0 12.0 45.2 23.0 35.0 128.7 138.4 117.6 Average 4.0 41.2 37.8 61.4 17.1 9.6 18.7 9.0 8.7 10.4 ___________________________________________________________________________________________________________________________________________ - Notes: Attainment is measured by the fraction of the adult population which has started (but not necessarily completed) each educational level.
- Dates and population groups vary as follows: Barro and Lee: 1990 and population aged 25 and over; NSD: 1987 and population aged 15-64; OECD: 1989 and population aged 25-64.
- The OECD includes apprenticeships programmes as part of secondary (2nd cycle) studies. Level 5 of the international standard classification for education, ISCED 5, includes relatively short post-secondary programmes which do not lead to a university degree. These are generally advanced vocational prgrammes. University programmes are included in levels 6 and 7 of ISCED. In some countries which do not report data at the ISCED5 level, these programmes are counted either at the university level or as part of secondary-level vocational programmes.
The differences across the various sources are quite significant. On the whole, the picture which emerges from the OECD figures seems to be the more plausible one -- at least in the sense of conforming better to common perceptions as to the relative educational levels of different countries. As for the other two sources, both contain rather implausible features and it is difficult to choose between them. Starting with the relative positions of different countries in terms of average total schooling (reported in the last
three columns of the table),7 we find a number of large discrepancies. Barro and Lee's estimates for
Austria, France, Norway and Portugal are much lower than those given in the other sources, while their figure for New Zealand is much higher. On the other hand, NSD give very low figures for Australia, Switzerland and Germany, an extremely high estimate for Ireland (which is probably an error) and an
implausibly high number for Greece.8 The overall correlation with the OECD estimates is higher for Barro
and Lee (0.807) than for NSD (0.531) but this is due to a large extent to the Irish outlier.
In the case of Barro and Lee it is possible to make a detailed comparison by levels of schooling with the OECD data that may give us some clues as to the likely sources of some of their more implausible results.
We observe that OECD estimates of secondary attainment are generally higher than Barro and Lee's.9 The
difference exceeds forty points in Austria, Germany, Finland, Denmark, Norway and the UK, and are quite important for a number of other European countries and for Japan. We think the main reason for the difference has to do with the treatment of apprenticeships and other vocational training programmes, which are included in the OECD data but probably not counted by Barro and Lee. Differences in tertiary attainment are significant as well and also seem to be related to the treatment of (higher-level) vocational programmes. In particular, Barro and Lee seem to report ISCED5 studies as part of university schooling but, even accounting for this, significant differences remain in some cases.
Turning from the cross-section to the time-series dimension of the data, another disturbing feature of the human capital series is the existence of sharp breaks and implausible changes in attainment levels over very short periods. This problem affects the B&L data set much more than the NSD series, which are much smoother essentially by construction. Figures 3 and 4 below show the evolution of Barro and Lee's (1996) secondary and university attainment rates for the population over 25 in a number of countries that display
7To estimate the average years of schooling on the basis of the OECD data we have used the following durations:
Primary, 6 years; Secondary I, 9 years; Secondary II, 12 years; ISCED 5, 14 years; ISCED 6 and 7, 16 years. Since the computation assumes that everybody who started a certain level has completed it, the resulting figures should overstate the true years of schooling but, hopefully, not so much the relative positions of the different countries, which is what we are trying to get at. Our comparisons are based on the standardized attainment figures shown in Table 2, which are constructed by normalizing each estimate of the average years of schooling by the unweighted average of the available contemporaneous observations in each data set.
8 According to NSD the average years of primary schooling in Ireland ranged between 15 in 1960 and just over 11 in
1985. Both figures are much higher than those for any other country and of the order of twice the duration of this level of schooling. Greece does not appear in Table 2 because the OECD reports no data for this country. Greece is ranked by NSD ahead of Switzerland, Australia, Belgium, the Netherlands and France.
9Original OECD figures add up to 100% when we sum primary, secondary and tertirary attainment rates. Since this
extremely suspicious patterns. In all cases, the sharp break in the series signals in all probability a change of criterion in the elaboration of educational statistics. Similar inconsistencies are present in other countries as well.
Figure 3: Evolution of university attainment levels, Australia, New Zealand and Canada
0 5 10 15 20 25 30 35 40 60 65 70 75 80 85 90 Aus NZ Can
- Source: Barro and Lee (1996). Population aged 25 and over.
Figure 4: Evolution of secondary attainment levels, Netherlands, New Zealand and Canada
0 10 20 30 40 50 60 70 60 65 70 75 80 85 90 Can NZ Nl
- Source: Barro and Lee (1996). Population aged 25 and over.
The preceding discussion is far from providing an exhaustive list of the suspect features of different educational data sets. On the other hand, it is probably enough to conclude that --despite the fact that recent contributions represent a significant advance in this area-- the available data on human
capital stocks are still of dubious quality. Remaining problems are probably due in part to the fact that the primary statistics used in these studies are not consistent, across countries or over time, in their treatment
of vocational and technical training and other courses of study,10 and reflect at times the number of people who have started a certain level of education and, at others, those who have completed it. Additional problems may be traced to the procedure used in the construction of the data and even to computational mistakes. Thus, NSDs neglect of census data probably accounts for their unreasonable results in terms of the overall level and trend of primary and secondary schooling while Barro and Lee´s approximation to a perpetual inventory method is probably far from satisfactory. Hence, a fair amount of detailed work remains to be done before we can say with some confidence that we have a reliable and detailed picture of worldwide educational achievement levels or their evolution over time.
To some extent, doubts about the accuracy of existing data sets must raise concerns about the validity of the findings of empirical studies based on them. Concerns about data quality, however, also admit an optimistic interpretation of these results. Since there are no reasons to suspect that the available data contain systematic biases that may lead us to overestimate the contribution of human capital to productivity, the fact that the empirical results are quite favourable in some cases in spite of the dubious quality of the data suggest that improvements in this regard should lead to clearer and more conclusive results about education's contribution to economic growth. We will provide some evidence in this direction below.
3. Educational attainment in the OECD: A revised set of estimates for 1960-90
On the basis of our discussion so far we would tentatively conclude that the Barro and Lee (1996) series are probably the best available source on human capital stocks. As we have seen, however, even these data contain a large amount of noise that can be traced largely to inconsistencies of the underlying primary statistics. Trying to reduce this noise, we have constructed a revised version of the Barro and Lee data set
for a sample of 21 OECD countries for the period 1960-90.11
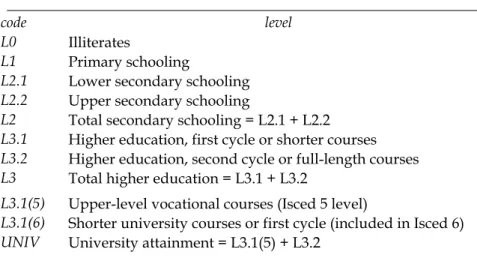
We aim to provide estimates of the fraction of the population aged 25 and over that has started (but not necessarily completed) each of the levels of education shown in the upper block of Table 3 (illiterates (L0), primary schooling (L1), lower and upper secondary schooling (L2.1 and L2.2) and two levels of higher education (L3.1 and L3.2)). For some countries, however, the available data may refer to a different age group or to the fraction of the population that has completed each schooling level, and it is not always possible to detect when this is the case.
We have tried to include upper-level vocational courses (ISCED 5 studies according to the international standard classification of educational attainment levels, L3.1(5) in our notation) in the first level of higher attainment. For some countries the data is detailed enough to allow us to identify this category separately
10Steedman (1996) documents the existence of important inconsistencies in the way educational data are collected in
different countries and argues that this problem can significantly distort the measurement of educational levels. She notes, for example, that countries differ in the extent to which they report qualifications not issued directly (or at least recognized) by the state and that practices differ as to the classification of courses which may be considered borderline between different ISCED levels. The stringency of the requirements for the granting of various completion degrees also seems to vary significantly across countries.
and to recover a narrower, strictly university attainment category (UNIV).12 We report L0 only for the four countries where illiteracy rates are significant during the sample period (Portugal, Greece, Spain and Italy). For the rest of the sample, the lowest reported category is L1, and it includes all those who have not reached secondary school.
Table 3: Attainment levels and codes
________________________________________________________________
code level
L0 Illiterates
L1 Primary schooling
L2.1 Lower secondary schooling
L2.2 Upper secondary schooling
L2 Total secondary schooling = L2.1 + L2.2
L3.1 Higher education, first cycle or shorter courses
L3.2 Higher education, second cycle or full-length courses
L3 Total higher education = L3.1 + L3.2
L3.1(5) Upper-level vocational courses (Isced 5 level)
L3.1(6) Shorter university courses or first cycle (included in Isced 6)
UNIV University attainment = L3.1(5) + L3.2
_________________________________________________________
Our approach has been to collect all the information we could find on educational attainment in each country, both from international publications and from national sources (census and survey results and national statistical yearbooks), and use it to try to reconstruct a plausible pattern, reinterpreting some of
the data if necessary.13 For those countries for which reasonably complete series are available, we have
relied primarily on national sources. For many of the rest, we start from the most plausible set of attainment estimates available around 1990 (taken generally from OECD sources) and proceed backwards using all the assembled information and trying to avoid unreasonable jumps in the series by choosing the most plausible figure when several are available for the same year, and by reinterpreting some of the data (as referring to broader or narrower schooling categories than the reported one) when it seems sensible to do so. Missing observations are then filled in a variety of ways. Where possible, we interpolate between available observations. Otherwise, we use information on educational attainment by age group in order to make backward projections, or rely on miscellaneous information from a variety of sources in order to construct plausible estimates of attainment levels. We have avoided the use of flow estimates based on enrollment data because they seem to produce implausible time profiles.
Clearly, the construction of our series involves a fair amount of guesswork. Our "methodology" looks decidedly less scientific than the apparently more systematic estimation procedures used by other authors starting from supposedly homogeneous data. As discussed in the previous section, however, even a cursory examination of the data shows that there is no such homogeneity. Hence, we have found it preferable to rely on judgment to try to piece together the available information in a coherent manner than
12We do not report this finer data except in the case of Canada, where our figures for L3 incorporate a tentative
estimate of Isced 5 courses that the user may want to change.
13We would greatly welcome any additional information that may help us improve the quality of our estimates,
to take for granted the accuracy of the primary data. The results do, as we will see, look more plausible than the existing series, at least in terms of their time profile.
3.1.- An example: the case of higher education in Canada
To give the reader a flavour for the way our series have been constructed, we will discuss in detail the case of higher education in Canada. This is a country for which there is a considerable amount of information that displays, if taken literally, a rather implausible pattern. It is also one case in which we can partially check the reasonableness of our corrections for part of the sample period against an apparently homogeneous national source for an age group slightly different from our target.
Figure 5: University attainment in Canada, Barro and Lee (1996) vs. this paper
0 5 10 15 20 25 30 35 40 45 50 1960 1965 1970 1975 1980 1985 1990
B&L L3 UNIV Stat Can
The essence of our approach is captured by Figure 5. The thicker line in the Figure describes Barro and Lee's (1996) higher educational attainment series for the population aged 25 and over, which is based on Unesco and UN data. The implausible hump-shaped pattern of the series strongly suggests that the 1975 and 1980 observations refer to a broader concept of higher attainment than the rest of the data. Our guess is that, unlike the rest, these two atypical observations include upper-level vocational training courses. If we homogenize the series by consistently including or excluding an estimate of this category, we get the more plausible profile described by the two thinner lines shown in the figure. The higher of these lines refers to higher education in a broad sense, and the lower one to strictly university attainment. The dots lying on these two lines represent actual data taken from various sources and attributed to the exact year to which they correspond (and not to the closest multiple of five). For the rest of the years, we complete the series through linear interpolation.
Table 4: Available data and higher attainment estimates, Canada
__________________________________________________________________________________________
source rep. level 1960 1965 1970 1975 1976 1980 1981 1985 1986 1990 1991 1992
OECD L3.1 15 23 26,1 OECD L3.2 15 17 15 Unesco L3 13,1 17,8 31,15 37,4 19,3 21,4 DY L3 6,5 16 17,3 19,3 19,3 21,4 census L3.1 10,4 11,7 census L3.2 11,5 13,4 Stat Can L3.1 24,14 27,65 30,19 31,74 Stat Can L3.2 6,43 8,01 9,57 11,36 estimates 1960 1965 1970 1975 1976 1980 1981 1985 1986 1990 1991 1992 L3 25,03 26,88 28,73 30,75 31,15 36,15 37,40 38,75 39,08 40,43 40,76 41,10 L3.1(5) 11,93 12,82 13,70 14,66 14,85 18,65 19,60 19,75 19,78 19,45 19,36 L3.1(6) 6,60 6,87 7,14 7,49 7,56 8,20 8,36 9,01 9,17 9,81 9,98 L3.1.(5+6) 26,10 L3.2 6,50 7,20 7,90 8,60 8,74 9,30 9,44 9,99 10,13 11,17 11,42 15,00 UNIV = L3.1(6)+L3.2 13,10 14,07 15,03 16,00 16,30 17,50 17,80 19,00 19,30 20,98 21,40 __________________________________________________________________________________________ The details of the reconstruction are unavoidably messy. Table 4 contains the available primary data and our reconstructed series, with bold characters used to highlight the information we have selected to construct our estimates. The upper half of the Table summarizes the university attainment data we have found for Canada. The sources are various OECD publications (generally for the age group 25-64),
UNESCO's Statistical Yearbook and the UN's Demographic Yearbook (for the population over 25), national
census reports and the website of Statistics Canada (for the population over 15). Unesco and the
Demographic Yearbook (DYB) report university attainment as a whole (L3), while national sources distinguish between shorter and longer college-level courses (L3.1 and L3.2). The longer available series, provided by Unesco and the UN, show considerable discrepancies in some years and (especially in the case of Unesco) display a rather implausible pattern that strongly suggests changes in classification criteria.
Using these data, we have constructed the estimates shown in the lower part of the table. Since we suspect changes in the classification of upper level vocational courses are behind the jumps in the data, we distinguish between short university courses (L3.1(6)) and advanced vocational training (L3.1(5)) and consider various combinations of the three possible categories that comprise higher education: L3 includes all three of them, while UNIV = L3.1(6) + L3.2 includes only strictly university courses, excluding vocational training.
Using this finer breakdown, we construct our estimates essentially by trying to guess to which of the possible attainment categories the available data refer. We interpret Unesco's 1960, 1986 and 1991 observations, and the DYB observation for 1975 as referring to university attainment in the narrow sense (i.e. excluding ISCED 5 courses). We complete the series for this attainment level by interpolating between available observations. Next, we would like to break down university attainment into its upper (L3.2) and lower (L3.1(6)) cycles. For this, we interpret the 1960 DYB figure as referring to L3.2 and estimate L3.2 in 1986 and 1991 by applying the ratio L3.2/UNIV computed using the census data (which refers to the
population over 15) to our previous estimate of UNIV. To complete the L3.2 and L3.1(6) series we then interpolate between these three observations.
Finally, we need to estimate the level of attainment in advanced vocational programmes and add it to UNIV to obtain total higher attainment (L3). We observe that Unesco gives extremely high figures for university attainment in 1976 and 1981 that we interpret as estimates of L3 (i.e. assume that they include L3.1(5)). For 1992, OECD (1995) gives a L3 figure that seems compatible with the previous ones. We interpolate L3 between 1981 and 1992 and estimate L3.1(5) as L3 - UNIV, using our previous estimates of these two levels for 1976 onward. To take L3 and L3.1(5) back from 1976, we assume that the ratio UNIV/L3 remains constant at its 1976 value. The estimates constructed in this way seem to fit fairly well with the figures reported in the Statistics Canada website (for 1976 onward and for the population 15+) if we assume that the L3.1 reported in this source includes ISCED 5 courses). These data correspond to the unconnected round dots lying close to the upper line in Figure 5.
3.2.- Some comments on the estimation procedure and data quality
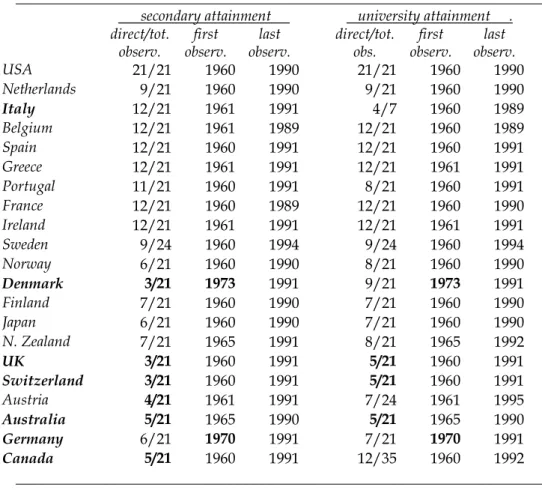
A similar approach has been followed for the remainder of the sample, as discussed in the detailed country notes contained in the Appendix. Data availability varies widely across countries. Table 5 shows the fraction of the reported data points that are taken from direct observations and the earliest and latest such observations available for secondary and higher attainment levels. The number of possible observations is typically 21 for each level of schooling (two sublevels and a total times seven quinquennial observations), but it may be larger if the data allow a finer breakdown by sublevel (as in the case of Canada) or if there is no data close to 1990 and we use observations for around 1995 to complete the series (in which case there is one more time period to consider). In the case of Italy, there seem to be no short higher education courses, so the number of possible observations at the university level drops to seven. We count as direct observations backward projections constructed using detailed census data on educational attainment by age group and the age structure of the population.
As can be seen in the table, for around two thirds of the countries we have enough primary information to reconstruct reasonable attainment series covering the whole sample period. The more problematic cases are higlighted using bold characters. In the case of Italy, the main problem is that most of the available information refers to the population over six years of age. We are currently exploring ways to correct the likely bias using data on enrollments and the age structure of the population. For Germany and Denmark, the earliest available direct observation refers to 1970 or later. We have projected attainment rates backward to 1960 using the attainment growth rates reported in OECD (1974), but we are unsure of the reliability of this extrapolation. Finally, the number of available observations is rather small in the cases of Australia, the UK and Switzerland.
Table 5: Some summary measures of data quality
______________________________________________________________________
secondary attainment university attainment . direct/tot.
observ. observ.first observ.last direct/tot.obs. observ.first observ.last
USA 21/21 1960 1990 21/21 1960 1990 Netherlands 9/21 1960 1990 9/21 1960 1990 Italy 12/21 1961 1991 4/7 1960 1989 Belgium 12/21 1961 1989 12/21 1960 1989 Spain 12/21 1960 1991 12/21 1960 1991 Greece 12/21 1961 1991 12/21 1961 1991 Portugal 11/21 1960 1991 8/21 1960 1991 France 12/21 1960 1989 12/21 1960 1990 Ireland 12/21 1961 1991 12/21 1961 1991 Sweden 9/24 1960 1994 9/24 1960 1994 Norway 6/21 1960 1990 8/21 1960 1990 Denmark 3/21 1973 1991 9/21 1973 1991 Finland 7/21 1960 1990 7/21 1960 1990 Japan 6/21 1960 1990 7/21 1960 1990 N. Zealand 7/21 1965 1991 8/21 1965 1992 UK 3/21 1960 1991 5/21 1960 1991 Switzerland 3/21 1960 1991 5/21 1960 1991 Austria 4/21 1961 1991 7/24 1961 1995 Australia 5/21 1965 1990 5/21 1965 1990 Germany 6/21 1970 1991 7/21 1970 1991 Canada 5/21 1960 1991 12/35 1960 1992 ______________________________________________________________________
A number of countries do not separate primary education from lower secondary schooling and report a single attainment level that comprises all mandatory courses. To preserve the homogeneity of our attainment categories, we have estimated the breakdown of compulsory schooling into L1 and L2.1. For some countries we have assumed that the ratio L1/L2.1 is the same as in some close neighbour. In particular, we have used the value of this ratio in the US to estimate the breakdown in Canada, and applied the Swedish ratio to Norway and Denmark. For those countries for which there is no obvious candidate for this role (Austria, the UK and Switzerland), we have used an ad-hoc regression estimate of the relevant ratio. Using the remainder of the sample (except Japan, where the information on L1 and L2.1 is of dubious quality), we estimate the following equation with pooled data:
(1) L2.1/(L1+ L2.1) = 0.0802 + 0.0094 (L3+L2.2) + 0.1998 (L3/L2.2) - 0.0029*trend adj. R2 = 0.6207
(0.74) (13.25) (4.36) (1.84)
where the numbers in parentheses below each coefficient are t ratios. That is, we hypothesize that those countries that are more "efficient" in getting students into the upper schooling cycles will also have greater accession rates to lower secondary schooling. Hence we specify the the weight of lower secondary schooling relative to primary attainment as a function of university and upper secondary attainment and the ratio of the two, and allow it to vary systematically over time. Since the fit of the equation is reasonably good, we use it to estimate the lower secondary/compulsory attainment ratio in the countries for which this information is not available.
Table 6: Cumulative years of schooling by educational level _________________________________________________ L1 L2.1 L2.2 L3.1 L3.2 Australia 7 11 13 15 16 Austria 6 9 13 15 17 Belgium 6 8 12 15 16 Canada 6 9 12 15 16 Denmark 6 9 13 14 17 Finland 6 9 12 14 17 France 5 9 12 14 16 Germany 4 10 13 15 17 Greece 6 9 12 16 16 Ireland 6 9 12 14 16 Italy 5 8 13 15 18 Japan 6 9 12 14 16 Netherlands 6 10 12 16 17 Norway 6 9 12 14 16 New Zealand 6 11 13 15 16 Portugal 6 8 12 14 16 Spain 5 8 12 14 17 Sweden 6 9 12 14 16 Switzerland 6 9 13 16 17 UK 6 9 12 14 16 USA 7 10 12 14 16 Mode 6 9 12 14 16 _________________________________________________
- Sources: Education at a Glance 1997 (OECD, 1998), except figures in bold type (WDI, World Bank, 1999) and in italics (national sources). These figures are combined with our attainment series to estimate the average number of years of total schooling reported in Table A.4 in the Appendix.
Using our attainment series, we finally construct an estimate of the average years of total schooling for each country and period. The assumed cumulative duration of the different school cycles in each country is shown in Table 6. In constructing these series we are implicitly assuming that everybody who starts a given school cycle does eventually complete it, which is clearly not the case. Hence, our figures will be biased upward and are not strictly comparable with Barro and Lee's average schooling series, which do
incorporate estimates of completion rates.14, 15
3.3.- A comparison with the B&L data set
Our results differ from Barro and Lee's original series in two important respects. In the time dimension, the profiles of our attainment series are considerably smoother and more plausible. In the cross section dimension, there are some significant changes in the relative positions of different countries that bring us, on average, closer to the pattern found in the OECD sources reviewed in Section 2.2. A detailed country by country comparison of the two sets of series can be found in Figures A1-A4 in the Appendix.
14 The average number of years of schooling in our series (taken across all countries and periods) is 9.29, as compared
with 7.56 for Barro and Lee (1996). 15
Figure 6: Range of the growth rate of avge. years of schooling: B&L vs. this paper -2% 0% 2% 4% 6% 8% D&D B&L
- Note: annual growth rates of average years of schooling for all countries and periods, arranged in decreasing order for each data set. D&D refers to this paper.
The importance of eliminating sharp breaks in the series is clearly apparent from Figure 6, which has been constructed by arranging the annualized growth rates of the average years of schooling for all periods and years in decreasing order within each data set. The difference in the range of this variable across data sets is enormous: while our annual growth rates (D&D) range between 0.15% and 2%, Barro and Lee's go from -1.35% to 7.80%; moreover, 15.9% of their reported growth rates are negative, and 19% of them exceed 2%. We suspect that the excessive volatility of the Barro and Lee series captured by these figures may be an important part of the reason why these data often generate implausible results in growth regressions, particularly when these are estimated using panel or first difference specifications. The empirical results we report in the following section are, as we will see, consistent with this hypothesis.
As we have already noted, our average years of schooling series is not directly comparable with Barro and Lee's. To examine changes in the cross-section pattern of the data, therefore, we first take averages across periods and then normalize both sets of resulting figures so that the unweighted sample average is set equal to 100 in each case. Figures 7 and 8 summarize the differences across data sets in this normalized measure of average attainment over the sample period. Figure 7 plots our average attainment levels (D&D) against Barro and Lee's (B&L). As may be expected, the correlation between the two sets of figures is quite high (0.826). There are, however, important deviations from the "diagonal" (i.e. differences in normalized attainments across data sets) that are reproduced in decreasing order in Figure 8. Relative to Barrro and Lee's estimates, France and Austria gain almost thirty points and surpass Greece in the attainment ranking, while New Zealand, Denmark and Finland experiment sizable downward revisions. Table 7 shows the correlation across data sets of average years of schooling around 1990. Our estimates (D&D) are slightly closer to the OECD data than to B&L and display a rather low correlation with NSD's figures.
Figure 7: Normalized avge. years of schooling: B&L vs this paper 20 40 60 80 100 120 140 160 20 40 60 80 100 120 140 160 Por Sp It Gr Fr Ost Be Nor Dk NZ US Can Ire Ger CH Fin Aus Swe UK Jap Nl D&D normalized years of schooling
B&L normalized years of schooling -Note: Average number of years of schooling in each country (taken over all periods) are normalized by the unweighted sample average (=100). A regression of our normalized years of schooling on Barro and Lee's gives the following result (t values in parentheses):
avge. years D&D = 35.43 + 0.646 avge.years B&L R2 = 0.683
(3.40) (6.40)
Figure 8: Change in normalized avge. years of schooling between this paper and B&L
-30 -20 -10 0 10 20 30
Ost Fr Po CH Can Ger Nor Nl Jap It UK Sp
Ir Gr Aus US
Sw Bel NZ
Fin Dk
Table 7: Average years of schooling around 1990 Correlation across data sets
_________________________________________ NSD B&L OECD B&L 0.542 OECD 0.531 0.807 D&D 0.355 0.797 0.871 _________________________________________
- Note: Same data as in Table 2, except for D&D. Greece is not included for lack of OECD data. 4.- Some empirical results
In this section we examine the performance of our revised data set and Barro and Lee's and Nehru et al's original series in a number of growth accounting specifications. The results support our hypothesis that the lack of correlation between productivity growth and human capital accumulation reported in some recent studies may be due to data deficiencies. Using the Barro and Lee data, the partial correlation between productivity and educational attainment is only significant in specifications in levels, and the estimated coefficient of human capital in an aggregate production function is quite low in all cases. The results with NSD data are generally even worse: the human capital variable is not significant except in one specification in which its coefficient is negative. With our revised data, in contrast, the coefficient of human capital in an aggregate production function remains positive, significant and large in all the specifications we consider and, unlike in Mankiw, Romer and Weil (1992), survives a simple robustness test. We also explore the possibility that a trends problem may bias the coefficient of human capital in growth regressions and use our preferred specification to investigate the contribution of factor stocks and TFP to cross-country productivity differences.
4.1.- How much difference does data quality make?
The first specification we estimate is a constant-returns aggregate production function in levels, which we write in intensive form,
(2) qit = Γ + γi + ηt + αkit + βhit + εit
where qitis the log of output per employed worker in country i at time t, k the log of the stock of physical
capital per worker16 and h the log of the average number of years of schooling of the adult population. We
use dummy variables to capture fixed time and country effects (ηt and γi). In all the results reported below
only those country dummies that turn out to be significant are left in the equation. The productivity data are taken from an updated version of Dabán, Doménech and Molinas (1997). We use pooled data at five-year intervals starting in 1960 and ending in 1990 for B&L and D&D, and in 1985 for NSD.
Table 8: A production function in levels
___________________________________________________________________________
[1] [2] [3] [4] [5] [6]
human cap. variab. NSD B&L D&D NSD B&L D&D
α 0.607 0.560 0.516 0.565 0.552 0.567 (18.23) (14.73) (13.92) (27.21) (25.95) (20.53) β 0.069 0.112 0.269 0.088 0.120 0.279 (1.69) (3.21) (4.88) (1.80) (6.48) (7.52) adj. R2 0.873 0.885 0.896 0.981 0.978 0.979 std. error reg. 0.136 0.131 0.124 0.053 0.057 0.056
country dummies no no no yes yes yes
period dummies yes yes yes yes yes yes
___________________________________________________________________________
- Notes: White's heteroscedasticity-consistent t ratios in parentheses below each coefficient. Only significant country dummies are left in the reported equation. Human capital is measured by the average years of total schooling in each country and period. D&D refers to this paper.
The pattern of results shown in Table 8 is consistent with our hypothesis about the importance of educational data quality for growth results. For all three data sets, the coefficient of human capital is positive in both specifications in levels (with and without fixed country effects), but the size and significance of the human capital coefficient increases appreciably as we go from the NSD data to the B&L and D&D data sets. The differences are even sharper when the estimation is repeated with the data in first differeces, as in equations [1]-[3] in Table 9, where only our revised data produce a significant (although implausibly large) human capital coefficient. The results obtained with the B&L and NSD data sets are consistent with those reported by Kyriacou (1991), Benhabib and Spiegel (1994) and Pritchett (1995), who find insignificant (and sometimes negative) coefficients for human capital in an aggregate production function estimated in first differences.
Next, we estimate a catch-up specification along the lines of de la Fuente (1996). The estimated equation
is of the form17
(3) ∆qit = Γο + γi + ηt + α∆kit + β∆hit + λbit + εit
17We consider an aggregate production function of the form
Y = Kα(ALH)β(AL)1−α−β
Dividing through by employment, rearranging and taking logarithms, log output per employed worker, q, can be
written in the form
q = αk + βh + (1-α)a
where k = ln (K/L), a= ln A and h= ln H. We can solve this expression for a as a function of productivity and factor
stocks
a = q - αk + βh1-α
and take growth rates to obtain
∆q = α∆k + β∆h + (1-α)∆a.
Finally, we hypothesize that the rate of technical progress is given by
∆ait = λ(aus,t - ait) + µi + υt
where we have added country and period subindices µi and υt are fixed country and period effects. Substituting this
last expression into the production function in growth rates, using the above expression for log TFP and simplifying,
we obtain equation (3) in the text. Notice that in the presence of technological catch-up (λ > 0), the technological
distance between each country and the leader converges to a constant value. This implies that, asymptotically, all
where ∆ denotes annual growth rates (over the subperiod starting at time t) and
(4) bit = (qUS,t - αkUS,t - βhUS,t) - (qit - αkit - βhit)
is the Hicks-neutral TFP gap between each country and the US at the beginning of each five-year subperiod. To estimate this specification we substitute (4) into (3) and use NLS with data on both factor stocks and their growth rates. Notice that in this specification the country dummies will pick up permanent cross-country differences in relative TFP levels that will presumably reflect differences in R&D investment
and other omitted variables. The parameter λ measures the rate of (conditional) technological convergence.
Table 9: A production function in first differences with and without a catch-up effect
___________________________________________________________________________
[1] [2] [3] [4] [5] [6]
human cap. variab. NSD B&L D&D NSD B&L D&D
α 0.519 0.508 0.493 0.510 0.409 0.373 (9.66) (9.51) (9.21) (8.30) (6.12) (7.15) β 0.090 0.063 0.493 -0.148 -0.057 0.271 (0.80) (1.03) (2.04) (2.62) (0.88) (2.53) λ 0.100 0.063 0.068 (6.98) (8.27) (6.34) adj. R2 0.719 0.710 0.718 0.840 0.811 0.809 std. error reg. 0.0098 0.0097 0.0096 0.0074 0.0079 0.0079
country dummies no no no yes yes yes
catch-up effect no no no yes yes yes
period dummies yes yes yes yes yes yes
___________________________________________________________________________
- Notes: White's heteroscedasticity-consistent t ratios in parentheses below each coefficient. Only significant country dummies are left in the reported equation.
The results are shown in equations [4]-[6] in Table 9. As in previous specifications, the human capital variable is significant and displays a reasonable coefficient with our revised data, but not with the B&L series or with the NSD data, which actually produce a negative and significant human capital coefficient. Moreover, the coefficients of the stocks of physical and human capital estimated with the D&D data are
quite plausible, with α only slightly above capital's share in national income and β only slightly below
Mankiw, Romer and Weil's (1992) preferred estimate of 1/3.
We have checked the robustness of our results by reestimating our preferred specification (the catch-up equation labeled [6] in Table 9) for all the possible subsamples obtained by deleting one country at a time from the original data set. Figure 9 displays the estimated human capital coefficient and the 95% confidence interval around it, after arranging the coefficient estimates in decreasing order across subsamples. As can be seen in the figure, sample composition does not make a significant difference in terms of the estimated coefficient, and all the estimates remain significantly different from zero at conventional confidence levels. By contrast, Temple (1998) reports that Mankiw, Romer and Weil's (1992) proxy for educational investment looses its significance once a few influential observations are removed. In the OECD subsample, in particular, the removal of Japan suffices to make the coefficient of the human capital variable insignificant (with a t ratio below one).
Figure 9: Estimated coefficient of human capital and 95% confidence interval around it when deleting one country at a time from the sample
-0,1 0 0,1 0,2 0,3 0,4 0,5 0,6 NZ Gr CH Ir Aus Sw Fi Nl Fr Be US Ost Dk It No Ge UK Sp Ca Po Ja
- Note: Catch-up specification with country dummies (equation [6] in Table 9), estimated after excluding the country shown in the horizontal axis.
4.2.- Is there a trends problem?
We suspect that the positive trend of human capital investment at a time of slowing productivity growth may have also contributed to the lack of significance of educational variables in growth regressions reported in several studies. As we will see in this section, however, this potential "trends problem" does not appear to be important in our OECD sample with our specification, although we suspect that this result may not be extensible to data sets that include developing countries or to convergence equations. Even in our sample, moreover, we find that the partial correlation between human capital investment and productivity growth is not significant in the pooled data unless we control in some way for other factors that may be responsible for the productivity slowdown. This can be achieved either by including a set of period dummies or by controlling for the remaining variables suggested by our structural model.
Figure 10: Average growth rates of productivity, per worker factor stocks and the TFP gap and investment rates in physical and human capital
-3% -2% -1% 0% 1% 2% 3% 4% 5% 6% 1960-65 1965-70 1970-75 1975-80 1980-85 1985-90 gq gk gh ggap 0,05 0,1 0,15 0,2 0,25 1960 1965 1970 1975 1980 1985 1990 1995 sk sh
- Note: First panel: annualized growth rates of productivity (gq), the stock of capital per employed worker (gk), average years of education (gh) and the TFP gap relative to the US. Second panel: sk is investment in physical capital as a fraction of GDP; sh is total secondary and university enrollment as a fraction of the population over 15 (from
World Development Indicators and UNESCO). All variables are average across countries in each subperiod.
Figure 10 sumarizes the time-series behaviour of the relevant variables. The upper panel of the figure shows the evolution of the average growth rates (taken across countries) of productivity, factor stocks per worker and the TFP gap. As is well known, the growth rate of productivity declines markedly during the period, as does the rate of accumulation of physical capital, while the growth rate of educational attainment is rather stable. The figure suggests that growth accounting regressions will tend to attribute the growth slowdown to the relative decline in investment in physical capital and will not necessarily
generate a spurious negative human capital coefficient (as it may be the case if the growth rate of this variable displayed an upward trend).
To confirm this hypothesis, we have reestimated several of the specifications in the previous subsection omitting the period dummies, toghether with a simple regression of productivity growth on human capital accumulation with and without fixed period effects. The results are shown in Table 10. When human capital is the only regressor, its coefficient is only significant when we include period dummies (see equations [1] and [2] in Table 10). Once we control for the accumulation of physical capital, however, the educational variable becomes significant even without fixed time effects, except in the specification in first differences without technological catch-up (equation [5]). With this single exception, the results are qualitatively very similar with and without time effects, although the inclusion of period dummies does tend to reduce marginally the coefficient of physical capital and to increase the coefficient of human capital, except in the last equation.
Table 10: Results without period dummies, D&D data
___________________________________________________________________________
[1] [2] [3] [4] [5] [6]
human cap. variab. D&D D&D D&D D&D D&D D&D
α 0.579 0.604 0.544 0.294 (24.95) (38.19) (11.27) (6.67) β 0.683 1.21 0.236 0.247 0.090 0.328 (1.56) (3.92) (4.44) (6.93) (0.36) (3.22) λ 0.076 (7.04) adj. R2 0.011 0.396 0.894 0.977 0.664 0.785 std. error reg. 0.018 0.014 0.125 0.058 0.0105 0.0084
country dummies no no no yes no yes
catch-up effect no no no no no yes
period dummies no yes no no no no
data in diff. diff. levels levels diff. diff.
___________________________________________________________________________
- Notes: White's heteroscedasticity-consistent t ratios in parentheses below each coefficient. Only significant country dummies are left in the reported equation.
Things are likely to be different, however, with a convergence equation specification à la Mankiw, Romer and Weil (MRW 1992). As shown in the lower panel of Figure 10, the rate of investment in physical capital is relatively stable over the period, while an MRW-style indicator of educational investment (that reflects secondary and university enrollment as a fraction of the adult population) displays a clear positive trend and will tend to be negatively correlated (over time, although not necessarily across countries) with the growth rate of productivity.
4.3.- Cross-country differences in TFP levels and the explanatory power of the neoclassical model
A number of authors have recently called attention to the crucial role of technical efficiency in understanding productivity disparities across economies and questioned the capacity of the human capital-augmented neoclassical model with a common technology to explain the international or