The Effect of the One-Child Policy on Fertility in China:
Identification Based on the Differences-in-Differences
∗
Hongbin Li
Department of Economics
The Chinese University of Hong Kong
Shatin, N.T., Hong Kong
Junsen Zhang
†Department of Economics
The Chinese University of Hong Kong
Shatin, N.T., Hong Kong
Yi Zhu
Department of Economics
The Chinese University of Hong Kong
Shatin, N.T., Hong Kong
August 11, 2005
∗We would like to thank Jeff Grogger, William Johnson, Steve Machin, Costas Meghir, Wing Suen, participants of various seminars and conferences, and in particular Alan Krueger, for their valuable comments. Any errors are the responsibility of the authors.
The Effect of the One-Child Policy on Fertility in China:
Identification Based on the Differences-in-Differences
Abstract
This paper measures the effect of China’s one-child policy on fertility by exploring the natural experiment that has been created by China’s unique affirmative birth con-trol policy, which is possibly the largest social experiment in human history. Because the one-child policy only applied to Han Chinese, but not to ethnic minorities, we construct a differences-in-differences estimator to identify the effect of the policy on fertility. Such a natural experiment is a rare opportunity, whether for the analysis of the effect on fertility or for the analysis of economics in general. Using two rounds of the Chinese Population Census, we find that the one-child policy has had a large effect on fertility. The average effect on the post-treatment cohorts on the probability of having a second child is as large as -11 percentage points. We also find that the magnitude is larger in urban areas and for more educated women. Our robustness tests suggest that our differences-in-differences estimates of the effect of the one-child policy are not very likely to be driven by other policy or socio-economic changes that have affected the Hanand the minorities differently.
1
Introduction
China’s one-child policy is probably the largest social experiment in human history. Under this policy, each household is allowed only one child, especially in urban areas. Women are given birth quotas, and households are penalized for “above-quota births.” The policy was started in 1979, and has since affected the lives of more than one billion people in what is the most populous nation in the world. This large social experiment provides a unique opportunity for researchers to examine the impact of counter-natal policies, which rarely
occur in human history (Birdsall, 1988).1
The dramatic one-child policy has, unsurprisingly, spurred a vast amount of research, in particular in the field of demography. Surprisingly, however, no study has been able to directly measure the effect of the one-child policy on fertility. In the last two and half decades, demographers, economists, and other social scientists have examined various aspects of the one-child policy (Johnson, 1994; Li, 1995; Qian, 1997; Short and Zhai, 1998; McElroy and Yang, 2000), but most of these studies have related the variation in fertility to the variation in the implementation of the one-child policy across localities, and find that these implementation variables, such as fines for above-quota births, one-child subsidies, and the provision of contraceptives, do indeed affect fertility.
Another problem with these studies is that most of them have ignored the endogeneity of the local policy variables. Tougher local implementation of the one-child policy may be a result of high local fertility, in which case there is a feedback effect from fertility to local implementation. Tougher implementation may also be a result of omitted local preferences, which affect both fertility and policy implementation. An instrumental variable (IV) approach may not help much to solve the problem, because it is hard to find valid IVs that are correlated with local policy implementation but not with fertility, either directly or indirectly through omitted variables.
1Pro-natal policies, which occur more often, have been much better studied. Most empirical work finds that pro-natal policies, such as child subsidies or tax deductions, have a positive effect on increasing fertility. See, for example, Whittington et al. (1990) and Zhang et al. (1994).
In this paper, we attempt to directly measure the effect of the one-child policy on fertility. The main innovation of this paper is that we measure the effect of the one-child policy by making use of a natural experiment that has not been well explored by other social scientists. A unique aspect of the one-child policy is that it is an affirmative policy in that it
only applies to the Han Chinese women. Ethnic minority women in China were allowed to
have two children until the end of the 1980s (Hardee-Cleaveland and Banister, 1988; Park and Han, 1990; Anderson and Silver, 1995; Peng, 1996; Qian, 1997), and thus the fertility
policy for the minorities is essentially a two-child policy.2
This affirmative policy provides us with a unique opportunity to identify the effects of the one-child policy on fertility. Specifically, we use the differences-in-differences (DD) estimator (Angrist and Krueger, 1999), which exploits the differences in the probability
of having a second birth between the Han Chinese and ethnic minorities, both for birth
cohorts that are affected by the policy (post-treatment group) and birth cohorts that are unaffected by the policy (pre-treatment group). For this purpose, we use the interaction of
the birth cohorts and a Han dummy to identify the exogenous variability in fertility that
can be attributed to the introduction of the one-child policy. This identification strategy is very clean, as we do not have to rely on local fertility policies, which are very likely to be endogenous.
Drawing on two rounds of the Chinese Population Census that were conducted in 1982 and 1990, our DD estimations show that the one-child policy has indeed had a significant
effect on reducing the probability of second births among the HanChinese compared to the
probability among the ethnic minorities. These two rounds of census allow us to identify the pre-treatment group of birth cohorts of women whose second births were not affected by the one-child policy. Empirically, these are the 1942 and earlier cohorts, the women in which were 37 or older in 1979. In both rounds of the census, the DD estimate is statistically significant for each of the cohorts for the period 1948 to 1962, whose ages were in the range
2Some minority-dominated autonomous regions may allow minority women to have more children. See the next section for details.
of 17 to 31 when the policy was introduced in 1979. The average effect on the post-treatment cohorts is -7.5 percentage points for 1982 and -11.0 percentage points for 1990. The largest magnitude of 23 percentage points is identified for the 1958 cohort from the 1982 census. The estimated effects only change slightly when we control for the education of women, the education of their husbands, and the rural and provincial dummies. When we conduct the same analysis on different sub-samples, we find that the magnitude is larger in urban areas and for more educated women. For example, the one-child policy has almost no effect on fertility for the rural illiterate group, but can be as large as -30 percentage points for some urban cohorts with at least senior high school education.
To have more confidence in the DD estimation, we need to make sure that it is not mainly picking up the effect of other policy shocks or economic changes. The key assumption of the DD method is that without the one-child policy, the changes in the probability of
having a second child for the Han and the minorities would have been the same between
1979 and 1990. If there are other policy shocks or changes in social-economic variables in the
same period that have affected the fertility behavior of theHanand the minorities differently,
then the DD method may have picked up the effect of these policies or changes.
One way to test the validity of the key assumption for the DD estimates is to directly examine whether other household decision variables, which may reflect parental preference and the opportunity costs of children but are not likely to be affected by the one-child
policy, have changed in different ways for the Han and the minorities in the treatment
period. If there are other policies or changes of social-economic variables that have altered
the preference and costs of the children of the HanChinese more than the minorities for the
post-treatment cohorts, then the DD estimator should pick up these effects. To this end, we use the DD method to estimate the probability of getting married and having a first child. Although the one-child policy could have a potential feedback effect on these variables, in that those who know that they cannot have a second child may marry late or have their
first child late,3 our estimates for these two variables are almost zero for all but the very late cohorts. These results suggest that our estimates of the effect of the one-child policy on the probability of having a second child may not be mainly driven by other factors, because these factors should have changed marriage and first birth behavior in the same way if they had affected preference and child costs.
This study contributes to the fertility and economics literature in the following ways. First, the DD method allows us to measure the fertility gap that is caused by the exogenous variability of the one-child policy. To the best of our knowledge, no previous research has even been able to directly measure this effect, let alone establish causality. Second, and more generally, the identification strategy that is based on this unique natural experiment can potentially be used to break endogeneity in other economic relationships. For example, one could use the DD method as an instrument to identify the effect of one more child on parental labor supply, child quality, and the stability of marriage. In this sense, we contribute to the literature that explores natural experiments in social settings (see, for example, Rosenzweig and Wolpin (1980 and 2000), Angrist and Krueger (1991), Ashenfelter and Krueger (1994), Angrist and Evans (1998), and Behrman and Rosenzweig (2004)).
Finally, the empirical findings have some important policy implications. We find that, in general, the one-child policy has a large impact on fertility, although this impact varies across groups. In particular, we find that the policy has had almost no effect on the least well-off group, which consists of rural residents with little or no education. The purpose of birth control is to enhance economic growth and increase household income, but ironically the imposition of the one-child policy may not only perpetuate inequality, but also exacerbate it. When the poor have many children, the life quality of these children is low and they will also grow up to be poor.
The rest of the paper is structured as follows. In Section 2, we briefly introduce birth
control policies in China, and especially look at how these policies differ for theHanChinese
3This feedback effect should be smaller for women in the earlier cohorts, as they were more likely to be married and have a first child by the time the one-child policy started.
and the ethnic minorities. In Section 3 we specify our empirical strategy, and in Section 4 we introduce the data of the Population Census of China. In Section 5 we use the DD method to measure the effect of the one-child policy on fertility. Section 6 checks the robustness of the DD method, and Section 7 concludes the study.
2
The One-Child Policy in China
China introduced its unique policy of one child per family in 1979. Under this policy,
each woman is allowed only one child. Women are given birth quotas, and households are penalized for “above-quota births”. To implement the policy, local governments at all levels are given incentive contracts in the form of fiscal rewards for fulfilling birth targets, and heavy penalties for falling short (Hardee-Cleaveland and Banister, 1988; Short and Zhai, 1998). Moreover, government officials may be demoted for allowing too many above-quota births in their community, which means that they will lose all future income and other benefits that are associated with government positions.
Birth control policies can be classified into two categories, national and local. National policies, such as the one-child policy, are applicable throughout the whole country, but local policies, such as penalties for above-quota births, may vary between regions, such as rural and
urban, or between provinces.4 In a sense, local policies are merely methods for implementing
the one-child policy of the central government.
A unique aspect of the national policy is that it is a policy that has affirmative aspects with respect to ethnic minorities. The government has enacted tighter control over the
birthrate of the Han Chinese women compared to that of ethnic minority women, who are
normally allowed to have two children (Hardee-Cleaveland and Banister, 1988; Park and Han, 1990; Anderson and Silver, 1995; Peng, 1996; Qian, 1997). Although a third child is not allowed for minority women in most regions, there are some exceptions. For example, in Xinjiang Province, minority women can have as many as four children. In rural areas of
4The central government allowed each provincial government to draw up its own birth control regulations or rules that are based on the national policies but incorporate local characteristics (CCCPC, 1984).
Tibet, there are no restrictions on the number of children that minority women can have.
In April 1984, five years after the one-child policy was initiated for the Han Chinese, the
government for the first time stated that there should also be birth control policies for ethnic minorities, but that these policies should be less restrictive (CCCPC, 1984; Hardee-Cleaveland and Banister, 1988). However, up to the end of 1988, minority women were allowed to have a second child (Deng, 1995), and for ethnic groups with a population of less than 10 million, a second or even a third child was allowed. Ethnic groups with a population
of more than 10 million were subject to the same policy as theHan. At the end of the 1980s,
only theZhuang had a population of more than 10 million, most of whom lived in Guangxi.
On 17 September 1988, the Guangxi provincial government introduced the one-child policy
for ethnic Zhuang families (Guangxi Autonomous Government, 1988), and other provinces
started to apply the same policy in the 1990s. By 1990, the population of the Manchu, the
second largest ethnic group in China, had also topped 10 million, and they therefore became subject to the one-child policy. To summarize, for most of the 1980s, minority women were allowed to have more than one child, which provides a unique natural experiment with which
to test the effect of the birth control policy on fertility.5
Local birth control policies, although generally tough, demonstrate great heterogeneity. In particular, the penalties for above-quota births are much more severe in urban areas than in rural areas (Banister, 1987). Urban citizens who violate the policy have to pay a fine that is proportional to their monthly salary, which is sometimes as high as 70 percent, and can be demoted or become permanently ineligible for promotion if they work in state-owned enterprises or institutions, which were the major urban employers in the 1980s. Furthermore, above-quota children are not allowed to go to urban public schools, which receive substantial education subsidies (Short and Zhai, 1998). In contrast, the only severe punishment in rural
5Even though the one-child policy applied to theZhuangin Guangxi in September 1988, it only applied to women who fell pregnant after the issuance of the policy. Generally speaking, the earliest time that these women could have had a baby was July 1989, so this should have little effect on our results, which are based on censuses from 1982 and 1990. We have experimented with excluding theZhuangfrom our samples and find that the results are very similar.
areas for above-quota births is a one-shot fine. Demotions or deprivations of the children’s right to go to school are not important, because few rural citizens work for state-owned institutions and public schools are badly funded in rural China. Moreover, even the fine may not be very effective in rural areas, because many poor farmers cannot afford to pay (Li and Zhang, 2004). Because of the difficulties of implementation and potential social unrest,
in some rural areas and in certain years the policy is relaxed to allow Hanwomen to have a
second child if the first child is female (Hardee-Cleaveland and Banister, 1988; Qian, 1997; Chow, 2002).
In addition to the urban-rural difference in fertility policies, there is also a large vari-ation in policy across rural localities. Short and Zhai (1998) find that 41 percent of the villages in their sample have a strict one-child policy, 43 percent allow a second child if the first child is a girl, and the remaining 16 percent allow two children without conditions. In rural areas, fertility fines have been the primary penalty that is used by local government officials for above-quota births. Various studies have shown that the fines are heavy and vary enormously across communities, ranging between 20 and 200 percent of a household’s annual income (Li, 1995; Short and Zhai, 1998).
In the following analysis, we make use of the affirmative one-child policy to explore how national-level policies have affected the fertility of Chinese women. The census data that we draw on do not provide any information on local birth-control policies, and even if we observe local policies we cannot easily use them as covariates, as previous work has shown that local policies are endogenously determined (McElroy and Yang, 2000; Li and Zhang, 2004). Rather than directly examining local policies, we add locality dummies into our regressions to control for any potential differences across localities. As will be shown later, these locality dummies do not affect the results much.
3
Differences-in-Differences Strategy
In this section, we introduce our empirical strategy for measuring the effect of the one-child policy on fertility. Essentially, the strategy is based on China’s affirmative birth control policy, which constitutes a natural experiment. Specifically, we estimate the coefficient of the interaction of age (as a measure of the timing of the policy, as women of different ages have different childbearing periods that overlap with the period of the one-child policy)
and the Han dummy. Based on the differences-in-differences (DD) method (Angrist and
Krueger, 1999), this interaction term can be used to identify the change in fertility that can be attributed to the introduction of the one-child policy.
To understand this identification strategy, we need first to explain how the DD method can be applied to estimate the effect of the one-child policy on fertility. The DD method
works because the one-child policy only applied to theHanChinese. Thus, we have the Han
Chinese as the treatment group and the ethnic minorities as the control group. A distinct feature of the birth-control policy is that the timing of the treatment is not discrete, that is, there is no simple distinction between no treatment and treatment, as would be the case in most situations to which a DD method might be applied, such as joining a training program. Rather, the treatment is a matter of degree that decreases with the age of a woman. For
example, a Han woman who was 25 years old in 1979 was more affected by the one-child
policy than aHanwoman who was already 50 years old in that year, because the older woman
had fewer childbearing years left. Thus, we need to identify the pre-treatment group, which includes women of those birth cohorts who had their second child before the implementation of the one-child policy. We offer details on the identification of the pre-treatment group in Section 5.1.
We use the DD framework to control for systematic differences both across ethnic
groups and across birth cohorts.6 Differencing fertility across ethnic groups and birth cohorts
gives
DD= [E(Y1i|H)−E(Y0i|H)]−[E(Y1i|M)]−E(Y0i|M)], (1)
whereY1 and Y0 denote the second birth dummy for the post-treatment cohort and the
pre-treatment cohort, respectively, andHandM denote theHanand the minorities, respectively.
Intuitively, we compare fertility, or the probability of having a second child, between the
Han Chinese and ethnic minorities before and after the policy came into effect. Comparing
fertility before and after the policy for each ethnic group differences out time-invariant ethnic factors, and comparing the post-treatment difference to the pre-treatment difference will remove any changes that are not due to the introduction of the one-child policy. Thus, we can capture the causal effect of the one-child policy as long as the treatment group did not experience other changes that are systematically different from those experienced by the control group. As has been argued, to allow the effect to differ across ages, we conduct the comparison for each birth cohort that falls within the post-treatment period. Note that we use the second birth dummy, rather than the total number of children, as our measure of
fertility, because a third child is generally not allowed for either the minorities or the Han.
In practice, we use the following regression-adjusted DD model to identify the effect of the one-child policy on fertility. Consider
Yi =β0+β1Hi +β2Ti +β3HiTi+Xiβ4+i, (2)
where Hi is the Han dummy, which equals 1 for a Han woman, and Ti is the policy timing
dummy that equals 1 if a woman is in a post-treatment cohort.7 The two variables, H
i
and Ti, pick up the two main effects of being Han on fertility and of the policy treatment
on fertility. The coefficient of the interaction term, or β3, is essentially our DD estimator.
Assuming that without the one-child policy the changes in the fertility of Han women and
minority women would have been the same between 1979 and 1990,8 the interaction term
picks up the effect of the one-child policy on fertility. In other words, the interaction term
7More strictly, minority women were not subject to the one-child policy, although T
i is defined in the
same way.
8This is the same as assuming thatβ
measures the fertility gap between Han (the treatment group) and ethnic minority (the control group) women that is attributable to the affirmative one-child policy. We expect a negative coefficient of the interaction term, which means that the birth control policy has
lowered the fertility of the Han Chinese compared to the fertility of the ethnic minorities.
Note that we add a vector of variables Xi in the equation to control for some demographic
and geographic characteristics that may also be correlated with fertility. Controlling for Xi
changes the estimate of β3 only if HiTi and Xi are correlated, conditional on the two main
effects of being Han and the one-child policy. In this paper we carry out both regressions
(with and without Xi) to test the robustness of our results.
4
Data
We use the 1% sample of the 1982 and 1990 Chinese Population Censuses that were collected by the Chinese National Bureau of Statistics (formerly the State Statistic Bureau). They were the third and fourth censuses of their kind, following the two that were conducted
in 1953 and 1964.9 The 1% sample covers 2,426,908 households in 1982 and 2,832,103
households in 1990. The dataset contains a record for each household, and includes variables that describe the location, type, and composition of the households. Each household record is followed by a record for each individual residing in the household. Variables that relate to individuals include demographic characteristics, occupation, industry, education levels, ethnicity, marital status, and fertility.
To facilitate our analysis, we use a sub-sample of the census data. We first restrict the sample to women who are either the head of the household or the spouse of the household head, because for them the census has complete information on fertility, marital status, and own and spousal education levels. We then restrict the sample to women whose ages were between 20 and 64 in the census years. We use 20 as the lower bound because it is the
9The two earlier censuses are not available to researchers, but even if they were available they would be too early for our purposes. The latest census, or the fifth round, was conducted in 2000, and is too late for the application of the DD method, as almost all of the women in the 2000 census who reported fertility (1951-1985 cohorts) fall within the post-treatment period, as defined in Section 5.1.
legal age of marriage for women in China,10 and births to women below the age of 20 are rare. We set 64 as the upper bound, because the census does not ask women who are older than this for fertility information. With these restrictions, we obtain a sample of 1,786,888 women from the 1982 census and 2,358,417 women from the 1990 census. Of these women,
94 and 93 percent are HanChinese in the two years, respectively. We summarize the major
variables for both censuses in Table 1.
Several aspects in Table 1 are worth noting. The table shows that the average number of children per woman is far greater than one, despite the fact that the one-child policy had been in force for ten years by the time of the census in 1990. On average, a woman who was sampled from the 1982 census had 3.8 children. A woman in 1990 had fewer children, with the number decreasing to 2.9. This also reflects the second interesting aspect that the average birth rate was lower in 1990 than in 1982. Although the proportion of women who bore at least one child increased slightly during the eight-year period, the proportion of women who had a second and third child were both lower in 1990, which suggests that the birth control policy may have played a role in reducing fertility, because more of the women in the 1990 sample were affected by the policy and for a longer duration than those in the 1982 sample. For the 1990 census, we are also able to observe whether a woman
resided in a rural or urban residence.11 Moreover, as is evident from the rural and urban
subsamples from the 1990 census, the rural-urban gap in the number of children is as large as 0.88. Finally, the average education level increased between the two census years. Table 1 shows the four education groups that are defined in this paper: illiterate, primary school,
junior high school, and higher education (senior high school and above).12 The proportion
10The Marriage Law of 1980 (see Peng, 1996), which is still in effect, sets the minimum age of marriage at 20 for women and 22 for men.
11There was a survey question about whether the interviewee had an rural or urbanhukou, or household registration in the 1990 census. This helps us to distinguish between the rural and urban households. Unfortunately, this question was not asked in the 1982 census.
12The census coded the education level into seven categories: Illiterate, Primary School, Junior High School, Senior High School, Technical School, Junior College, and University. As the sample size for senior high school or above is relatively small, we group all these observations together as the top education level (higher education).
of illiterate women dropped sharply from 57 percent to 33 percent, whereas the proportion of women in all of the other education groups rose.
To gain a picture of how theHanChinese differ from the ethnic minorities across years,
we divide the sample into Han and minority subgroups in Table 2 and check some of the
variables by age group. A preliminary examination of the data shows significant differences between the two ethnic groups that are consistent between 1982 and 1990. First of all,
minority women had a higher fertility than Han women, regardless of whether we measure
fertility by the number of children per woman or by the proportion of women who had a
second child.13 Second, ethnic minorities had an inferior education attainment on average,
with a much larger proportion of illiterate women. Finally, according to the 1990 census, minorities were more likely to live in rural areas, with 85 percent of the minorities versus
only 79 percent of the Han being from rural areas. It should be mentioned that all of the
differences between the Han and the minorities in Table 2 are statistically significant at the
one-percent level (the t-ratios are thus not reported). This indicates that there may be some
intrinsic differences between the Hanand the minorities, which validates the use of the DD
strategy to difference out these factors.
5
The Effect of the One-Child Policy on Fertility
In this section, we systematically test whether China’s birth control policy has had an effect on fertility, and measure the magnitude of this effect if it is found to exist. We first explore the data and identify the pre-treatment birth cohorts. We then estimate Equation (2) without
and with controlling forXi, which is the vector of the demographic and geographic variables.
Finally, we examine whether the effect of the one-child policy is different in rural versus urban areas and for women with different levels of education. For all of the estimations, we employ ordinary least squares (OLS) regressions with a dependent variable that is equal to 1 if
a household has a second child, and 0 otherwise.14 We leave the robustness checks that examine the validity of the identification assumption of the DD method to Section 6.
5.1
The Pre-Treatment Group
To implement the DD method, we need to identify the pre-treatment group, or the group of women whose second birth behavior was not affected by the implementation of the one-child policy. This group includes those women who, by 1979, already had their second child if they wanted and were able to do so. Of course, they should be the older women, but we need to determine the cutoff age for the pre-treatment group.
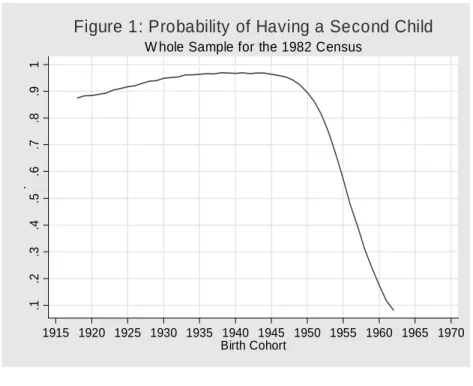
We can identify the cutoff age by looking at the 1982 and 1990 censuses. Figure 1 plots the probability of having a second child by birth cohort for the 1982 census. The graph shows that the probability of having a second child increases with the year of birth for the birth cohorts of 1918-1935. This increase in fertility probably reflects the better nutrition,
health, and living conditions.15 The probability of having a second child becomes more or
less stable at the level of 96-97 percent for the 1935-1945 cohorts, which means that in 1982, women in the age range of 37-47 (the 1935-1945 cohorts) had a roughly equal chance of having a second child. According to studies in the literature of medicine and demography (Cheng et al., 1992; Tu et al., 2000; Liu et al., 2005), the primary infertility rate for Chinese couples, or the proportion of couples who are not able to get pregnant when they have been trying for a certain time, was about 1.3-2 percent in the 1980s. Presumably, the secondary infertility rate should be higher, which suggests that 96-97 percent is almost the biological limit for the percentage of Chinese women having a second child. Therefore, women in the cohorts of 1945 or earlier were almost unaffected by the one-child policy.
To check whether the probability of having a second child for the 1945 and earlier cohorts really stabilized after 1982, we add a line for the 1990 census in Figure 2. If some of
14Using the probit model generates very similar results, but as most of our analysis involves comparing the means between groups, using the linear (OLS) model is more convenient.
15China was politically instable and was involved in various wars between 1918 and 1945, which may have affected fertility negatively.
the women in these cohorts had a second child after 1982, then we should be able to see this by comparing the 1982 and 1990 lines. Interestingly, Figure 2 confirms that the probability of having a second child for the 1950 and earlier cohorts indeed stabilized after 1982. The 1982 and 1990 lines almost coincide with each other for the 1950 and earlier cohorts, which suggests that the probability of having a second child for these cohorts did not change over the eight-year period.
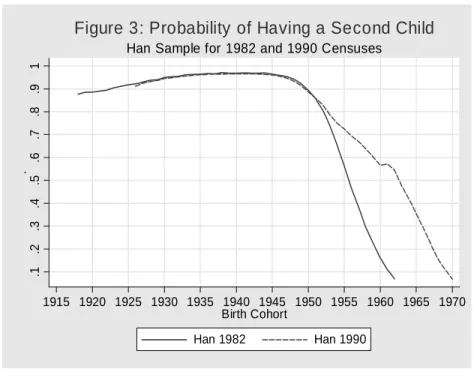
In Figures 3 and 4, we re-plot the probability of a second birth for theHanand minority
subsamples, respectively. Consistent with Figure 2, the two figures show that there is almost
no change for the 1950 and earlier cohorts in both the Han and the minority subsamples.
Again, for the 1935-1945 cohorts, the probability reaches 97 percent for the Hansubsample
(Figure 3), which is almost the biological limit for second births. For the minorities (Figure
4), the probability is about one percent lower than that of the Han for the 1950 and earlier
cohorts,16 but the probability is also stabilized for these cohorts.
Putting these together, we find the following. Chinese women had already had their second child if they wanted to by the age of 37 (which corresponds to the 1945 cohort in the 1982 census), as 1945 is the cutoff cohort for stabilized probability across cohorts (1935-1945), 1950 is the cutoff cohort for stabilized probability across age (the probability does not change with an increase of age by eight from 1982 to 1990), and women in the 1945 and earlier cohorts had a rate of second births that reached the biological limit.
Our goal is to identify women in these birth cohorts who had had a second child by 1979 (if they were able and willing), the year in which the one-child policy started. As we do not have data from 1979, we make use of what we have learned from the 1982 and 1990 censuses to pin down those birth cohorts. We learned that in 1982, women who were 37 or older had already had their second child. As the earlier cohorts generally did their childbearing earlier in their lifecycle than the later cohorts, it is safe to assume that in 1979, women who were aged 37 or above had already had their second child if they wanted and
were able to. The cutoff age of 37 in 1979 means that the cutoff birth cohort is 1942. Thus, we use the 1942 and earlier cohorts as the pre-treatment group in our DD analysis.
5.2
The Effect of the One-Child Policy
We begin by examining the effect of the one-child policy on fertility using the 1982 census, and report the results in Table 3. Before examining the DD estimates, we first present the
results for the difference between theHanand the minorities in having a second child for the
pre-treatment (1918-1942) and post-treatment groups (1943-1967) as a whole. As is shown in column 4, row 1, the average difference in the probability of having a second child between
the Han and the minorities for the pre-treatment cohorts is 1.4 percentage points. The
number is significantly positive, which means that for the group before the policy treatment,
Han women were more likely to have a second child than minority women. However, the
average difference for the post-treatment cohorts as a whole is reversed to -6.1 percentage points, which indicates that the minorities were more likely to have a second child in the post-treatment period.
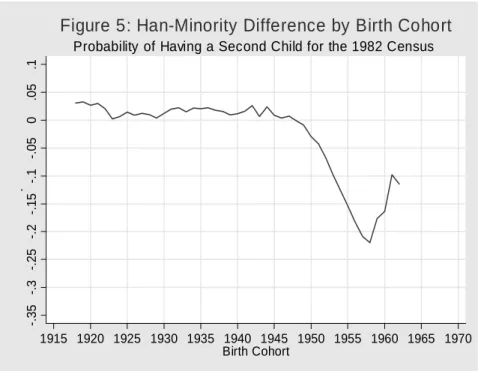
To see more clearly how the difference between the Han and the minorities evolves
across cohorts, we plot the difference for each birth cohort in Figure 5. We also report the
difference for each of the post-treatment cohorts in column 4 of Table 3.17 Note that the
difference is slightly above zero for the 1947 and earlier cohorts, and that the magnitude is almost the same within the whole range, which implies that our choice of the pre-treatment group (the 1942 or earlier cohorts) is safe. The difference remains positive, although rather small in magnitude, for the 1943-1947 cohorts, and then turns negative for the 1948 and later cohorts. The sharp change that starts with the 1948 cohort suggests that the one-child
policy has reversed and increased the fertility gap between the Han Chinese and the ethnic
minorities. The gap (the absolute value) reaches the maximum of 22 percentage points with the 1958 cohort (24 years old in 1982) and then starts to decrease for the later cohorts.
17To save space, we do not report the difference for each pre-treatment cohort (1942 and earlier cohorts), as it is not in the interest of this paper. The complete results are available upon request.
The effect of the one-child policy is smaller for both earlier and later cohorts within
the post-treatment group, but for different reasons. In the earlier cohorts, someHanwomen
had already had their second child by 1979, and hence were not affected by the one-child
policy. In the later cohorts, although Han women were more likely to be affected by the
policy, some minority women who wanted to have a second child may not have done so by the census year. Thus, the effect of the policy for younger women is expected to increase with time, and for these two reasons the one-child policy appears to have had the greatest effect on the cohorts near 1958, the women in which were about 24 years old in 1982 (21 in 1979).
The DD estimates (the estimatedβ3) that are reported in column 5 of Table 3 give more
details of the effect of the one-child policy for each birth cohort. Although the effect for the 1943-1947 cohorts is mixed, the DD estimates for the 1948-1962 cohorts are all negative and significant at the one percent level. The women in these affected cohorts were 17-31 years old in 1979 when the policy was implemented. The magnitude of the effect first increases with
the birth year, peaks at 23.4 percent for the 1958 cohort, and then descends thereafter.18
The average effect on the post-treatment group is reported in the last two rows. On average,
the one-child policy has lowered a Hanwoman’s probability of having a second child by 7.5
percentage points, compared to the probability for a minority woman before and after the policy treatment. If we focus on the relatively early post-treatment cohorts (1945-1959), whose second birth behavior is more likely to have been fully observed, the effect of the one-child policy rises to 9.0 percentage points.
To check how stable the one-child policy effect is, in Figure 6 we add another line for
the 1990 census for comparison. The 1990 line shows that the difference between the Han
and the minorities remains quite stable until 1958, after which the gap between the two census years starts to expand. Note that the 1990 line for the 1958 and earlier cohorts is
18As we use the same pre-treatment group to identify the policy effect for each post-treatment cohort, the difference between the results in column 4 and column 5 is simply a constant, that is, the average difference for the pre-treatment cohorts. However, the significance levels are not necessarily the same.
very close to that of the 1982 line, which suggests that the DD estimates for the 1943-1958 cohorts are very similar for the two census years. In contrast, for the cohorts after 1958, the difference between the two census years steadily increases with the birth year. As has been discussed, one reason is that compared to the earlier cohorts, a larger proportion of the women in the later cohorts had not had their second child (if they wanted to) by 1982. In other words, more of their second birth behavior had been observed by 1990.
The estimation results for the 1990 census are reported in Table 4. As is shown in column 5, the DD estimates are significantly negative for almost all of the post-treatment cohorts. Similar to the results for the 1982 census, the magnitude first increases with the birth year, reaches the maximum level of 21.9 percent at the 1959 cohort, and then decreases. Note that the DD estimates for most of the cohorts in the post-treatment group for the 1990 census are larger than those for the 1982 census, and the average magnitude of the treatment effect is as large as 11.0 percentage points. The eight-year difference (comparing the last row of Table 3 to that of Table 4) in the effect of the one-child policy for cohorts 1945-1959 is 2.5 percentage points.
In summary, we find that the one-child policy has had a significant effect on reducing
the fertility of Han Chinese relative to ethnic minorities. In both rounds of the census, the
DD estimate for each of the cohorts between 1948 and 1962, the women in which were aged
between 17 and 31 when the policy was introduced in 1979, is statistically significant.19 The
average effect on the post-treatment cohorts is -7.5 and -11.0 percentage points for 1982 and 1990, respectively. We also find that the effect differs across birth cohorts. Specifically, the magnitude is the largest for the 1958-1959 cohorts (at levels of about 20 percentage points), and is smaller for both the earlier and later post-treatment cohorts. The pattern across cohorts is very similar between the two census years.
In the following detailed analysis and robustness check, we focus on the 1990 census
19The 1982 sample excludes the 1963-1970 cohorts, the women in which were too young to have a suffi-ciently complete childbearing record in 1982. The DD coefficients for these cohorts are also significant in the 1990 sample.
unless otherwise stated. The estimations using the 1982 census (if applicable) generate similar results and are thus omitted. Due to space limitations, we only report the DD estimates in tables.
5.3
Estimates with Control Variables
In this subsection, we estimate Equation (2) using the household and geographic variables
as control variables.20 Adding these variables does not only control for other policies or
social-economic conditions that may affect fertility, but also tests the robustness of our DD estimates. If the DD estimator has picked up the effect of cross-cohort changes in other
differences between the Han and the minorities, then controlling for these variables will
reduce the magnitude of the estimator. However, if the one-child policy is uncorrelated with these variables, then our DD estimates should undergo no significant change even after controlling for these variables.
In general, the census provides very few variables, and we try to use all that are relevant. In particular, we use the education dummies as defined in Section 4 to capture the
opportunity cost of children and the preference of women,21and use the provincial and rural
dummies to capture geographic factors that may influence parental preferences and the costs of children.
Interestingly, the DD estimations are not very sensitive to the inclusion of these vari-ables. The second and third columns of Table 5 report the DD estimates from the regressions that control for the education level of women and their husbands. Compared to column 1, which has no other control variables, the magnitudes of the DD estimates only decrease marginally, and by less than one percentage point for most of the cohorts. When we also include the provincial and rural dummies in column 4, the magnitudes of the DD estimates even increase slightly, although they are still smaller compared to those in column 1. The
20See Behrman and Wolfe (1984) and Rosenzweig and Schultz (1985) for the potential determinants of fertility.
21It is well known that fertility is negatively correlated with a woman’s education (see, for example, Jain, 1981; Wang, 1988; Martin, 1995).
trend is the same for the average effect, as is shown in the last two rows. Overall, controlling for these covariates causes very small changes in the DD estimates, which suggests that our method may to a large extent have picked up the effect of the one-child policy on fertility.
5.4
The Effect of the One-Child Policy in Rural and Urban Areas
The effect of the one-child policy on fertility is significant in the whole sample, but we do not know whether the effect differs between rural and urban areas. Previous empirical studies have found that the one-child policy is more strict in urban areas than in rural areas (Zhang and Spencer, 1992; Ahn, 1994). The one-child policy may be less effective in rural areas for various reasons. First, in rural China, parents have a stronger desire to have more than one
child, even at the cost of penalty fines for violating the birth control policy.22 In addition
to the consumption value of children, they are also very important investments for parents because they can carry out farm and house work, and in particular provide parents with
security in their old age.23 Sons are especially preferred in rural China, because they provide
major support and care for aging parents, continue the family name, carry out heavy farm work, and receive the family inheritance (Dasgupta, 1995; Graham et al., 1998). Most cases of above-quota births in rural areas arise because households want a son (Zhang, 1994). However, in urban China, a child’s value is lower and its cost is higher relative to the cost in rural areas (Croll, 1983), thanks to a better social security system and the soaring cost of nurturing a child. In addition, the preference for sons is less prevalent in urban areas, which gives parents less of an incentive to have a second child even if the first child is a girl. The second reason, as discussed in Section 2, is that the one-child policy may have been enforced more strictly in urban areas.
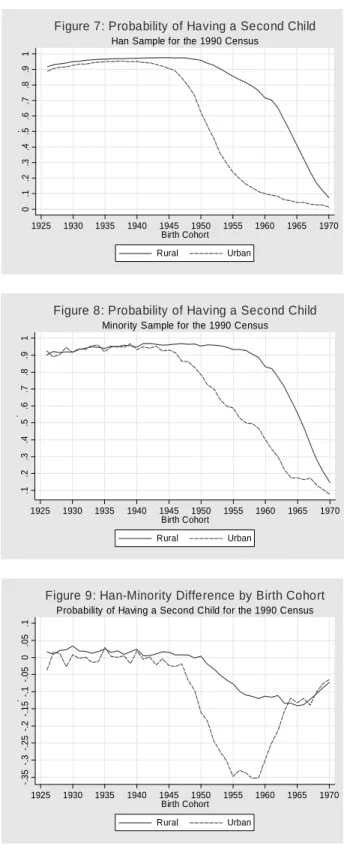
To allow for the disparity in the effect of the policy between rural and urban areas, we perform the same estimations using the rural and urban subsamples. Figures 7-9 confirm
22Above-quota births in rural areas are very common. Using a sample of 14,808 infants in rural Hebei, Li (1995) finds that 52 percent were above-quota births.
23See Becker (1991), Johnson (1994), Dasgupta (1995), and Ray (1998) for arguments on the benefits of children in developing countries.
the prediction that the effect of the policy has been smaller in rural China than in urban China. Note first that the probability of having a second child is higher in rural areas for
both Han and minority women and for each post-treatment cohort as expected (Figures 7
and 8). Figure 9 plots the fertility gap between Han and minority women by birth cohort
for the rural and urban subsamples. As is shown by both lines, the fertility gap is more or less stable for the pre-treatment cohorts (1942 or earlier), but starts to widen at the 1945 cohort. The change in the urban line is much steeper than the change in the rural line, which
implies that the effect of the treatment is larger for the urban Han.
The DD estimates that are reported in Table 6 give the details of the effect for each post-treatment cohort. The effects for most of the cohorts (1948-1970) are negative and statistically significant for both rural and urban areas. The rural-urban difference in the
treatment effect is sizable. On average, the one-child policy has reduced a ruralHanwoman’s
probability of having a second child by 7.5 percentage points (column 1), compared to a
16.8 percentage-point (column 2) drop for a Han woman living in an urban area. The
effect in urban areas reaches the maximum of 35.3 percentage points (1958 cohort), whereas the maximum effect for rural areas is only 15.6 percentage points (cohort 1965). Our DD estimates of the effect of the one-child policy are consistent with previous findings that there is a large discrepancy between rural and urban areas. In particular, the one-child policy has
been more effective in deterring Han Chinese women in urban areas from having a second
child than it has been from deterring Han Chinese women from rural areas.
5.5
Effect of the One-Child Policy by Education Level
Another issue that we address in this study is whether the effect of the policy varies with the education level of the women. There are reasons to believe that a woman’s education may interact with the one-child policy in reducing fertility. Women with a higher educational level may better understand the policy, and would thus be more willing to abide by it. Women with more education may also have better knowledge of the effective contraceptive
methods, and thus engage in better birth control. More importantly, better-educated women may suffer a higher cost for violating the birth control policy, because higher education is usually associated with a better occupation, a higher income, and a more respectable social status. As argued by Li and Zhang (2004), a large fine on above-quota birth can deter rich households from having children, but may fail to deter poor households. Although the mechanisms through which education interacts with the one-child policy are not well documented, a few studies have found that better-educated women are more likely to comply with the one-child policy (Wang, 1989; Zhang and Spencer, 1992; Ahn, 1994).
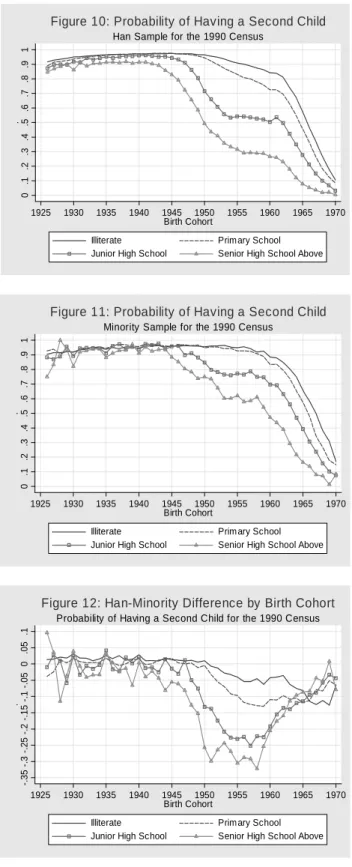
Again, to test the variation of the treatment effect that is associated with education, we carry out the same DD analysis for the four education groups: illiterate, primary school, junior high school, and higher education (senior high school and above). The estimation results are reported in Table 7 and plotted in Figures 10-12.
Figures 10 and 11 clearly show that the probability of having a second child decreases with the educational attainment of women for all of the birth cohorts, and for both the
Han and the minorities. The average probability of aHan woman having a second child for
the post-treatment cohorts falls from 75.9 percent in the illiterate subsample to a mere 17.9 percent in the higher education subsample. The pattern for minority women is similar, with the average probability dropping from 61.5 to 28.2 percent.
Our DD analysis indicates that the one-child policy indeed has a larger effect for women
with a higher level of education. Figure 12 shows that the difference between the Han and
minority women increases with education. Of the four lines, the line for the illiterate group is on top and is the flattest. The slope of the lines increases with education, and the line for the higher education group is at the bottom and is the steepest. The DD estimates that are reported in Table 7 give the details of how the effect of the one-child policy increases with education. The policy appears to have a marginal impact on the least-educated group, with the average effect on the post-treatment cohorts (1943-1970) being just slightly below zero for the illiterate group (-0.8 percentage points, column 1). However, for women with
a better education, the policy has been more effective in lowering fertility. As is shown in columns 2-4, the average effect is -4.4 percentage points for the primary school group, -12.6 points for the junior high school group, and -15.5 points for the higher education group. At
least for these cohorts, improvements in education make Han women more likely to comply
with the one-child policy.24 Interestingly, the peak of the treatment effect still occurs at the
1958-1959 cohorts in all of the subsamples.
5.6
Effect by Education Level and Area
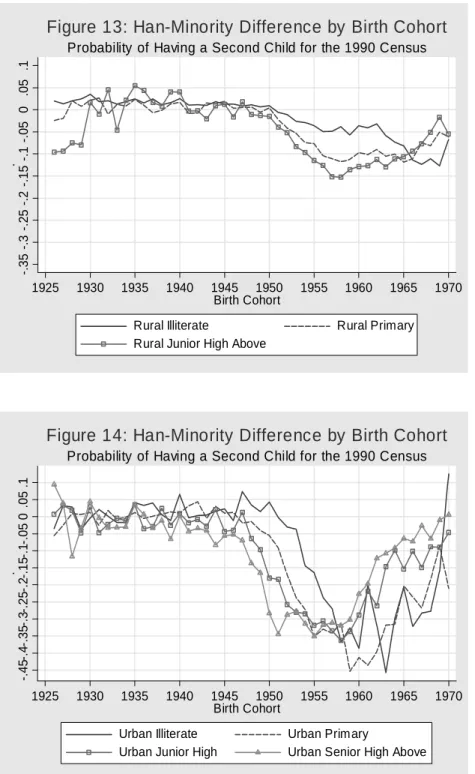
Considering the rural-urban discrepancy that we discussed earlier in this section, it is possible that the role of education may depend on the place of residence. In particular, the variation in complying with the one-child policy among education groups may be smaller in urban areas, as the policy is implemented more strictly there, which means that there is little difference in the punishments for less educated women and for more educated women. We try to tackle this issue by examining the effect of the birth control policy by education group for the rural and urban subsamples. The results for the rural subsample are presented in
Table 8 and Figure 13,25 and the results for the urban subsample are reported in Table 9
and Figure 14.
Education plays a significant role in changing the treatment effect of the birth control policy in rural areas. Figure 13 looks similar to Figure 12, although the gaps between the different education groups are smaller. As shown in Table 8, the average treatment effect for the 1943-1970 cohorts is -0.9 percentage points for the illiterate group, -4.0 points for the primary school group, and -11.3 points for the junior high school and above group, a pattern that is consistent with that in the previous subsection. This implies that in rural China, the effect of the birth control policy also differs according to a woman’s education attainment, but
both the magnitudeper se and the variation that is generated by the education attainment
24Our finding is consistent with that of Zhang and Spencer (1992), who, using micro-level data, show that the probability of signing the one-child certificate (complying with the policy) increases with education.
25As the observations of women with a higher education level are rare (less than 4 percent) in the rural subsample, only three education levels are defined: illiterate, primary school, and junior high school and above.
is not as large as it is for the whole sample. This finding suggests that much of the difference across education groups is in fact the difference between the rural and urban areas.
The role of education becomes weaker in urban areas. The four lines in Figure 14 are very close to each other for the post-treatment cohorts, which suggests that the difference in policy effect across education groups is smaller. The average treatment effect, as reported in Table 9, is -2.3 percentage points for the illiterate group, -10.5 points for the primary school group, -16.3 points for the junior high school group, and -15.4 points for the higher education group. Although the magnitude increases with education across the lower three groups, the top education group (column 4) appears to have a smaller effect compared to the junior high school group (column 3), but if we focus on the relatively earlier cohorts (1945-1959), the effect of the one-child policy again shows a clear increasing trend with education.
6
Robustness Check
In this section, we test the robustness of our main estimates of the effect of the one-child policy on fertility. The key assumption of the DD method is that without the one-child
policy, the changes in the fertility of the Han and the minorities would have been the same
between 1979 and 1990. One may be concerned with the extent to which this assumption holds. If there are other policy shocks or changes in social-economic variables in the same
period that have affected the fertility behavior of the Han and the minorities differently,
then the DD method may have picked up these effects. A priori, we do not know of any
such shocks or variables that are different by design for the Hanand the minorities, but we
can test the validity of our key assumption by conducting some robustness checks.
One way to test the robustness of the DD estimates is to directly examine whether other household decision variables, which may reflect parental preference and the opportunity costs of children but are not likely to be affected by the one-child policy, have changed differently
for the Han and the minorities during the treatment period. If there are other policies
costs of children of theHanChinese more than the minorities in the post-treatment cohorts, then the DD estimator should pick up these effects when using these alternative household decision variables as dependent variables in Equation (2). To make our DD estimator of second birth behavior valid, we need to make sure that the estimates for these alternative dependent variables are not very large.
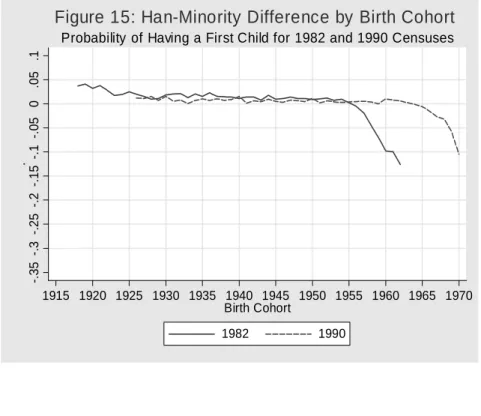
To this end, we use the dummies for having a first child and getting married as alterna-tive dependent variables. To a large extent, having a first child and getting married should not have been directly affected by the one-child policy, at least for the birth cohorts who had already got married or had their first child by the time the policy came into force. For the very late cohorts, there may be a feedback effect, in that those who knew that they could not have a second child may have married late or had their first child late. This feedback effect means that, even without other policy shocks or changes in social-economic variables, there may still be a DD effect for marriage and first child behavior. Given this potential feedback effect, which tends to increase the estimates, if our estimates of these alternative dependent variables are still small, then we should be confident that our DD estimator is not picking up the effect of other policy shocks or changes in social-economic variables. However, if the estimates are large, especially for the earlier post-treatment cohorts, then we should be concerned that our estimator is picking up other effects.
The regression results that are reported in Table 10 seem to suggest that our estimates of the effect of the one-child policy may not be mainly driven by other factors. As most women in our restricted sample (household head or spouse of household head) are married, we expand the sample to include all women between the ages of 20 and 64 for the marriage equation. For the probability of having a first child or being married, the estimates are very small for most of the 1943-1970 cohorts, and the signs of the estimates vary across cohorts. The average effects over 1943-1970 are even positive (0.001 in the case of having a first child and 0.007 in the case of being married). These estimates suggest that for most of the cohorts for which a large effect of the one-child policy on the probability of having a second
child has been identified, there is almost no cross-cohort change in the gap between the Han and the minorities in the probability of getting married or having a first child. That the negative effects on having a first child and being married are significant for only the very late cohorts (1964-1970 for having a first child and 1967-1970 for getting married) suggests
that the minorities are more likely to get married and have a first child than the Han, but
only among very young women.
The same implications can be drawn from Figures 15 and 16. In Figure 15, we plot the
difference between the Han and the minorities in having a first child for both the 1982 and
1990 censuses. Note that the two lines look almost the same, except that the 1990 line is a shift of the 1982 line to the right by exactly eight years. The two lines for the differences in being married in Figure 16 also exhibit the same pattern, except that the shift is about 10 years. These figures suggest little change in the difference in getting married or having a first child across cohorts, meaning that there is almost no detectable change in the preference of women or the opportunity cost of children, especially among women who were most affected by the one-child policy.
7
Conclusions
In this paper, we measure the effect of China’s one-child policy on fertility. China’s affirma-tive birth control policy provides us with a natural experiment that allows us to identify the effect on fertility that resulted from the enactment of the policy. Such natural experiments are rare, whether for the analysis of effects on fertility, or for economic analysis in general.
Employing two rounds of the Chinese Population Census, we find that the one-child policy has had a large effect on fertility. The average effect on the post-treatment cohorts (1943-1970) is as large as -11.0 percentage points in 1990. We also find that the magnitude of the effect is not uniform across the population. The one-child policy has had almost no effect on fertility for the rural illiterate group, but has been as large as -30 percentage points for some urban cohorts with a higher education. Our robustness tests suggest that our DD
estimates of the effect of the one-child policy are not mainly driven by other factors, such as other policies or economic shocks that have changed the fertility preference and costs of
children differently for the Han and the minorities.
Ever since its inception in the late 1970s, China’s one-child policy has been contro-versial, and has drawn attention from politicians, the mass media, and academics. More importantly, the policy affects the lives of more than one billion people, which makes mea-suring its effect very important in its own right. Even if we ignore the other positive and negative aspects of forced birth control policies, the one-child policy still has a mixed effect on economic development. On the one hand, as is shown by Li and Zhang (2005), the popu-lation reduction as a result of the dramatic popupopu-lation control policy has indeed helped the growth of the Chinese economy since the late 1970s. On the other hand, as is found in this paper, the imposition of the one-child policy may perpetuate or even exacerbate inequality. Does China still need the one-child policy after 26 years of implementation? What are the effects of the policy on many important aspects of China and the Chinese economy, such as the sex ratio, the family structure, the marriage market, old-age support, labor supply, and child quality? To answer these questions and to better understand the effect of the one-child policy, more studies are badly needed.
References
Ahn, Namkee, “Effects of the one-child policy on second and third births in Hebei, Shaanxi and Shanghai,” Journal of Population Economics 7, 1994, 63-78.
Anderson, Barbara and Brian Silver, “Ethnic differences in fertility and sex ratios at birth in China: evidence from Xinjiang,” Population and Development Review 49(2), 1995, 211-226.
Angrist, Joshua and William Evans, “Children and their parent’s labor supply: Evidence from exogenous variation in family size,” American Economic Review 88(3), 1998, 450-477.
Angrist, Joshua and Alan Krueger, “Does compulsory school attendance affect schooling and earnings?” Quarterly Journal of Economics 106(4), 1991, 979-1014.
--, “Empirical strategies in labor economics,” in Orley Ashenfelter and David Card eds. Handbook of Labor Economics, Volume 3A, Amsterdam: North-Holland, 1999.
Ashenfelter, Orley and Alan Krueger, “Estimating the returns to schooling using a new sample of twins,” American Economic Review 84(5), 1994, 1157-1173.
Banister, Judith, China’s Changing Population, Stanford: Stanford University Press, 1987.
Becker, Gary, A Treatise on the Family, Cambridge: Harvard University Press, 1991.
Behrman, Jere and Mark Rosenzweig, “Returns to births weight,” Review of Economics and Statistics 86(2), 2004, 586-601.
Behrman, Jere and Barbara Wolfe, “A More general approach to fertility determination in a developing country: the importance of biological supply
considerations, endogenous tastes and unperceived jointness,” Economica 51(203), 1984, 319-339.
Birdsall, Nancy, “Economic approaches to population growth,” in Hollis Chenery and T.N. Srinivasan eds. Handbook of Development Economics. North Holland,
Amsterdam, 1988.
Central Committee of the Communist Party of China (CCCPC), “Reports on the implementation of the birth control policy,” Beijing, China, 1984.
Cheng, L. F., M. Z Wang, W. Y. Yang, “An epidemiological and clinical survey of infertility problems in Henan Province,” Reproduction and Contraception (in Chinese) 12(2), 1992, 51–55.
Chow, Gregory C., “China's population problems and policy,” mimeo, Princeton University, 2002.
Croll, Elisabeth, Chinese Women Since Mao, London: Zed Books, 1983.
Dasgupta, Partha, “The population problem: Theory and evidence,” Journal of Economic Literature 33, 1995, 1879-1902.
Deng, Hongbi, Population Policies Toward Ethnic Minorities in China, Chongqing: The Chongqing Press, 1995.
Graham, Maureen, Ulla Larsen and Xiping Xu, “Son preference in Anhui Province, China,”
International Family Planning Perspective 24(2), 1998, 72-77.
Guangxi Autonomous Government, “Rules on birth control in Guangxi Autonomous Region,” Nanning, China, 1988.
Hardee-Cleaveland, Karen and Judith Banister, “Fertility policy and implementation in China, 1986-88,” Population and Development Review 14(2), 1988, 245-286.
Jain, Anrudh K, “The effect of female education on fertility: A simple explanation,”
Demography 18, 1981, 577-596.
Johnson, D. Gale, “Effects of institutions and policies on rural population growth with application to China,” Population and Development Review 20(3), 1994, 503-531.
Li, Jiali, “China's one-child policy: how and how well has it worked? A case study of Hebei Province, 1979-88,” Population and Development Review 21(3), 1995, 563-585.
Li, Hongbin and Junsen Zhang, “Fines, limited liability and fertility,” 2004, mimeo, The Chinese University of Hong Kong.
--, “Do high birth rates hamper economic growth?” 2005, mimeo, The Chinese University of Hong Kong.
Liu, Jihong, Ulla Larsen and Grace Wyshak, “Prevalence of primary infertility in China: In-depth analysis of infertility differentials in three minority province/autonomous regions,”
Journal of Biosocial Science 37, 2005, 55-74.
Martin, Castro T, “Women's education and fertility: Results from 26 demographic and health surveys,” Studies in Family Planning 26(4), 1995, 187-202.
McElroy, Marjorie and Dennis Tao Yang, “Carrots and sticks: fertility effects of China's population policies,” American Economic Review (Papers and Proceedings) 90(2), 2000, 389-392.
Park, Chai Bin and Jing-qing Han, “A minority group and China’s one-child policy: the case of the Koreans,” Studies in Family Planning 21(3), 1990, 161-170.
Peng, Peiyun, Encyclopedia of Birth Control Policies in China, Beijing: The People's Press, 1996.
Qian, Zhenchao, “Progression to second birth in China: A study of four rural counties,”
Population Studies 51(2), 1997, 221-228.
Ray, Debraj, Development Economics, Princeton: Princeton University Press, 1998.
Rosenzweig, Mark and Kenneth Wolpin, “Testing the quantity-quality fertility model: the use of twins as a natural experiment,” Econometrica 48(1), 1980, 227-240.
--, “Natural ‘natural experiments’ in economics,” Journal of Economic Literature 38(4), 2000, 827-874.
Rosenzweig, Mark and Paul Schultz, “The demand for and supply of births: fertility and its life cycle consequences,” American Economic Review 75(5), 1985, 992-1015.
Short, Susan and Fengying Zhai, “Looking locally at China's one-child policy,” Studies in Family Planning 29(4), 1998, 373-387.
Tu, X., E. S. Gao, Y. Liu and C. Lou, “A study on the determinants of primary infertility among first-married women (in Chinese),” in Collection of Papers Using Data from the 1997 National Survey on Population and Reproductive Health, China Population Publisher, Beijing, 2000, 232–237.
Wang, Feng, “The roles of individuals' socioeconomic characteristics and the government family planning program in China's fertility decline,” Population Research and Policy Review 7, 1988, 255-276.
--, “China’s one-child policy. Who complies and why?” Paper presented at the Association for Asian Studies Meetings, March 17-19, 1989, Washington DC.
Whittington, Leslie, James Alm and Elizabeth Peters, “Fertility and the personal exemption: Implicit pronatalist policy in the United States,” American Economic Review 80(3), 1990, 545-556.
Zhang, Junsen, “Socioeconomic determinants of fertility in Hebei Province, China: An application of the sequential logit model,” Economic Development and Cultural Change 43, 1994, 67-90.
Zhang, Junsen, Jason Quan and Peter Van-Meerbergen, “The effect of tax-transfer policies on fertility in Canada, 1921-88.” Journal of Human Resources 29(1), 1994, 181-201.
Zhang, Junsen and Byron Spencer, “Who signs China’s one-child certificate, and why?” Journal of Population Economics 5, 203-215, 1992.
.1 .2 .3 .4 .5 .6 .7 .8 .9 1 . 1915 1920 1925 1930 1935 1940 1945 1950 1955 1960 1965 1970 Birth Cohort
W hole Sample for the 1982 Census
Figure 1: Probability of Having a Second Child
.1 .2 .3 .4 .5 .6 .7 .8 .9 1 . 1915 1920 1925 1930 1935 1940 1945 1950 1955 1960 1965 1970 Birth Cohort 1982 1990
W hole Sample for 1982 and 1990 Censuses Figure 2: Probability of Having a Second Child
.1 .2 .3 .4 .5 .6 .7 .8 .9 1 . 1915 1920 1925 1930 1935 1940 1945 1950 1955 1960 1965 1970 Birth Cohort Han 1982 Han 1990
Han Sample for 1982 and 1990 Censuses
Figure 3: Probability of Having a Second Child
.1 .2 .3 .4 .5 .6 .7 .8 .9 1 . 1915 1920 1925 1930 1935 1940 1945 1950 1955 1960 1965 1970 Birth Cohort Minority 1982 Minority 1990
Minority Sample for 1982 and 1990 Censuses
-. 3 5 -. 3 -. 2 5 -. 2 -. 1 5 -. 1 -. 0 5 0 .05 .1 . 1915 1920 1925 1930 1935 1940 1945 1950 1955 1960 1965 1970 Birth Cohort
Probability of Having a Second Child for the 1982 Census Figure 5: Han-Minority Difference by Birth Cohort
-. 3 5 -. 3 -. 2 5 -. 2 -. 1 5 -. 1 -. 0 5 0 .05 .1 . 1915 1920 1925 1930 1935 1940 1945 1950 1955 1960 1965 1970 Birth Cohort 1982 1990
Probability of Having a Second Child for 1982 and 1990 Censuses Figure 6: Han-Minority Difference by Birth Cohort
0 .1 .2 .3 .4 .5 .6 .7 .8 .9 1 . 1925 1930 1935 1940 1945 1950 1955 1960 1965 1970 Birth Cohort Rural Urban Han Sample for the 1990 Census
Figure 7: Probability of Having a Second Child
.1 .2 .3 .4 .5 .6 .7 .8 .9 1 . 1925 1930 1935 1940 1945 1950 1955 1960 1965 1970 Birth Cohort Rural Urban Minority Sample for the 1990 Census Figure 8: Probability of Having a Second Child
-. 3 5 -. 3 -. 2 5 -. 2 -. 1 5 -. 1 -. 0 5 0 .05 .1 . 1925 1930 1935 1940 1945 1950 1955 1960 1965 1970 Birth Cohort Rural Urban
Probability of Having a Second Child for the 1990 Census Figure 9: Han-Minority Difference by Birth Cohort
0 .1 .2 .3 .4 .5 .6 .7 .8 .9 1 . 1925 1930 1935 1940 1945 1950 1955 1960 1965 1970 Birth Cohort
Illiterate Primary School Junior High School Senior High School Above
Han Sample for the 1990 Census
Figure 10: Probability of Having a Second Child
0 .1 .2 .3 .4 .5 .6 .7 .8 .9 1 . 1925 1930 1935 1940 1945 1950 1955 1960 1965 1970 Birth Cohort
Illiterate Prim ary School Junior High School Senior High School Above
Minority Sample for the 1990 Census
Figure 11: Probability of Having a Second Child
-. 3 5 -. 3 -. 2 5 -. 2 -. 1 5 -. 1 -. 0 5 0 .0 5 .1 . 1925 1930 1935 1940 1945 1950 1955 1960 1965 1970 Birth Cohort
Illiterate Prim ary School Junior High School Senior High School Above Probability of Having a Second Child for the 1990 Census Figure 12: Han-Minority Difference by Birth Cohort
-. 3 5 -. 3 -. 2 5 -. 2 -. 1 5 -. 1 -. 0 5 0 .05 .1 . 1925 1930 1935 1940 1945 1950 1955 1960 1965 1970 Birth Cohort
Rural Illiterate Rural Primary Rural Junior High Above
Probability of Having a Second Child for the 1990 Census Figure 13: Han-Minority Difference by Birth Cohort
-. 4 5-. 4 -. 3 5-. 3-. 2 5 -. 2-. 1 5-. 1-. 0 5 0 .0 5 .1 . 1925 1930 1935 1940 1945 1950 1955 1960 1965 1970 Birth Cohort
Urban Illiterate Urban Primary
Urban Junior High Urban Senior High Above
Probability of Having a Second Child for the 1990 Census Figure 14: Han-Minority Difference by Birth Cohort
-. 3 5 -. 3 -. 2 5 -. 2 -. 1 5 -. 1 -. 0 5 0 .0 5 .1 . 1915 1920 1925 1930 1935 1940 1945 1950 1955 1960 1965 1970 Birth Cohort 1982 1990
Probability of Having a First Child for 1982 and 1990 Censuses Figure 15: Han-Minority Difference by Birth Cohort
-. 3 5 -. 3 -. 2 5 -. 2 -. 1 5 -. 1 -. 0 5 0 .05 .1 . 1915 1920 1925 1930 1935 1940 1945 1950 1955 1960 1965 1970 Birth Cohort 1982 1990
Probability of Being Married for 1982 and 1990 Censuses Figure 16: Han-Minority Difference by Birth Cohort