Behind the Curtain – Cellular DNS and Content Replica
Selection
John P. Rula
Northwestern University
Fabián E. Bustamante
Northwestern UniveristyABSTRACT
DNS plays a critical role in the performance of smartdevices within cellular networks. Besides name resolution, DNS is commonly relied upon for directing users to nearby content caches for better performance. In light of this, it is surprising how little is known about the structure of cellular DNS and its effectiveness as a client localization method.
In this paper we take a close look at cellular network DNS and uncover several features of cellular DNS, such as cellular network opaqueness and client to resolver inconsistency, that make it unsuitable for client localization in modern cellular networks. We study these issues in two leading mobile network markets – US and South Korea – using a collection of over 340 volunteer devices to probe the DNS infrastructure of each client’s cellular provider.
We show the extent of the problem with regards to replica selec-tion and compare its localizaselec-tion performance against public DNS alternatives. As a testament to cellular DNS’s poor localization, we find surprisingly that public DNS can render equal or better replica performance over 75% of the time.
Categories and Subject Descriptors
C.2 [Computer-Communication Networks]: Distributed Sys-tems—Distributed Applications; C.4 [Performance of Systems]: Measurement techniques
General Terms
Experimentation; Measurement; Performance
Keywords
Cellular DNS; Content Delivery Networks; Domain Name System
1.
INTRODUCTION
Smartdevices are becoming the primary or only Internet point of access for an ever larger fraction of users. Nearly a quarter of current web traffic is mobile, and recent industry studies have estimated a fourfold increase in global mobile data traffic by 2018,
http://dx.doi.org/10.1145/2663716.2663734.
mainly driven by data demands and the growing number of smart phones and tablets [7].
Content delivery networks (CDNs) are responsible for delivering most of today’s Internet data. CDNs replicate popular content on servers worldwide and redirect users to “nearby” replica servers on demand. The Domain Name System (DNS) is instrumental in this process since CDN redirection, and thus the performance of content delivery, is typically based on the location of users’ DNS resolvers [25].
Considering the importance of content and the critical role of DNS for both name resolution and localization in today’s networks, it is somewhat surprising how little is known about the infrastructure and configuration of cell network DNS and its impact on content distribution. The 2011 study of Xu et al. [25] is today’s most comprehensive analysis of (the US) cellular network infrastructure, combining data from DNS logs, smartphone users and server logs. For the radio technologies in their study – 3G UTMS and EVDO – the authors point out the dominant role of radio latency and the limited number of network ingress points. They conclude that, in that setting, the best option for content providers is to locate servers close to these ingress points and that, given the restricted routing in these cellular networks, choosing content servers based on local DNS servers is sufficiently accurate. The recent growth of 4G access technologies [7, 12], such as LTE, radically changes the scene. Around the world service providers are busy rolling out 4G networks to meet users’ increas-ing demand for faster, higher bandwidth connections. The most recent CISCO VNI report estimates that by 2018, the majority of North America devices and connections will have 4G capability. While 4G will be 15% of world-wide connections then, these connections will be responsible for 51% of traffic. When com-pared with 3G networks, 4G LTE presents a significantly different network, with a radically larger number of ingress points, and offers much lower radio access latency and variance.We show that these changes make accurate content replica selection critical to the performance of end users in cellular networks.
In this paper, we take a close look at cellular network DNS and replica selection in the two fastest growing 4G LTE markets – US and South Korea [12]. Using a collection of more than 280,000 experiments from over 340 globally distributed mobile devices, we probe the DNS infrastructure of each client’s cellular provider and the content replicas they are redirected toward.
Our analysis shows the impact of network opaqueness and client-to-resolver inconsistency on the performance of content delivery in next generation mobile networks. As part of our study, we compare client/replica mappings through cellular DNS with those achieved through public DNS alternatives. We show that, in contrast to wired networks and despite providers’ knowledge of clients’ Permission to make digital or hard copies of all or part of this work for personal
or classroom use is granted without fee provided that copies are not made or distributed for profit or commercial advantage and that copies bear this notice and the full citation on the first page. Copyrights for components of this work owned by others than the author(s) must be honored. Abstracting with credit is permitted. To copy otherwise, or republish, to post on servers or to redistribute to lists, requires prior specific permission and/or a fee. Request permissions from [email protected].
IMC’14, November 5–7, 2014, Vancouver, BC, Canada
Copyright is held by the owner/author(s). Publication rights licensed to ACM. ACM 978-1-4503-3213-2/14/11…$15.00.
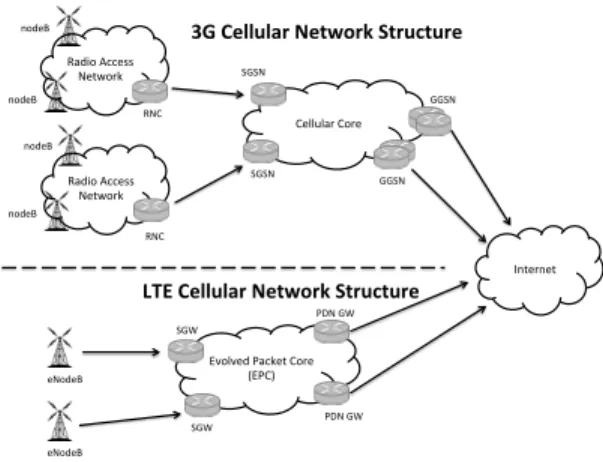
Radio Access Network Cellular Core SGSN SGSN GGSN GGSN Internet Radio Access Network RNC RNC nodeB nodeB nodeB nodeB
Evolved Packet Core (EPC) eNodeB SGW eNodeB SGW PDN GW PDN GW
3G Cellular Network Structure
LTE Cellular Network Structure
Figure 1: Network architecture changes cellular networks between 2/3G and LTE networks. LTE introduces a simpler, flatter network structure and an all-IP network.
locations, public DNS and the DNS of cell network providers yield comparable performance for replica selection.
In summary, our major contributions are:
• After describing our data sources and data collection method-ology in Section 3, we detail the results of our investigation into cellular network DNS structure and behavior in Sec-tion 4.
• We present the first analysis of the interaction between cellular DNS and content replica selection in 4G networks in Section 5.
• We present the first comparison between cellular DNS and public DNS in resolution and replica selection performance in Section 6
We discuss the impact of cellular provider DNS and our finding’s implications in content delivery networks in Section 7. We review closely related work in Section 8 and conclude in Section 9. We are making all our data available to the community from our project website.1
2.
BACKGROUND AND MOTIVATION
In this section, we give an overview of current cellular infras-tructure, the changes ongoing across cellular networks as they transition toward Long-Term Evolution (LTE) networks, and how these changes point toward the need for more intelligent replica selection for cellular devices.
2.1
Cellular Network Architecture
LTE has been growing rapidly since its entering the market in 2009. Service providers are busy rolling out 4G LTE net-works to meet users’ increasing demand for faster, higher band-width connections. LTE promises speeds up 150/75 Mbps of downstream/upstream throughput, significantly faster than what is possible in existing 3G networks. The 2014 CISCO VIN report estimates that, by 2018, the majority of North America devices and connections will have 4G capability. Transitioning to
1
http://aqualab.cs.northwestern.edu/projects/atolls
LTE technologies requires cellular operators to make substantial changes to their core networks, flattening their architectures and moving to an all-IP network. For example, LTE introduces an enhanced radio access component, the eNodeB, which removes the need for previous hierarchical structures such as the Radio Network Controller (RNC) by combining its functionality into a single node. These changes are illustrated in Figure 1. LTE also requires operators to switch over to the Evolved Packet Core (EPC), which requires an all-IP network [6], reducing the need for legacy, circuit based technologies.
Perhaps more relevant for content delivery, 4G LTE cellular networks are increasing the number of ingress/egress locations for cellular traffic. Prior work looking at cellular network structure concluded that CDNss had limited options from outside the cellular network to improve user experience [25]. The significant fraction of radio latency, combined with the limited number of ingress points into the cellular network, meant that CDNs had little control over user end-to-end latency. The significantly larger number of ingress points, a trend clear in Zarifis et al. [26] and in our own results (Section 5), means that CDNs have more options for placing and choosing content caches. These architectural changes and the radical improvements in radio access technology, suggest it is time to revisit the effectiveness of content delivery and the impact of DNS-based server selection in cellular networks.
2.2
Mobile Content Delivery
CDNs host and deliver the large majority of the mobile web content and, as in the wired Internet, most CDNs use the local DNS resolver (LDNS) of clients to locate them and find nearby replica servers for content delivery.
When a client requests an object hosted by a CDN, the client’s local DNS resolver contacts the authoritative DNS (ADNS) of the domain name run by the CDN. The CDN uses the location of the client’s DNS resolver as an approximate location for the client, and redirects the client to content servers nearby. In wired networks, this approach has been shown to be sufficiently accurate except when paired with certain ISP configurations or the use of public DNS services [18].
In cellular networks, however, CDNs have limited client network localization information. Firewall and NAT policies of cellular operators prohibit external entities like CDNs from probing clients or infrastructure in their network. Even if these policies did not exist, Balakrishnan et al. [3] showed the failure of IP-based identification and geolocation in cellular networks, due in part to the ephemeral and itinerant nature of mobile client’s IPs – IPs assignment change rapidly and similar IPs are assigned to geographically distant devices.
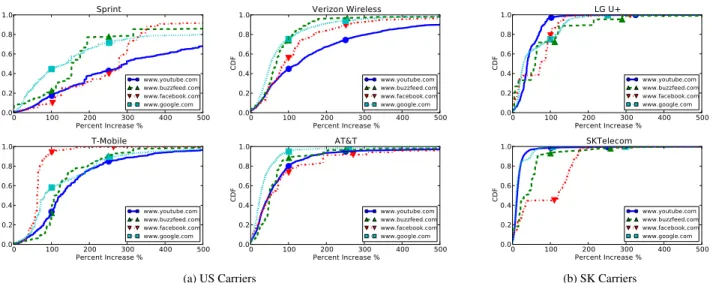
Our experiments uncovered a wide range of performance results across the CDN replicas seen by clients in cellular networks. Fig-ure 2 clearly shows this as the CDF of the differential performance of replica HTTP latency (time-to-first-byte) when accessing four different domains. The CDFs show, for various US and South Korean carriers, the difference between each replica observed by clients to their best seen replica.
While the degree of replica differential performance varies based on carrier and domain, we find replica latency increases ranging from 50% to 100% in all networks. In an extreme case, we find clients experiencing over 400% increases in latency in over 40% of the access to some key web sites.
3.
METHODOLOGY OVERVIEW
Our analysis is based on data collected by end-user devices through two mobile apps sharing a common measurement
exper-0 100 200 300 400 500 Percent Increase % 0.0 0.2 0.4 0.6 0.8 1.0 CDF Sprint www.youtube.com www.buzzfeed.com www.facebook.com www.google.com 0 100 200 300 400 500 Percent Increase % 0.0 0.2 0.4 0.6 0.8 1.0 CDF Verizon Wireless www.youtube.com www.buzzfeed.com www.facebook.com www.google.com 0 100 200 300 400 500 Percent Increase % 0.0 0.2 0.4 0.6 0.8 1.0 CDF T-Mobile www.youtube.com www.buzzfeed.com www.facebook.com www.google.com 0 100 200 300 400 500 Percent Increase % 0.0 0.2 0.4 0.6 0.8 1.0 CDF AT&T www.youtube.com www.buzzfeed.com www.facebook.com www.google.com (a) US Carriers 0 100 200 300 400 500 Percent Increase % 0.0 0.2 0.4 0.6 0.8 1.0 CDF LG U+ www.youtube.com www.buzzfeed.com www.facebook.com www.google.com 0 100 200 300 400 500 Percent Increase % 0.0 0.2 0.4 0.6 0.8 1.0 CDF SKTelecom www.youtube.com www.buzzfeed.com www.facebook.com www.google.com (b) SK Carriers
Figure 2: Client observed performance of all replica servers seen. For each user in our dataset, each replica is represented as the percent increase in mean latency of each server compared to the “best” replica seen by that user. Users are consistently directed towards replica servers with latencies 100% greater than other existing replicas.
Carrier # Clients Country
AT&T 33 US Sprint 9 US T-Mobile 31 US Verizon 64 US SKTelecom 17 SK LG U+ 4 SK
Table 1: Distribution of measurement clients for the mobile operators profiled in our paper.
imentation library. The following paragraphs describe our mea-surement platform, experiments and meamea-surement methodology.
3.1
Data Sources
The measurements used in this paper come from over 348 glob-ally distributed Android mobile clients running our measurement application. The data was collected from two mobile applications posted to Google’s Play Store, each packaged with the same network measurement library. For the purpose of this paper, we restricted our dataset to the 158 clients reporting to be in the top four cellular providers within the US, Sprint, Verizon Wireless, T-Mobile and AT&T, along with two large South Korean carriers, SK Telecom and LG U+. The number of clients distributed within each of these operators is given in Table 1. These markets were chosen due to the prevalence of LTE coverage, and the large volume of 4G traffic within their networks [12]. Our measurements cover a five month period between March 1, 2014, and August 1, 2014.
In all, our dataset consists of over 280,000 individual experi-ments, totaling over 8.1 million DNS resolutions, and 2.4 million pings, traceroutes and HTTP GET requests from mobile end hosts.
3.2
Experiment Description
Each device ran the specified experiment in the background, approximately once per hour. Taking into account the performance characteristics of different radio states in LTE devices [11], each experiment begins with a bootstrap ping to wake the radio up and mitigate any state promotion delay from the radio. Our experiment
Mobile domains m.yelp.com www.youtube.com www.facebook.com www.google.com www.yahoo.com www.answers.com www.buzzfeed.com www.upworthy.com
Table 2: List of popular sites measured.
scripts are also designed to run continually and as quickly as possible to maintain the radio in a high power state. For the data presented in this paper, each experiment consist of the following:
• DNS resolutions for 9 popular mobile domains. The domains were chosen given their popularity and because their DNS resolution initially resulted in a canonical name (CNAME) record, indicating the use of DNS based load balancing and server selection. Table 2 list the different domains measured. These were conducted for the locally configured resolver, as well as public DNS services Google DNS and OpenDNS. • Ping and traceroute probes to each replica server IP address
returned from the previous resolutions. An HTTP GET request is also sent to each replica IP returned for the index page at that address.
• Resolution of clients’ resolver IP addresses. The IPs are found, as in Mao et al. [16], by using an authoritative DNS (ADNS) for a subdomain of our research group’s website. The IP address of the client’s resolver is returned in the answer section of the response. These are conducted for locally configured resolver and public DNS resolvers for GoogleDNS and OpenDNS.
• Ping and traceroute probes to each IP address returned by our ADNS. In the case of the device’s locally configured re-solver, we ran additional probes to the IP address configured
on the device as well as to the one returned by our ADNS, since they differed inallcases we measured.
3.3
Isolating Mobile Context and Performance
Issues
We now describe some of the techniques used for mitigating device context and performance variation seen in network mea-surements from mobile devices [8]. Our comparison of content replicas is based on the latency from mobile devices to the content replicas they find. Each series of measurements described in the previous section are captured as a discrete experiment, with all measurements listed being taken at approximately the same time and within the device context.
We use ping latency, rather than throughput based measurements like page load time, to compare replica servers in light of previous work by Gember et al. [8] which showed that the former are more stable and less affected by changes in user context than the latter.
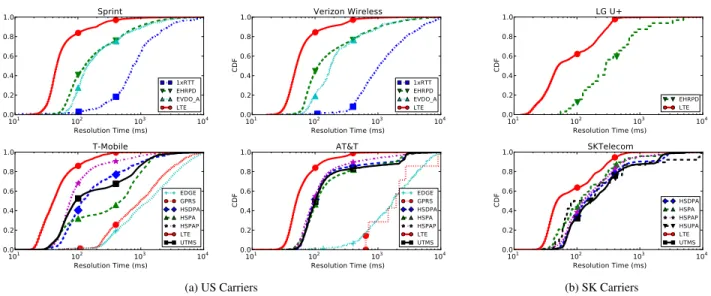
Current mobile devices are equipped with multiple radio tech-nologies (i.e. LTE, HSPA, UTMS), each of which offer different levels of performance. For example, 7 different radio technologies were reported from users within both AT&T and T-Mobile, each showing different performance characteristics. Our focus on LTE and LTE’s performance characteristics also helps control for these variations. LTE performance has been shown to provide much lower and more stable radio access latency than previous wireless technologies [11]. Figure 3 illustrates the performance and stability of LTE connections.
These figures show the performance of different radio technolo-gies on domain name resolution performance for devices in four different US and two South Korean carriers. The different radio technologies present very distinct bands of performance, following the expected trend with newer generation radios offering lower resolution time. For example, we see a consistent performance differential between 4G technologies like LTE and 3G technologies like EHRPD and EVDO Rev. A, around 50ms at the median for both Sprint and Verizon CDMA networks. The figures also show the poor performance of 2G radio technologies like 1xRTT, taking nearly 1 second to complete a domain name resolution.
4.
CELLULAR DNS CHARACTERIZATION
In this section, we present results of our characterization of the DNS infrastructure of four major US and two South Korean cellular providers. We find an indirect DNS resolver structure, with separate client-facing and external-facing resolvers, in all of the cellular networks we investigated. We evaluate the performance of cellular DNS resolution, and show that its performance under LTE is comparable to that of current residential broadband connections. We also examine the opacity of cellular LDNS resolvers, finding that cellular network opaqueness extends to their DNS resolvers, both in their external reachability and in their inconsistent mapping to clients.
Throughout the experiments described in Section 3, we used DNS resolutions to our ADNS servers to return the visible LDNS resolver IP address to clients. Looking at these IP addresses, and comparing them with the IP addresses configured as device resolvers, we find the use ofindirectresolution techniques inall
observed networks, where the LDNS resolver seen by the client (client-facing) differs from the resolver seen by other entities. One of the concerns with indirect LDNS resolution is that it can further distance end-hosts from their visible local DNS resolver, and obfuscate information for CDNs.
Indirect LDNS resolution takes the form of anycasted DNS resolvers, LDNS Pools [2], and tiered resolver infrastructure. In an
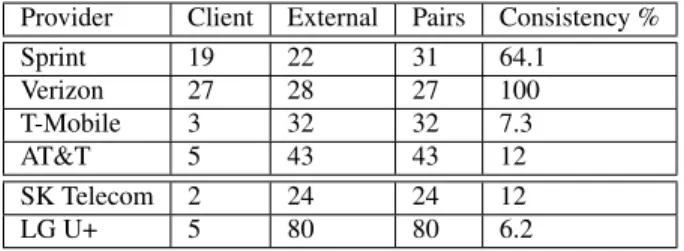
Provider Client External Pairs Consistency %
Sprint 19 22 31 64.1 Verizon 27 28 27 100 T-Mobile 3 32 32 7.3 AT&T 5 43 43 12 SK Telecom 2 24 24 12 LG U+ 5 80 80 6.2
Table 3: Number of LDNS Pairs seen by our mobile clients. Network structure and configuration varies by network in both the number of client facing and external facing resolvers, as well as the consistency of their pairings.
anycast DNS resolver setup, each client keeps the same IP address for a DNS resolver, regardless of their location. DNS queries are directed toward nearby DNS resolvers within the cellular network through anycast routing.
LDNS pools, as previously described by Azloubi et al. [2], consist of a collection of servers which load balance DNS requests within themselves. Unlike Azloubi et al., who detected the pres-ence of LDNS pools by seeing different resolvers for consecutive queries responding to a CNAME entry, we were able to identify LDNS pools by directly comparing the configured resolver on the mobile device with the IP address seen by our ADNS.
Finally, we observedtieredDNS servers, which exist as two separate public IP addresses, yet with one client resolver and one external facing resolver. These paired resolvers also differ in latency and traceroute hops from client probes. For example, tiered resolvers in Verizon’s network exist in entirely different ASes. Tiered resolvers may indicate a hierarchy of DNS resolvers within that operator’s network, however, we are only able to observe the end points from our experiments.
We recorded the grouping of observed client- and external-facing resolvers to understand the configuration and dynamics of cellular infrastructure and their DNS resolvers. We refer to each grouping as anLDNS Pair. We calculate the consistency of these resolver pairings as the percentage of our measurements in which the client- and external-facing resolvers are paired. The consistency of pairings captures the stability of mappings between clients, their locally configured resolver, and the external facing resolver. For example, a client resolver equally load balanced between two external resolvers would have a consistency of 50%.
4.1
Cellular DNS Infrastructure
In our characterization, we find different DNS configurations within each of the cellular providers studied.
While every cellular provider measured employs indirect resolu-tion techniques, their individual policies differ with regards to both the number of client-facing and external-facing DNS resolvers, and their consistency of pairings. Looking at the composition of LDNS pairings, we find several patterns emerging in DNS infrastructure configurations including the use of anycasted DNS, the presence of LDNS pools, and tiered DNS resolvers in separate ASes. A summary of each operator’s DNS infrastructure is given in Table 3. We observed the presence of LDNS pools within the Sprint’s network and the network of the two South Korean carriers. In each of these cases, all resolvers are public IP addresses, and all have pairs in which a client facing resolver is observed paired with multiple external resolver addresses. In the case of Sprint, each resolver maintains a fairly consistent mapping between client and external resolvers, over 60% of the time.
101 102 103 104 Resolution Time (ms) 0.0 0.2 0.4 0.6 0.8 1.0 CDF Sprint 1xRTT EHRPD EVDO_A LTE 101 102 103 104 Resolution Time (ms) 0.0 0.2 0.4 0.6 0.8 1.0 CDF Verizon Wireless 1xRTT EHRPD EVDO_A LTE 101 102 103 104 Resolution Time (ms) 0.0 0.2 0.4 0.6 0.8 1.0 CDF T-Mobile EDGE GPRS HSDPA HSPA HSPAP LTE UTMS 101 102 103 104 Resolution Time (ms) 0.0 0.2 0.4 0.6 0.8 1.0 CDF AT&T EDGE GPRS HSDPA HSPA HSPAP LTE UTMS (a) US Carriers 101 102 103 104 Resolution Time (ms) 0.0 0.2 0.4 0.6 0.8 1.0 CDF LG U+ EHRPD LTE 101 102 103 104 Resolution Time (ms) 0.0 0.2 0.4 0.6 0.8 1.0 CDF SKTelecom HSDPA HSPA HSPAP HSUPA LTE UTMS (b) SK Carriers
Figure 3: DNS resolution times for each cellular operator’s DNS, grouped by the radio technology active during the domain resolution. We see very defined performance boundaries between different radio technologies.
For South Korean carriers SK Telecom and LG U+, we observed 2 and 5 client configured LDNS resolver addresses and 24 and 89 publicly visible addresses, respectively. For these carriers, each client and external pair are contained within the same /24 prefix. In Sprint, however, we find a high degree of load balancing between external resolvers in Sprint’s network. We elaborate on the resolver consistency over time issue in Section 4.5.
Additionally, we found the use of anycasted DNS within AT&T’s and T-Mobile’s networks. Both carriers showed a limited number of configured DNS resolver addresses on client devices with a significantly larger number of publicly visible addresses indicating the use of IP anycast for resolvers. For example, a single AT&T address (172.26.38.1) in our measurements shows mapping to 40 external resolver addresses.
Verizon was the only cellular operator which maintained a 100% consistency between client and external facing resolvers. While both resolver locations were public IP addresses, we were unable to measure the distance between these resolver pairs due to unresponsive external resolver probes. However, each LDNS pair within Verizon exists in different ASes: 6167 for client facing resolvers and 22394 for external facing resolvers.
4.2
Cellular Resolver Distance
An important aspect of DNS in cellular networks is the net-work distance between clients and their corresponding resolver infrastructure. Distance to client facing resolvers is important for resolution performance, while distance to external facing resolvers has implications on content replica selection [18].
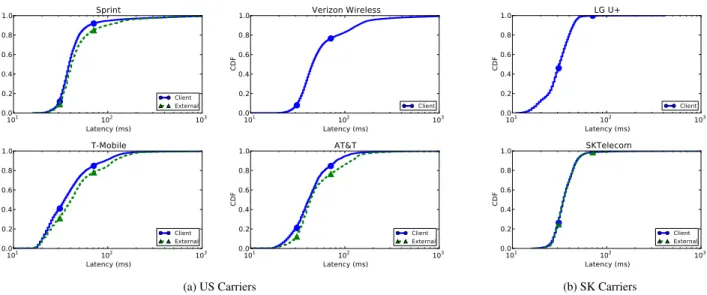
To capture the differences between both types of resolvers, clients were directed to issuepingprobes to the sets of resolvers during each experiment. Figure 4 plots the cumulative distribution of latencies to clients’ configured client facing resolver and external facing resolver. We see cases where both resolvers have nearly equal latencies indicating either identical machines or collocated resolvers, as is the case with SK Telecom. Resolvers in T-Mobile, Sprint and AT&T showed signs of distance between resolvers, revealing physical hierarchy of resolvers within their networks. We were unable to determine structural properties from latency measurements since only a minor fraction of external resolvers within Verizon and LG U+ networks responded to probes.
101 102 103 104 Resolution Time (ms) 0.0 0.2 0.4 0.6 0.8 1.0 CDF Verizon Wireless Sprint T-Mobile AT&T
Figure 5: DNS resolution time for US carriers measured from client devices for the 4 major US cellular providers.
While we recorded traceroutes to each client and external facing resolver found, we observed the use of widespread tunnelling within each cellular network (e.g. VPN or MPLS). This rendered irrelevant much of the structural information, such as hop distance, gathered by these probes.
4.3
Cellular DNS Performance
We now look at the resolution performance of each mobile client’s DNS provided from their cellular operator. We find DNS performance under LTE to be relatively consistent and comparable to DNS performance on wired broadband.
Figures 5 and 6 present, respectively, CDFs of resolution time for each of the four US carriers, and for the two South Korean carriers we studied. The figures show reasonable resolution performance for carriers in both markets, each having median resolution times between 30 and 50 ms. These numbers are comparable to resolution times within the wired Internet [1] for the lower 50th percentile.
Both South Korean carriers and T-Mobile exhibit bimodal be-havior above their 50th percentile, and the remaining operators show a long tail of resolution times above the 80th percentile. To determine measure the impact of resolver cache on resolution time tails, we conducted back to back queries, measuring the difference between the first and second DNS queries. The results, presented
101 102 103 Latency (ms) 0.0 0.2 0.4 0.6 0.8 1.0 CDF Sprint Client External 101 102 103 Latency (ms) 0.0 0.2 0.4 0.6 0.8 1.0 CDF Verizon Wireless Client 101 102 103 Latency (ms) 0.0 0.2 0.4 0.6 0.8 1.0 CDF T-Mobile Client External 101 102 103 Latency (ms) 0.0 0.2 0.4 0.6 0.8 1.0 CDF AT&T Client External (a) US Carriers 101 102 103 Latency (ms) 0.0 0.2 0.4 0.6 0.8 1.0 CDF LG U+ Client 101 102 103 Latency (ms) 0.0 0.2 0.4 0.6 0.8 1.0 CDF SKTelecom Client External (b) SK Carriers
Figure 4: Client latency to internal and external resolver locations. Ping latencies in Sprint, T-Mobile and AT&T reveal resolvers which are located in separate locations, with external resolvers located further away from clients. Although no external resolvers in either Verizon’s or LG U+’s networks responded to probes, client and external resolvers exist in separate ASes in the case of Verizon.
101 102 103 104 Resolution Time (ms) 0.0 0.2 0.4 0.6 0.8 1.0 CDF LG U+ SKTelecom
Figure 6: DNS resolution time for South Korean carriers measured from client devices for 2 major cellular providers.
in Figure 7, show cache misses accounting for additional delays approximately 20% of the time, similar to the bimodal behavior seen in Figures 5 and 6.
4.4
Cellular Network Opaqueness
Unlike related studies characterizing the behavior and structure of wired networks DNS resolvers, measurement analysis of cellular DNS resolvers can only be carried from clients within their net-works. This is because most, if not all, cellular operators employ NAT and firewall policies that prohibit externally generated traffic from their network [24].
We tested the external reachability of cellular network DNS re-solvers by launching ping and traceroute probes from our university network to the observed external resolvers (Sec. 4.1). Table 4 presents a summary of our results. Of the six major cellular carriers we profiled, only Verizon and T-Mobile resolvers responded to a majority of ping requests, with a small fraction of AT&T’s responding. None of the resolvers responded to our tracerotue probes on any of these networks and our probes were generally unable to penetrate the cellular network beyond the network’s ingress points. In the case of Sprint and the two South Korean
101 102 103 Resolution Time (ms) 0.0 0.2 0.4 0.6 0.8 1.0 CDF 2nd Lookup 1st Lookup
Figure 7: Cache performance for clients local DNS resolvers combined for each of the four US carriers. Although the hostnames we looked up were very popular, we see DNS cache misses for nearly 20% of DNS requests on cellular. This is due to the short TTLs used by CDNs, and explains the long tails of resolution times seen in Figure 5.
carriers we studied, none of the resolvers responded to any of our probes.
In contrast, all the probes launched by our mobile clients were able to measure the DNS infrastructure of these carriers. Clearly the known opaqueness of cellular networks extends to the cellular DNS infrastructure and, thus, any analysis of such infrastructure requires the participation of devices within each cellular network.
4.5
Client resolver inconsistency
In this section we analyze the consistency of LDNS resolvers for clients in each cellular provider. As the location of end-host’s visible LDNS resolver are commonly used to approximate the actual end-host location, the consistency (or stickiness) of a device’s LDNS resolver can significantly impact the effectiveness of services, such as CDNs, that rely on such approximation.
Our analysis revealed inconsistency between client and resolver mappings in all cellular providers investigated. These inconsisten-cies are not limited to the external resolver IP address, but include the /24 prefix of the external address. Figure 8 shows the LDNS
Mar-31 May-06 Jun-11 Jul-17 Date −5 0 5 10 15 20 # LDNS Pairs −20 2 4 6 8 10 12 14 16 # /24 Pairs Sprint
Mar-16 Mar-28 Apr-09 Apr-21 May-03 Date −20 2 46 8 10 12 # LDNS Pairs −20 2 46 8 10 12 # /24 Pairs Verizon Wireless Apr-15Apr-27May-09May-21Jun-02Jun-14 Date −50 5 10 15 20 25 # LDNS Pairs −20 2 4 6 8 10 # /24 Pairs T-Mobile Apr-16 Date −50 5 1015 20 25 # LDNS Pairs 0 2 4 6 8 # /24 Pairs AT&T (a) US Carriers Apr-14 Apr-26 Date −100 10 20 30 40 50 60 70 # LDNS Pairs −0.20.0 0.2 0.4 0.6 0.8 1.01.2 # /24 Pairs LG U+ Apr-14 Apr-26 Date −50 5 1015 20 25 # LDNS Pairs −0.50.0 0.5 1.01.5 2.0 2.5 # /24 Pairs SKTelecom (b) SK Carriers
Figure 8: Number of external resolvers observed by a client in each of the networks we looked at. Bottom: number of external resolver IP addresses. Top: number of unique /24 prefixes observed by resolvers. Client DNS resolvers change not just within localized clusters, but span multiple /24 prefixes over time.
Jul-28 Aug-09 Aug-21
Date −0.50.0 0.5 1.0 1.5 2.02.5 # LDNS Pairs −0.20.0 0.2 0.4 0.6 0.81.0 1.2 # /24 Pairs AT&T (a) Aug-04 Aug-16 Date −10 1 2 3 45 6 # LDNS Pairs −0.50.0 0.5 1.0 1.5 2.0 2.5 # /24 Pairs T-Mobile (b)
Figure 9: Client associations with enumerated LDNS resolvers for clients at a static location. Measurements were filtered to be within a 1 km radius of a chosen centroid. Even with relatively static location, clients still shift resolvers across IPs and /24 prefixes.
Provider Total Ping Traceroute
Sprint 20 0 0 Verizon 34 32 0 AT&T 47 3 0 T-Mobile 40 40 0 SKTelecom 24 0 0 LG U+ 80 0 0
Table 4: Number of external DNS resolvers able to be reached externally by either ping or traceroute probes.
pairs observed by each device over time, enumerated based on the order of appearance in our measurements.
The temporal stability of mapping between clients and external resolvers varies across carriers. Sprint and Verizon clients, for instance, show relatively stable mappings while the mappings for the remaining carriers appeared to be very unstable. Unstable mappings are not all the same, however, as can be seen when contrasting T-Mobile, AT&T and the two South Korean carriers. In the first two, changes in resolver IP addresses are typically accompanied by changes in the resolvers /24 prefix. In contrast, while clients in the two South Korean carriers experience more frequent changes in resolver IP addresses, the alternative resolvers are contained within one or two /24 prefixes. For example, a client within LG U+’s network witnessed over 65 external resolver IP addresses within a two week period, all of which were within only 2 /24 prefixes.
A possible reason for these unstable mappings is client mobility, with client-resolver mappings changing as devices move within the operator’s network. To study this, we recorded a coarse client
0.0 0.2 0.4 0.6 0.8 1.0 Cosine Similarity 0.0 0.2 0.4 0.6 0.8 1.0 CDF Sprint Different /24 Same /24 0.0 0.2 0.4 0.6 0.8 1.0 Cosine Similarity 0.0 0.2 0.4 0.6 0.8 1.0 CDF Verizon Wireless Different /24 0.0 0.2 0.4 0.6 0.8 1.0 Cosine Similarity 0.0 0.2 0.4 0.6 0.8 1.0 CDF T-Mobile Different /24 Same /24 0.0 0.2 0.4 0.6 0.8 1.0 Cosine Similarity 0.0 0.2 0.4 0.6 0.8 1.0 CDF AT&T Different /24 Same /24 (a) US Carriers 0.0 0.2 0.4 0.6 0.8 1.0 Cosine Similarity 0.0 0.2 0.4 0.6 0.8 1.0 CDF LG U+ Different /24 Same /24 0.0 0.2 0.4 0.6 0.8 1.0 Cosine Similarity 0.0 0.2 0.4 0.6 0.8 1.0 CDF SKTelecom Different /24 Same /24 (b) SK Carriers
Figure 10: Cosine similarity of replica servers for buzzfeed.com between resolvers within the same /24 prefix, and those in separate prefixes. Resolvers within the same /24 prefix see very similar sets of replicas (cosine similarity values close to one), and those in separate prefixes see high set independence (values close to zero). Clients changing resolver /24 prefixes are directed towards completely different sets of replica servers.
location for each experiment, rounded up to a 1000-meter radius area. We find that cellular clients experience changes to their DNS IP and /24 prefixes even when not moving. Figure 9 shows users on AT&T and T-Mobile’s network, and their resolver consistency for a single location cluster.
To understand the potential impact of these inconsistencies consider that, as shown by Xu et al. [25], DNS resolvers tend to be clustered at egress points. A change of resolver can result in the association of a mobile client with a completely different (and distant!) egress point.
5.
CELLULAR REPLICA SELECTION
We now explore the stability of replica server selection for different mobile websites across the different carriers in our study. For each hostnames in this set, we look at the number of replica IP addresses returned, and how often each replica is chosen.
For the selected DNS resolver, we construct a map of
< replicaIP, ratio >pairs capturing, for each replica server, the
server IP address and the fraction of time that replica was used:
replica_map=<(ip1,
ip1seen
total_seen), ...,(ipn,
ipnseen
total_seen)>
We then uscosine similarity[5, 23] to quantify the similarity of replica servers mapped to each DNS resolver. The cosine similarity between two vectors A and B quantifies the degree of overlap between two vectors by computing the dot product of the vectors and dividing by the product of their lengths:
cos_sim= A·B
kAkkBk
Given our vectors of non-negative probabilities,cos_simranges from0to 1. Whencos_sim = 0, the sets of redirections have no clusters in common. Values greater than0indicate that some clusters are seen in both sets;cos_sim= 1means that the sets of clusters seen are equivalent.
5.1
Impact of Cellular DNS
CDNs typically aggregate client resolvers behind traceroute divergence points and map clients based on measurements to these points [15]. The opaqueness of cellular networks, restricting the reach of traceroutes (Sec. 4.4), calls into question the effectiveness of this approach.
This may explain the relatively small numbers of replica servers mapped to each cellular DNS resolver, particularly when compared to typical CDN-resolver mappings in wired networks.
Looking at the replica maps for each cellular operator and comparing cosine similarities, it appears that CDNs are grouping replica mappings by resolver /24 prefix. Figure 10 shows the cosine similarity (overlap) between replica sets for DNS resolvers in the same /24 prefix, and those in different prefixes. We see large degrees of independence between sets from differing /24 prefixes, with over 60% of sets having a cosine similarity of 0, meaning there is no overlap at all between replica vectors.
This high degree of replica set independence becomes a sig-nificant issue since, as we showed in Section 4.5, cellular clients change LDNS resolvers frequently and across /24 prefixes poten-tially leading to large performance variability.
5.2
Impact of network egress
A previous study of the structure of cellular networks iden-tified the limited numbers of cellular ingress/egress points as a limiting factor to the performance of content delivery in mobile networks [25]. When their study was conducted the number of egress points in each cellular network numbered between 4 and 6, and their recommendation was to place replicas close to these egress points for best performance.
As cellular operators have continued to upgrade and evolve their infrastructure, they have increased the number of network egress points. Using our experiment dataset, we calculated the number of egress points observed by our clients by looking for the first traceroute hop outside a mobile operators network, taking the previous hop as the network egress point. Our results show a substantial increase (2-10x) in the number of network egress points across all US mobile operators, with 11 identified egress points
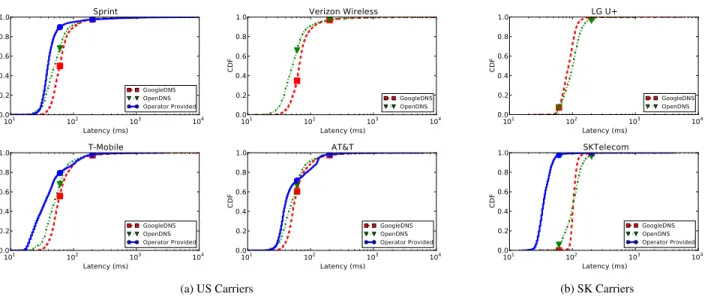
101 102 103 104 Latency (ms) 0.0 0.2 0.4 0.6 0.8 1.0 CDF Sprint GoogleDNS OpenDNS Operator Provided 101 102 103 104 Latency (ms) 0.0 0.2 0.4 0.6 0.8 1.0 CDF Verizon Wireless GoogleDNS OpenDNS 101 102 103 104 Latency (ms) 0.0 0.2 0.4 0.6 0.8 1.0 CDF T-Mobile GoogleDNS OpenDNS Operator Provided 101 102 103 104 Latency (ms) 0.0 0.2 0.4 0.6 0.8 1.0 CDF AT&T GoogleDNS OpenDNS Operator Provided (a) US Carriers 101 102 103 104 Latency (ms) 0.0 0.2 0.4 0.6 0.8 1.0 CDF LG U+ GoogleDNS OpenDNS 101 102 103 104 Latency (ms) 0.0 0.2 0.4 0.6 0.8 1.0 CDF SKTelecom GoogleDNS OpenDNS Operator Provided (b) SK Carriers
Figure 11: Ping latencies to public DNS resolvers GoogleDNS and OpenDNS. The external facing cellular operator provided LDNS is closer a significant majority of the time (with the exception of Verizon, in the US, and LG in SK, since those resolvers do not respond to probes).
in Sprint, 45 in AT&T, 62 in Verizon and 49 in T-Mobile. It is this combination of significantly more egress points and radical improvements on the performance of radio access networks that makes client localization and replica selection critical for next generation cellular networks.
6.
PUBLIC DNS IN MOBILE NETWORKS
Considering the growth in public DNS services, in this sec-tion we investigate their performance on name resolusec-tion and its implications on CDN replica selection in cellular networks. Despite the fact that some cellular operators prohibit customers from configuring different DNS resolvers,2 our characterization of public DNS services provides a valuable benchmark against which to compare the performance and localization effectiveness of different cellular operators DNS.
6.1
Public DNS Characterization
We characterize the number of resolvers seen from clients within each mobile provider. Table 5 shows the number of unique resolver IPs seen from our clients on each mobile provider. We see that the anycasted public DNS resolvers give significantly higher numbers of unique IP addresses to clients (GoogleDNS has over 4 times the IP addresses than the cellular DNS providers for US carriers). This is partly due to the architecture of these public DNS resolvers. For instance, according to their public documentation, GoogleDNS consists of 30 geographically distributed /24 subnetworks [9].
Accounting for the clustered nature of these public DNS re-solvers, the bottom half of Table 5 shows the number of unique /24 subnetworks seen for each resolver. By aggregating by /24 subnetworks, we see relatively equal numbers for all three resolver types across each cellular provider, especially when compared to the large disparity in IP addresses shown above.
As in wired networks, the distance to public DNS resolvers could significantly impact the web performance experienced by clients [18]. Using the methods described in Section 4.1, we measure the distance to both public DNS resolvers, and compare it
2
Mobile devices must be “rooted” in order to change these settings; and, while no longerillegalin the United States, rooting voids the device’s warranty in most cases.
Provider Local GoogleDNS OpenDNS
Sprint (all IPs) 24 122 38
Verizon (all IPs) 37 135 41
T-Mobile (all IPs) 38 151 49 AT&T (all IPs) 47 160 38
SKTelecom 25 33 7 LG U+ 80 47 6 Sprint (/24) 16 21 9 Verizon (/24) 37 13 7 T-Mobile (/24) 21 15 8 AT&T (/24) 27 15 6 SKTelecom (/24) 4 5 2 LG U+ (/24) 3 6 1
Table 5: Total number of DNS resolver IP addresses seen from our ADNS for each provider and resolver group. While public resolvers have more total IP addresses, most are located within the same /24 block. In addition we see more /24 blocks for local resolvers than public ones, with the exception of Sprint.
with that of the cellular operator provided DNS. Figure 11 present CDFs of these measured latencies for the different carriers in ours study.
The figure shows that for the carriers whose resolvers responded to our probes, the cell DNS is commonly closer to clients than the public resolver. This is not surprising since all public DNS resolvers are outside of cellular networks, and resolution requests would have to leave the cellular network to complete. For the US carriers, the cell DNS resolvers is, at median, 10-25 ms closer than the best public DNS resolver. For South Korean operators, public DNS resolvers taken nearly twice for resolution as long at the median. On the other hand, the figure also shows the greater performance consistency of public DNS services and a long tail of resolution times from cell DNS. In the case of T-Mobile, public DNS resolvers performed equal or better over 40% of the time.
In addition to analyzing the observed structure of public DNS and its relative performance, we also explore the consistency of client-resolver mappings. We focus on Google Public DNS,
Apr-09 May-15 Jun-20 Jul-26 Date −500 50 100 150 200 250 # LDNS Pairs −20 2 4 6 8 10 12 14 16 # /24 Pairs Sprint
Mar-16 Mar-28 Apr-09 Apr-21 May-03 Date 0 20 40 60 80 # LDNS Pairs −20 2 46 8 10 # /24 Pairs Verizon Wireless Apr-15Apr-27May-09May-21Jun-02Jun-14 Date −200 20 40 60 80 100 # LDNS Pairs −20 2 4 6 8 10 12 # /24 Pairs T-Mobile Apr-16 Date −20 2 46 8 10 12 14 # LDNS Pairs −0.50.0 0.5 1.0 1.5 2.0 2.5 # /24 Pairs AT&T (a) US Carriers Apr-14 Apr-26 Date −100 10 20 30 40 50 # LDNS Pairs −10 1 2 3 4 5 6 # /24 Pairs LG U+ Apr-14 Apr-26 Date −50 5 1015 20 25 30 # LDNS Pairs −0.50.0 0.5 1.01.5 2.0 2.5 # /24 Pairs SKTelecom (b) SK Carriers
Figure 12: Resolver consistency for GoogleDNS for users in each carrier. It is interesting to note that even though GoogleDNS’s IP address (8.8.8.8) is anycast, users see large variability in the /24s they are sent to. Each /24 for GoogleDNS represents one of thirty distinct geographic locations for their services.
comparing the external resolver IP addresses assigned to a single client over time, in each of the carriers in our study. Figure 12 presents this both for DNS resolvers and their /24 prefix. As the figure shows, despite relying on anycast, Google users are directed toward multiple /24 blocks of resolvers at different geographic locations, given that each /24 block represents one of the 30 geographically distinct resolver clusters. This inconsistency could be the results of the widespread use of tunneling (e.g., via MPLS).
6.2
Public DNS Performance
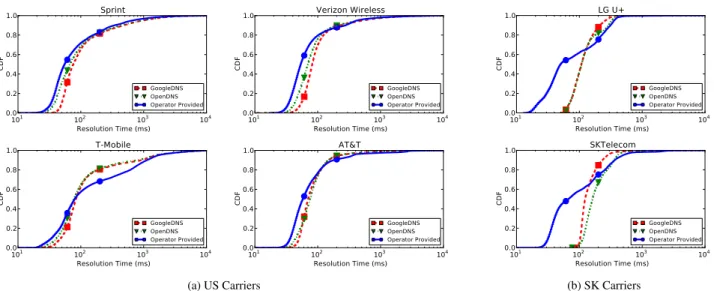
Figure 13 shows domain resolution times for the device’s locally configured DNS along with public DNS resolvers GoogleDNS and OpenDNS. Our results show that in a majority of cases, the lo-cally configured resolver provides faster domain name resolutions. While the name resolution times are greater on average for public DNS resolvers, they exhibit lower variance in response times and have a shorter tail than all cellular operators we investigated.
In general, our results are consistent with those previously reported in [1,18], where public DNS resolvers were located further away from clients, and therefore incurred longer domain name resolution times due to the larger round trip times to the resolvers themselves.
6.3
Public DNS Replica Performance
We measured the performance of replicas selected by public DNS resolvers. For each experiment set described previously in Section 3, we calculated the difference in performance as a percent-age change compared to the replica servers returned by the locally configured resolver. Figure 14 shows the cumulative distribution of percent difference between the replica servers returned by each public DNS resolver, and the locally configured one for all six providers. Replicas are aggregated by /24 prefix.
The aggregation shifts the results toward equal performance, as witnessed by the large percentage of experiments shown in the straight line down 0% in all carriers. For all providers in the US and South Korea, between 60 and 80% of the relative latency equals zero. The remainder falls evenly on both sides of the graph, indicating similar performance between cell networks and public DNS on average. Despite cellular network’s knowledge of client location, and in contrast to wired networks, cell network provider’s own DNS and public DNS yield comparable performance to selected replicas.
7.
DISCUSSION
Our analysis reveals some critical problems with current cellular DNS infrastructures, and shows their impact on the performance of content distribution. We have mapped the problem with replica selection to the opaqueness of the cellular DNS infrastructure and the seemingly intended obfuscation of location information such as the inconsistency between mobile clients and the assigned resolvers.
This opaqueness, in an observed extreme case, show client- and external-facing DNS resolvers within a single operator (Verizon) within separate ASes. The opaqueness of cellular DNS means that even though many of the largest CDNs use DNS based replica selection for mobile clients [14], the CDNs themselves are unable to measure the distance from their replicas to these resolvers or place them in respective network coordinates outside of their network prefix. While previous work has shown the inconsistency of cellular device IP addresses, our work further demonstrates the inconsistency of client DNS resolvers within cellular networks.
Despite the public DNS results (Sec. 6.3), we are not particularly endorsing public DNS adoption. Cellular network DNS should
101 102 103 104 Resolution Time (ms) 0.0 0.2 0.4 0.6 0.8 1.0 CDF Sprint GoogleDNS OpenDNS Operator Provided 101 102 103 104 Resolution Time (ms) 0.0 0.2 0.4 0.6 0.8 1.0 CDF Verizon Wireless GoogleDNS OpenDNS Operator Provided 101 102 103 104 Resolution Time (ms) 0.0 0.2 0.4 0.6 0.8 1.0 CDF T-Mobile GoogleDNS OpenDNS Operator Provided 101 102 103 104 Resolution Time (ms) 0.0 0.2 0.4 0.6 0.8 1.0 CDF AT&T GoogleDNS OpenDNS Operator Provided (a) US Carriers 101 102 103 104 Resolution Time (ms) 0.0 0.2 0.4 0.6 0.8 1.0 CDF LG U+ GoogleDNS OpenDNS Operator Provided 101 102 103 104 Resolution Time (ms) 0.0 0.2 0.4 0.6 0.8 1.0 CDF SKTelecom GoogleDNS OpenDNS Operator Provided (b) SK Carriers
Figure 13: Domain resolution times for the cellular operator’s provided DNS compared with public DNS resolvers GoogleDNS and OpenDNS. Cellular operator DNS offers lower resolution times when compared to public DNS services.
resolution times than popular public DNS options, are closer to mobile users and can potentially offer a finer grained user localization. Rather, we use our analysis of public/provider DNS resolvers to better illustrate the overall inefficiencies of current cell networks and CDNs configurations. In light of these results, it is not surprising to see cellular operators taking steps to offer their own content delivery solutions [19].
8.
RELATED WORK
Our work builds on the many previous efforts to explore mobile device performance within cellular networks, characterize client DNS infrastructure, and analyze the interplay between DNS and CDNs in replica selection. It represents the first analysis of cellular DNS infrastructure and its impact on content replica selection in 4G networks.
Several recent efforts have looked at the performance charac-teristics of mobile clients within cellular networks. Sommers et al. [22] compared the performance of mobile devices when they were in cellular networks or connected to 802.11 WiFi. Nikravesh et al. [17] looked at the longitudinal overall performance of mobile network performance from end devices, while Zarifis et al. [26] analyzed the increased latency experienced by mobile clients. With the exception of Zarifis et al., no paper considered the location of content replicas in their performance analysis.
Other work has investigated the impact of edge network effects such as client inaccessibility and IP address shuffling, and their impact on web services. Balakrishnan et al. [3] looks at the consistency of IP addresses within cellular networks as well as their geo-location accuracy. Casado et al. [4] studied how the opacity of edge networks and their stationarity of IP addresses can adversely affect network services. We continue this work with our observations of client LDNS resolver inconsistency, and its ill suited position as a client locator for CDNs.
Recently, Schomp et al. [20] and Alzoubi et al. [2] have formed large scale studies characterizing the structure and per-formance of client side LDNS resolvers. Our work is a natural complement as their investigation was limited to wired and broad-band networks, because cellular network infrastructure can only
be discovered from the end devices within the particular operator network given common firewall policies.
Krishnamurthy et al. [13] performed one of the earliest studies of content delivery networks and evaluated the effectiveness of replica selection for client performance. Our work naturally extends this, updating analysis with 4G cellular networks.
The effectiveness of DNS servers for content replica selection has been extensively explored before (e.g., [16, 21]). However most previous studies have been done under the assumption that client to resolver mappings remained constant. Huang et al. further investigated the replica selection mechanisms of a major CDN [10]. More recently Otto et al. [18] looked at the impact of using remote public DNS on replica selection for broadband connections. Here the authors show that using a client’s ISP DNS servers yield the best performance a majority of the time, with public DNS services incurring significant performance of selected replicas. Our work shows that many times, the performance of replicas chosen by cellular operator DNS are in many cases no better than the publicly chosen ones, and offer worse performance in almost 25% of cases. The behavior of cellular DNS creates an entirely different environment for content replica selection, requiring its own set of localization techniques aside from client resolver.
Our work is closest to Xu et al. [25], which looked at the role cellular network structure plays in content placement. While the authors conducted initial investigations on DNS and content placement in cellular networks, our study includes longitudinal data from clients which allows us to monitor changes in DNS configuration from mobile end hosts. In addition, their work was conducted prior to major deployments of 4G technologies such as LTE which significantly decrease radio access latency and variance, as well as prior to the expansion of cellular network ingress points. Therefore, replica selection in modern networks represents a more important piece of mobile user performance than previously cited.
9.
CONCLUSIONS AND FUTURE WORK
We presented a detailed analysis of cellular network DNS infras-tructure and its implications on the effectiveness of CDN replica selection. Our work is motivated by the continued improvements in access latency and performance seen in next generation networks
−200 −150 −100 −50 0 50 100 150 200 Latency (ms) 0.0 0.2 0.4 0.6 0.8 1.0 CDF Sprint GoogleDNS OpenDNS −200 −150 −100 −50 0 50 100 150 200 Latency (ms) 0.0 0.2 0.4 0.6 0.8 1.0 CDF Verizon Wireless GoogleDNS OpenDNS −200 −150 −100 −50 0 50 100 150 200 Latency (ms) 0.0 0.2 0.4 0.6 0.8 1.0 CDF T-Mobile GoogleDNS OpenDNS −200 −150 −100 −50 0 50 100 150 200 Latency (ms) 0.0 0.2 0.4 0.6 0.8 1.0 CDF AT&T GoogleDNS OpenDNS (a) US Carriers −200 −150 −100 −50 0 50 100 150 200 Latency (ms) 0.0 0.2 0.4 0.6 0.8 1.0 CDF LG U+ GoogleDNS OpenDNS −200 −150 −100 −50 0 50 100 150 200 Latency (ms) 0.0 0.2 0.4 0.6 0.8 1.0 CDF SKTelecom GoogleDNS OpenDNS (b) SK Carriers
Figure 14: Relative replica latency performance for replicas given by cellular DNS and public DNS resolvers. In contrast to what has been observed in wired networks, replicas given from public DNS resolvers offer equal or better performance to those given from cellular DNS a majority of the time.
that, as we show, make accurate localization of clients critical to the mobile user experience. We explore these issues in the two fastest growing LTE markets – the US and South Korea – relying on data collected by over 340 distributed mobile devices across six carriers. We found several issues that impact the performance of content delivery in modern cellular networks, including the opaqueness of the cellular networks, and the inconsistent mappings between mobile clients and cellular DNS resolvers. Our study, the first in the literature of public DNS performance from cellular networks, shows despite their greater distance from the associated mobile devices, that remote public resolvers yielded comparable perfor-mance in replica selection to that of cellular provider DNS.
Beyond extending our characterization of cellular networks to other markets, we have started to explore alternative approaches for improving CDN performance through better client localization.
Acknowledgements
We thank our shepherd Ramesh Sitaraman and the anonymous reviewers for their invaluable feedback. We are grateful to John Otto and Mario Sánchez for their early feedback on this work, and to Byungjin Jun for his help in application development. This work was supported in part by the National Science Foundation through Award CNS 1218287.
10.
REFERENCES
[1] B. Ager, W. Mühlbauer, G. Smaragdakis, and S. Uhlig. Comparing DNS resolvers in the wild. InProc. IMC, 2010. [2] H. A. Alzoubi, M. Rabinovich, and O. Spatscheck. The
anatomy of LDNS clusters: Findings and implications for web content delivery. InProc. WWW, 2013.
[3] M. Balakrishnan, I. Mohomed, and V. Ramasubramanian. Where’s that phone?: geolocating IP addresses on 3G networks. InProc. IMC, 2009.
[4] M. Casado and M. J. Freedman. Peering through the shroud: The effect of edge opacity on ip-based client identification. InProc. USENIX NSDI, 2007.
[5] D. R. Choffnes and F. E. Bustamante. Taming the torrent: a practical approach to reducing cross-isp traffic in
peer-to-peer systems.ACM SIGCOMM Computer Communication Review, 38(4):363–374, 2008.
[6] CISCO. Architectural Considerations for Backhaul of 2G/3G and Long Term Evolution Networks.http://www. cisco.com/c/en/us/solutions/collateral/ service-provider/mobile-internet/white_ paper_c11-613002.pdf.
[7] CISCO. CISCO visual networking index: Global mobile data traffic forecast update 2013-2018. Technical report, CISCO Systems Inc., 2014.
[8] A. Gember, A. Akella, J. Pang, A. Varshavsky, and R. Caceres. Obtaining in-context measurements of cellular network performance. InProc. IMC, 2012.
[9] Google. Frequently asked questions - Public DNS – Google Developers.https://developers.google.com/ speed/public-dns/faq.
[10] C. Huang, A. Wang, J. Li, and K. W. Ross. Measuring and evaluating large-scale CDNs. InProc. IMC, 2008. [11] J. Huang, F. Qian, A. Gerber, Z. M. Mao, S. Sen, and
O. Spatscheck. A close examination of performance and power characteristics of 4g lte networks. InProc. of MobiSys, 2012.
[12] G. Intelligence. 4G driving data usage but not all markets reaping the rewards. Technical report.
[13] B. Krishnamurthy, C. Wills, and Y. Zhang. On the use and performance of content distribution networks. InProc. IMC, 2001.
[14] B. Maggs. Personal Communication.
[15] B. Maggs. Challenges in engineering the world’s largest content delivery networkstate of the union address. [16] Z. M. Mao, C. D. Cranor, F. Douglis, M. Rabinovich,
O. Spatscheck, and J. Wang. A precise and efficient evaluation of the proximity between web clients and their local DNS servers. InProc. USENIX ATC, 2002.
[17] A. Nikravesh, D. R. Choffnes, E. Katz-Bassett, Z. M. Mao, and M. Welsh. Mobile network performance from user devices: A longitudinal, multidimensional analysis. InProc. PAM, 2014.
[18] J. S. Otto, M. A. Sánchez, J. P. Rula, and F. E. Bustamante. Content delivery and the natural evolution of DNS: Remote DNS trends, performance issues and alternative solutions. In
Proc. IMC, 2012.
[19] B. F. Rubin. Verizon to acquire content-delivery startup edgecast networks.The Wall Street Journal, 9 December 2013. Available:http://online.wsj.com/ article/BT-CO-20131209-703213.html. [Last Accessed: 5 May 2014].
[20] K. Schomp, T. Callahan, M. Rabinovich, and M. Allman. On measuring the client-side dns infrastructure. InProc. IMC, 2013.
[21] A. Shaikh, R. Tewari, and M. Agrawal. On the effectiveness of DNS-based server selection. InProc. IEEE INFOCOM
2001.
[22] J. Sommers and P. Barford. Cell vs. wifi: on the performance of metro area mobile connections. InProc. IMC, 2012.
[23] A.-J. Su, D. R. Choffnes, A. Kuzmanovic, and F. E. Bustamante. Drafting behind akamai (travelocity-based detouring).ACM SIGCOMM Computer Communication Review, 36(4):435–446, 2006.
[24] Z. Wang, Z. Qian, Q. Xu, Z. Mao, and M. Zhang. An untold story of middleboxes in cellular networks.SIGCOMM Comput. Commun. Rev., 41(4):374–385, Aug. 2011. [25] Q. Xu, J. Huang, Z. Wang, F. Qian, and A. G. Z. M. Mao.
Cellular data network infrastructure characterization and implication on mobile content placement. InProc. ACM SIGMETRICS, 2011.
[26] K. Zarifis, T. Flach, S. Nori, D. Choffnes, R. Govindan, E. Katz-Bassett, Z. M. Mao, and M. Welsh. Diagnosing Path Inflation of Mobile Client Traffic. InProc. PAM, 2014.