473 |
P a g e
Flat Rate Tuition - Observations and Analysis of Student Persistence and
Performance
Gurprit Chhatwal, Claudine Keenan, Jinchang Wang
The Richard Stockton College of New Jersey, 101 Vera King Farris Drive, Galloway, New Jersey 08205
ABSTRACT
Facing reduction in public funding and increases in pressure to improve student performance and graduation rates, many public colleges and some state systems have implemented flat rate tuition policies. This study looks at the relationship between such a policy and undergraduate student performance (changes in GPA) and persistence (credits attempted vs. earned) at one public college during four consecutive academic terms. The study reveals a strong correlation between student persistence and performance. Students who persist in completing heavier credit loads are more likely to experience small and diminishing GPA gains; and students who do not persist are more likely to experience GPA losses of significantly lower magnitude. Students who attempt lower course loads are more likely to persist than those who attempt heavier course loads. These correlations are statistically significant so that they may be extrapolated to the whole student population in the college.
KEY WORDS
Tuition; Undergraduate student; Student performance; Student persistence
ACADEMIC DISCIPLINE
Education
Council for Innovative Research
Peer Review Research Publishing SystemInternational Journal of Research in Education Methodology
Vol.4, No.2
[email protected]
474 |
P a g e
INTRODUCTION
Flat rate (or block) tuition policies generally set a fixed tuition that allows students to take any number of credits at no additional charge. By contrast, credit rate or per-credit tuition policies require students to pay for the actual number of credits they attempt during any semester. Many colleges and universities charge flat rate tuition for their full-time students and credit rate tuition for their part-time students. Full time enrollment is generally defined as twelve or more credits in federal guidelines for typical 15 week academic terms.
During the most recent economic recession, political leaders and taxpayers alike began scrutinizing college tuition more closely than ever before. In response to demands from taxpayers who partially subsidize state education block grants and federal aid under Title IV of the Higher Education Authorization Act, the US Department of Education launched its College Affordability and Transparency Center in 2011. The web site lists institutions who charge the highest net tuition “price” and those who have raised tuition rates by the highest percentages each year. Upon filing a Free Application for Student Assistance (FAFSA), students and parents seeking Title IV financial aid receive a link to the Affordability site, encouraging them to compare tuition and student retention and completion.
For public colleges in particular, these disclosures have resulted in increased pressure to improve student degree completion rates and to keep tuition fees as low as practicable. Public 4-year colleges and universities report graduation rates of between 23.5% - 37% in four-years, while the private colleges and universities report these rates anywhere between 49% – 64% (DeAngelo etal, 2011). By linking completion rates to net tuition and student indebtedness, the federal government has increased the pressure on colleges to improve on both of these measures. At the same time, although private colleges and universities have depended on tuition and endowments as their main source of operating revenue for decades, their public counterparts have only recently seen such dramatic cuts in state funding that their own increasing dependence on tuition has resulted in significant tuition increases for this group of students who generally cannot afford to attend private colleges (Delta Project, 2012).
Spokespersons for the schools and associations in states where flat rate tuition has been implemented say that these policies are designed to motivate students to graduate on time (Sellingo, 2001; Waldman, 2004). As students who attempt only twelve credits per term for four years will complete only 96 credits i.e. 80% of the credits required to earn their degrees, many public colleges in particular have implemented flat rate tuition policies aimed at encouraging students to earn at least fifteen credits per term so that they may graduate within four years. However, students who attempt exactly 100% of the courses required within four years must succeed in both: passing every one of their required courses and completing only their required courses, limiting their flexibility to explore or change majors, to double major or even to earn a minor program of study. By contrast, the students who attempt eighteen credits per term may either graduate early, or may have the flexibility during their four years of enrollment to earn a double major, to explore or change majors, or to earn a minor program of study as well. For these reasons, many public institutions have turned to flat rate regimen for its potential to attain both goals: timely completion and lower tuition overall.
Therefore, most institutions (and even some entire state systems) who implement flat rate tuition tend to set the “full time” threshold at the exact 100% line by which a student making satisfactory progress would graduate in four years, generally 15 credits per term. In a small number of cases, there is no agreement on that threshold between states (or even between institutions within the same state). As a result of these inconsistencies, some student groups have expressed outrage, such as in Ontario (Mayo and Bien, 2009) where some institutions have set full time prices at a range that varies between 60%-100% of the credits students would need to earn per year to graduate on time. In other words, if 15 credits per term equals 100% progress towards a four-year completion, some institutions have set the flat rate at 9 credits, or 60% of the progress rate needed to complete a degree in four years, while others have set it at 12 credits or 80%. This variation casts doubt on the rationale for flat rate tuition as a tool for raising graduation rates. Flat rate tuition strategies that aim below the 100% full time threshold are designed to incent students to attempt heavier credit loads to attain maximum value for tuition paid.
To date, no published studies have described whether flat rate policies have contributed toward improving graduation rates. To conduct such a study, an institution would have to compare graduation rates for several years using the per-credit tuition cohorts against graduation rates for several years using the flat rate tuition cohorts. To compare six-year graduation rates, for example, a researcher would need twelve years’ worth of data: six with per-credit rates and six with flat rates. At an institution where flat rate tuition has only been in effect for two years, such a study will only be possible at some time in the future. However, an initial analysis of student persistence, based on the number of credits they attempt, and performance, based on changes to the GPA, may provide an early look at how a flat rate tuition policy is related to these aspects at one institution.
This study examines the impact of a recently-implemented flat rate tuition policy on student persistence (defined as credits attempted vs. credits earned), and performance (measured as change in GPA). The study uses student data for four consecutive academic terms at a public college where the flat rate threshold has been set at 100% of the credits students need to graduate in four years. At this college, that threshold is 16 credits per semester (on a 4-credit per course base system where 128 is the typical four-year requirement for most degrees granted). At this school, flat rate also applies to students who opt to take only 12 credits (which would place them on a five-year completion or 80% schedule). Students restricted to 12 credits by policy, e.g. remedial or probationary students would pay the per-credit price. Similarly, those students who decide to take 20 credits per term (120% schedule) also pay the same flat rate, creating a fiscal incentive for students to increase credits attempted.
A literature review on the research of flat rate tuition is given in Section 2. Section 3 provides an introduction to the tuition policy change in Stockton College and data collection for this study. In Section 4, we investigate how a student’s
475 |
P a g e
persistence and performance are related to flat rate tuition. The analyses in Section 5 show statistical significances of the correlations revealed by our data.
LITERATURE REVIEW
Given both, an increasing dependence on tuition and a strong sense of their mission to remain accessible to as many students as possible, it is not surprising that public institutions have adopted a variety of approaches to establish tuition policies aimed at offsetting what students must pay to earn their degrees. For example, some public colleges have implemented differential tuition policies. Differential tuition imposes higher rates for students entering potentially high-demand, lucrative careers such as engineering, while those students entering potentially lower-high-demand, less lucrative careers like liberal arts pay lower tuition rates. Studies of differential tuition policies (Yanikoski and Wilson, 1984) have focused on examining the types and rationales for adjusting tuition to achieve maximum tuition revenue in minimally regressive ways. The authors explain that the rationale for most institutions to charge higher tuition for graduate work compared to undergraduate programs has been largely unquestioned for centuries: graduate students stand to earn more upon completing their degrees, their class sizes are generally smaller and their programs require specialized, more expensive faculty, facilities and the equipment costs more than for most undergraduate programs. Yanikoski and Wilson extend this last rationale in a discussion about applying similarly differentiated tuition prices among various undergraduate programs.
Their study considers differential prices by student level (lower division vs. upper division), by institutional level (community vs. regional vs. research focus), academic program (engineering vs. literature, for example), and/or by student demand (nursing and engineering vs. philosophy) and finally, by student load or status (part time vs. full time). Although this section of their article touches on what can be referred to as flat or block rate tuition for full time students, the authors focus only on those load differentials that are coupled with one or more of the other approaches, namely program or demand (p. 742). The emphasis of this study is on the need for institutions to experiment with the approaches to charge differential tuition that best fit their own balance between enrollment management and student access. While an important scholarly foray into the variations of tuition pricing, this article does not examine the impact of these policies on student success in those programs or at those levels where the tuition has been adjusted.
Similarly, a few scholarly articles have appeared concerning institutions that have adjusted differences between their in-state vs. out-of-in-state tuition rates. These changes have been the focus of a study that examined out-of-in-state tuition as a deterrent to interstate migration (Morgan, 1983) and more recently, as the focus of a study that examined these rates as yet another battleground for states and undocumented residents (Dougherty, Nienhusser and Vega, 2010).
For example, in studying tuition policies as a means for deterring interstate migration, Morgan (1983) examined the impact of non-resident tuition in a supply-demand model. Morgan found that states likely to attract out-of-state students generally had favorable economic and environmental conditions. Although higher tuition for non-resident students was found to reduce migration in general, Morgan conversely found that economically attractive states seemed most likely to raise out-of-state tuition in response to strong demand and did not observe an immediate reduction in migration. Morgan concluded his analysis with the observation that students who choose to migrate to a state for higher education with the intent of remaining in that state to enjoy favorable economic conditions seem to calculate the value of paying higher non-resident tuition. Also, small declines in enrollment resulting from higher non-resident tuition may not deter these institutions from raising tuition. However, the author argues that these same states might reconsider their decisions and set lower tuitions for students who intend to remain in the state, framing their attraction to the state as an investment in economic development and workforce readiness for their state’s future. As with the other two scholarly studies of tuition policy from this period of time, Morgan does not focus any aspect of his examination on the success or performance of students based on the non-resident differential tuition policy.
More recently, several articles have taken up the topic of tuition policies with respect to undocumented immigrants (Dougherty, Nienhusser and Vega, 2010; McLendon and Mokher, 2011). In both articles, the emphasis is on the current use of non-resident differential tuition policies to discourage undocumented students who graduate from US high schools from attending college. According to both studies, nine states currently allow undocumented students to pay in-state rates, while four states impose the non-resident rates. Dougherty et al situate their analyses of these contrasting approaches between two border states (Texas and Arizona) within an advocacy coalition framework and a policy entrepreneurship theory of policymaking. Neither study, however, takes up the question of how well students succeed based on different tuition policies.
As noted in the introduction, recent attention to college tuition has been due to the decline of public support, forcing many formerly affordable colleges to pass on increasingly higher shares of their costs directly to students via higher tuition and fees. Studying the impact of the “tax revolt” from the late 1970s and early 1980s, Archibald and Feldman (2006) find that state policies set in response to this political movement have remained in a constant mode of decreasing public support ever since, although institutions vary widely in how they respond with tuition policies. For example, in a scholarly review of tuition policies for his study of linear tuition modeling, Troutt (1983) found that few institutions, let alone states, used consistent approaches to setting tuition, much less to raising it. Trout argues that linear mathematical models allow an institution to apply its own differential tuition rules (such as graduate tuition greater than undergraduate) along with its goals (that all increases will be equal as a percentage or will not exceed x% per hour, etc.) and yield ranges for the best possible increases to impose. The Troutt study looks closely at an actual case where the model was applied, and the Board at that institution opted to charge a per-credit increase that was very close to the amount that the linear model yielded.
476 |
P a g e
By contrast, Cheslock and Hughes (2011) found that although states varied significantly from one another on their approaches to setting tuition rates according to institutional type, control, enrollment, need or grant recipient status, most states seem to share one trend in common over the past two decades: differences between the states fell over time as most states steadily withdrew public support from higher education during the two decades studied. Cheslock and Hughes also found that the population shift away from the high-tuition northeastern region towards the low-tuition southern region of the US also had an impact on the loss of public support and resulting increases in tuition. The relationships between enrollment behaviors and tuition policies have also been the focus of many studies reviewed by Curs and Singell (2010). Like many researchers whose work preceded theirs, Curs and Singell found that students were surprisingly unresponsive to changes in tuition policy, although their model demonstrates less responsiveness among high ability, low need students than their low ability, high need counterparts. Shin and Milton (2006) also acknowledge conflicting results on student sensitivity to tuition increases. Shin and Milton argue that economic cycles and external forces account for these conflicts in students’ sensitivity to tuition increases. As with many of the studies reviewed above, however, these studies considered only the revenue and enrollment management impacts of tuition prices, not the impact on student success.
A FLAT RATE STUDY AT STOCKTON COLLEGE AND DATA COLLECTION
Several decades of tuition policy studies have focused largely on economic aspects of tuition policy. The primary focus of this study is toward observing the relationship between students’ persistence and performance in the semesters immediately following the adoption of flat rate tuition at Stockton, a public college. The following sections will describe the tuition policy change, the sample selection for the study, demographic observations, and an analysis of student
persistence and performance. Therefore, this study will begin to fill this gap in the literature.
Institutional Context and Tuition Policy Change
This study uses the data from The Richard Stockton College of New Jersey, one of nine state colleges in New Jersey. One of the two youngest senior public colleges in New Jersey, Stockton was founded in 1969 and opened its doors to approximately 1,000 students near Atlantic City in 1971. Since that time the College has grown to enroll more than 8,000 students, approximately 800 of whom are graduate students. Masters programs began at the College in 1999. Over its forty year history, the College has also grown from a handful of academic “divisions” to seven academic schools, identified in this article by institutional acronyms: Arts and Humanities (ARHU); Business Studies (BUSN); Education (EDUC); General Studies (GENS); Health Sciences (HLTH); Natural Sciences and Mathematics (NAMS); and Social and Behavioral Sciences (SOBL).
Consistent with the most common differential tuition policies, Stockton has traditionally charged higher tuition rates for graduate programs. Long after its founding, however, Stockton transitioned from a per-credit tuition pricing policy to a flat or block rate tuition policy in Fall 2009. This study looks at full time students during the period Fall 2009 through Spring 2011 to provide an initial analysis of student persistence and performance since the start of flat rate tuition.
Sample Selection
Our initial sample included all undergraduate students during each Fall and Spring semester from Fall 2009 through Spring 2011. Summer records were excluded from the sample because flat rate tuition is not offered during summer terms. Students receiving any transfer credits during a semester were excluded from the sample as persistence effects could not be isolated. Similarly, to maintain consistent performance measure of GPA before and after each semester in the study, students who were not retained (because they graduated, dropped or stopped out between two consecutive semesters of study) were also excluded. Therefore, the following statistical analyses and discussion sections refer to sample sizes that are smaller than the total enrolled undergraduate population at Stockton for any period of this four-year study. Students in the graduate program were excluded from the study as the Flat Rate tuition policy does not apply to them.
During Fall 2009 through Spring 2011 a total of 18,851 student records were compiled. A total of 1,237 student records were dropped from the sample due to reasons discussed above (graduated, stopped or dropped out during the study period). To avoid bias due to the wide variability in the numbers between schools, all Grade Point Averages (GPA’s) are weighted by the number of students in the category being studied.
FLAT RATE – STUDENT PERSISTENCE AND PERFORMANCE
We define persistence as the situation where a student completes as many credit hours as they enrolled in during a semester. If a student started with, say 80 credits, enrolled in 16 credits and ended the semester with 96 credits – the student persisted.
While there are many ways to measure academic performance, for the purpose of this study, we define performance as the difference between GPA at the end of a semester and GPA at the beginning of a semester. If the GPA goes up, it is interpreted as an improvement in performance and vice versa.
In this section, we look at how, and how much, flat rate tuition is related to a student’s persistence and performance.
Flat Rate and Student Persistence
477 |
P a g e
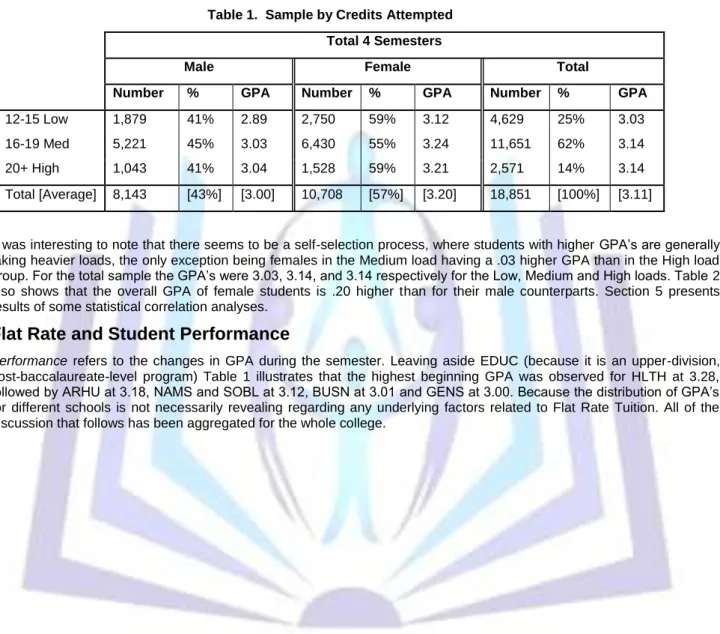
Table 1 summarizes the data to show the course loads, 12-15 credits (Low), 16-19 credits (Medium), and 20 + credits (High) by student gender and their respective GPA’s. We find that the proportion of male and female students in the Low load group was 41% and 59% respectively compared to 43% and 57% in our overall sample. This indicates that female students take the Low load at a higher rate than their male counterparts. The proportions in the Medium load for male and female students were 45% and 55%; 2% higher for male students than their overall percentage of 43%, while female students were 2% lower than their overall percentage of 57%. In the High load group the reverse was the case where female students were at 59%, 2% higher than their proportion in the sample while male students were at 41%, 2% lower than their proportion in the sample. Thus, the female students are over represented by 2% in the 12-15 credit and 20+ credit group while a higher proportion of male students; again by 2% take the 16-19 credit load.
Table 1. Sample by Credits Attempted Total 4 Semesters
Male Female Total
Number % GPA Number % GPA Number % GPA
12-15 Low 1,879 41% 2.89 2,750 59% 3.12 4,629 25% 3.03
16-19 Med 5,221 45% 3.03 6,430 55% 3.24 11,651 62% 3.14
20+ High 1,043 41% 3.04 1,528 59% 3.21 2,571 14% 3.14
Total [Average] 8,143 [43%] [3.00] 10,708 [57%] [3.20] 18,851 [100%] [3.11]
It was interesting to note that there seems to be a self-selection process, where students with higher GPA’s are generally taking heavier loads, the only exception being females in the Medium load having a .03 higher GPA than in the High load group. For the total sample the GPA’s were 3.03, 3.14, and 3.14 respectively for the Low, Medium and High loads. Table 2 also shows that the overall GPA of female students is .20 higher than for their male counterparts. Section 5 presents results of some statistical correlation analyses.
Flat Rate and Student Performance
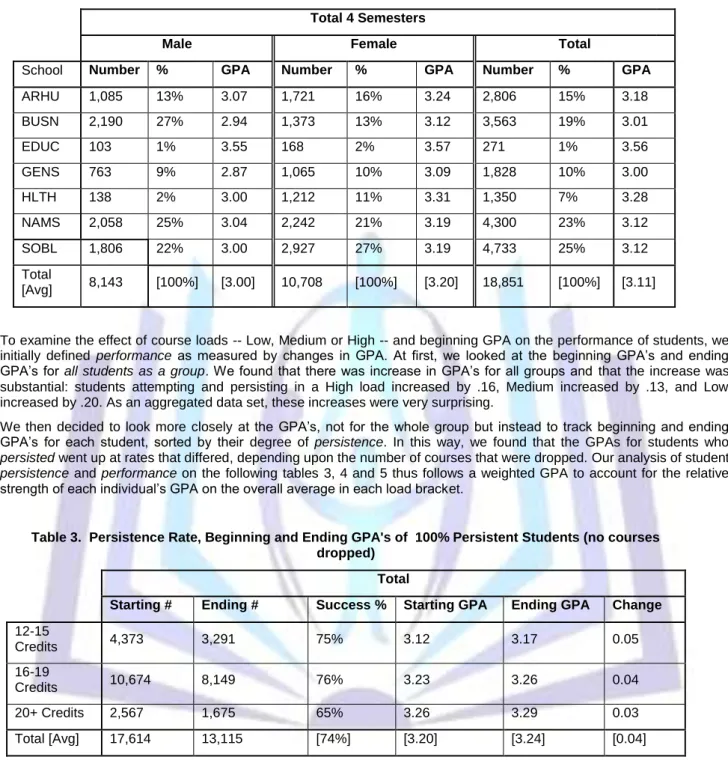
Performance refers to the changes in GPA during the semester. Leaving aside EDUC (because it is an upper-division, post-baccalaureate-level program) Table 1 illustrates that the highest beginning GPA was observed for HLTH at 3.28, followed by ARHU at 3.18, NAMS and SOBL at 3.12, BUSN at 3.01 and GENS at 3.00. Because the distribution of GPA’s for different schools is not necessarily revealing regarding any underlying factors related to Flat Rate Tuition. All of the discussion that follows has been aggregated for the whole college.
478 |
P a g e
Table 2. Sample by School Total 4 Semesters
Male Female Total
School Number % GPA Number % GPA Number % GPA
ARHU 1,085 13% 3.07 1,721 16% 3.24 2,806 15% 3.18 BUSN 2,190 27% 2.94 1,373 13% 3.12 3,563 19% 3.01 EDUC 103 1% 3.55 168 2% 3.57 271 1% 3.56 GENS 763 9% 2.87 1,065 10% 3.09 1,828 10% 3.00 HLTH 138 2% 3.00 1,212 11% 3.31 1,350 7% 3.28 NAMS 2,058 25% 3.04 2,242 21% 3.19 4,300 23% 3.12 SOBL 1,806 22% 3.00 2,927 27% 3.19 4,733 25% 3.12 Total [Avg] 8,143 [100%] [3.00] 10,708 [100%] [3.20] 18,851 [100%] [3.11]
To examine the effect of course loads -- Low, Medium or High -- and beginning GPA on the performance of students, we initially defined performance as measured by changes in GPA. At first, we looked at the beginning GPA’s and ending GPA’s for all students as a group. We found that there was increase in GPA’s for all groups and that the increase was
substantial: students attempting and persisting in a High load increased by .16, Medium increased by .13, and Low increased by .20. As an aggregated data set, these increases were very surprising.
We then decided to look more closely at the GPA’s, not for the whole group but instead to track beginning and ending GPA’s for each student, sorted by their degree of persistence. In this way, we found that the GPAs for students who
persisted went up at rates that differed, depending upon the number of courses that were dropped. Our analysis of student
persistence and performance on the following tables 3, 4 and 5 thus follows a weighted GPA to account for the relative strength of each individual’s GPA on the overall average in each load bracket.
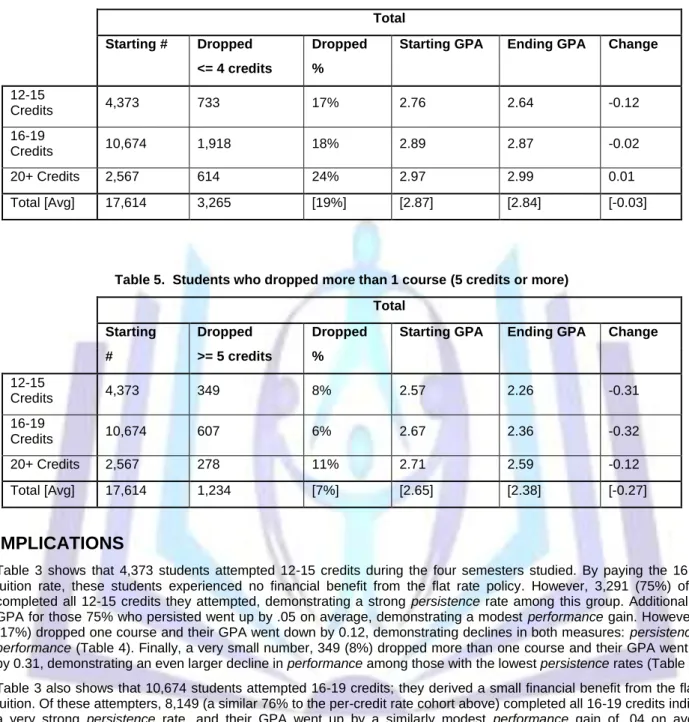
Table 3. Persistence Rate, Beginning and Ending GPA's of 100% Persistent Students (no courses dropped)
Total
Starting # Ending # Success % Starting GPA Ending GPA Change 12-15 Credits 4,373 3,291 75% 3.12 3.17 0.05 16-19 Credits 10,674 8,149 76% 3.23 3.26 0.04 20+ Credits 2,567 1,675 65% 3.26 3.29 0.03 Total [Avg] 17,614 13,115 [74%] [3.20] [3.24] [0.04]
479 |
P a g e
Table 4. Students who dropped 1 course (4 credits or less) Total
Starting # Dropped Dropped Starting GPA Ending GPA Change <= 4 credits % 12-15 Credits 4,373 733 17% 2.76 2.64 -0.12 16-19 Credits 10,674 1,918 18% 2.89 2.87 -0.02 20+ Credits 2,567 614 24% 2.97 2.99 0.01 Total [Avg] 17,614 3,265 [19%] [2.87] [2.84] [-0.03]
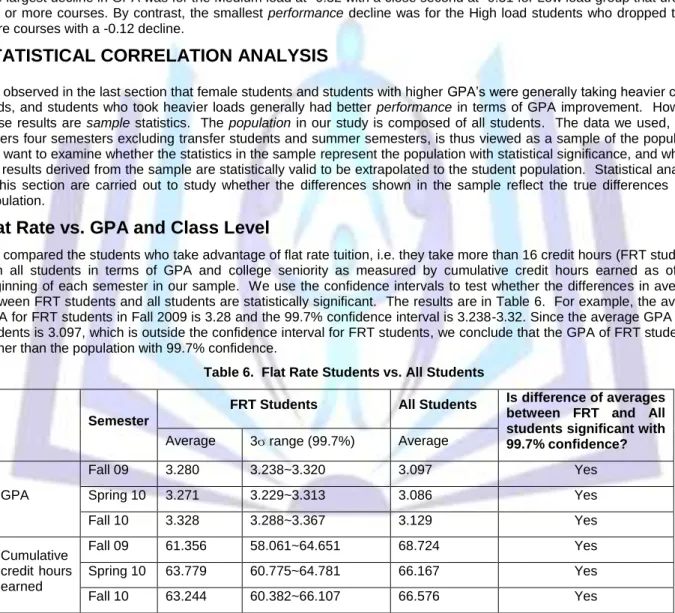
Table 5. Students who dropped more than 1 course (5 credits or more) Total
Starting Dropped Dropped Starting GPA Ending GPA Change # >= 5 credits % 12-15 Credits 4,373 349 8% 2.57 2.26 -0.31 16-19 Credits 10,674 607 6% 2.67 2.36 -0.32 20+ Credits 2,567 278 11% 2.71 2.59 -0.12 Total [Avg] 17,614 1,234 [7%] [2.65] [2.38] [-0.27]
IMPLICATIONS
Table 3 shows that 4,373 students attempted 12-15 credits during the four semesters studied. By paying the 16-credit tuition rate, these students experienced no financial benefit from the flat rate policy. However, 3,291 (75%) of them completed all 12-15 credits they attempted, demonstrating a strong persistence rate among this group. Additionally, the GPA for those 75% who persisted went up by .05 on average, demonstrating a modest performance gain. However, 733 (17%) dropped one course and their GPA went down by 0.12, demonstrating declines in both measures: persistence and
performance (Table 4). Finally, a very small number, 349 (8%) dropped more than one course and their GPA went down by 0.31, demonstrating an even larger decline in performance among those with the lowest persistence rates (Table 5). Table 3 also shows that 10,674 students attempted 16-19 credits; they derived a small financial benefit from the flat rate tuition. Of these attempters, 8,149 (a similar 76% to the per-credit rate cohort above) completed all 16-19 credits indicating a very strong persistence rate, and their GPA went up by a similarly modest performance gain of .04 on average. Likewise, of the 1918 (18%) students who dropped one course for a lower persistence rate, the GPA performance also dropped slightly by .02 (Table 4). Additionally, 607 (6%) students dropped more than one course and their GPA decline was quite substantial at 0.32 (Table 5). As these students paid the full flat rate for 16 credits, most saw a neutral financial effect (or in the case of the 18-credit science students who typically carry lab credits) some recognized a modest financial benefit from the flat rate tuition.
Interestingly, of the 2,567 students who attempted 20+ credits (the flat rate financial beneficiaries) only 1,675 (65%) completed all 20+ credits, a lower persistence rate than their counterparts in both the low and medium credit load brackets. These students also demonstrated a very modest performance gain with a .03 higher GPA than what they started the semester with (Table 3). However, in contrast to the low and medium load groups above, the 614 (24%) of students who dropped one course from their high credit loads actually experienced an extremely slight performance gain when their GPA went up by 0.01 on average (Table 4). Finally, Table 5 shows that much like their low and medium load counterparts, those heavy load students with the lowest persistence rates, 278 (11%) who dropped more than one course also saw their GPA performance decrease, but only by 0.12 (where the Low load poor persistence students dropped .31 and the Medium load poor persistence students dropped .32 in the GPA).
480 |
P a g e
The data suggest that successful students with higher GPAs seem to be self-selecting or voluntarily choosing to attempt heavier loads. In those cases, their chances for success in both measures, persistence and performance, are relatively high at 65% and +.03 respectively. Those with lower starting GPAs appear to be less likely to seek the financial advantage of the flat rate tuition policy, and far less likely to benefit from it when they attempt a High load.
The persistence rate among students in the Low and Medium load group was 75% and 76% respectively, and dropped to 65% for students in the High load group (Table 3). This difference also suggests that taking 20 or more credits leads students to drop one or more courses at a higher rate than their Low or Medium load counterparts. We also found that overall GPA went up by .04 for all students who persisted, with the highest increase for students who started with a Low load at 0.05; 0.04 for the Medium load group, and 0.03 for the High load group.
These gains in GPA contrast with the groups that did not persist (Tables 4 and 5) as the GPA decreased by 0.03 for students who dropped one course and by 0.27 for students who dropped two or more courses. Among students who dropped one or more courses, the ending GPA was lower for all groups except a very small increase (0.01) for the High load group who dropped one course. This may be an indication that students with a relatively high GPA (2.97 in our sample) may be taking 20+ credits with the idea of dropping one course, if needed, to maintain or improve their GPA. The largest decline in GPA was for the Medium load at -0.32 with a close second at -0.31 for Low load group that dropped two or more courses. By contrast, the smallest performance decline was for the High load students who dropped two or more courses with a -0.12 decline.
STATISTICAL CORRELATION ANALYSIS
We observed in the last section that female students and students with higher GPA’s were generally taking heavier course loads, and students who took heavier loads generally had better performance in terms of GPA improvement. However, these results are sample statistics. The population in our study is composed of all students. The data we used, which covers four semesters excluding transfer students and summer semesters, is thus viewed as a sample of the population. We want to examine whether the statistics in the sample represent the population with statistical significance, and whether the results derived from the sample are statistically valid to be extrapolated to the student population. Statistical analyses in this section are carried out to study whether the differences shown in the sample reflect the true differences in the population.
Flat Rate vs. GPA and Class Level
We compared the students who take advantage of flat rate tuition, i.e. they take more than 16 credit hours (FRT students), with all students in terms of GPA and college seniority as measured by cumulative credit hours earned as of the beginning of each semester in our sample. We use the confidence intervals to test whether the differences in averages between FRT students and all students are statistically significant. The results are in Table 6. For example, the average GPA for FRT students in Fall 2009 is 3.28 and the 99.7% confidence interval is 3.238-3.32. Since the average GPA for all students is 3.097, which is outside the confidence interval for FRT students, we conclude that the GPA of FRT students is higher than the population with 99.7% confidence.
Table 6. Flat Rate Students vs. All Students
Semester
FRT Students All Students Is difference of averages between FRT and All students significant with 99.7% confidence? Average 3 range (99.7%) Average
GPA Fall 09 3.280 3.238~3.320 3.097 Yes Spring 10 3.271 3.229~3.313 3.086 Yes Fall 10 3.328 3.288~3.367 3.129 Yes Cumulative credit hours earned Fall 09 61.356 58.061~64.651 68.724 Yes Spring 10 63.779 60.775~64.781 66.167 Yes Fall 10 63.244 60.382~66.107 66.576 Yes
The results of statistical analyses in Table 6 shows:
1. Students who take advantage of FRT have higher GPA’s than those whose who do not. That is, a student with higher GPA tends to take advantage of FRT as compared to those with lower GPAs. Three semesters’ results are consistent and statistically significant with 99.7% confidence.
2. Students who take advantage of FRT have earned fewer cumulative credit hours than those who do not. Three semesters’ results are consistent and statistically significant with 99.7% confidence. That is, a student who is at higher class level and has earned more credit hours tends not to take advantage of FRT, compared to students at lower class level and relatively new in college.
481 |
P a g e
Flat Rate vs. Gender
To test who are more likely, between male and female students, to take advantage of flat rate tuition policy, we use the simple regression method in which dependent variable Y=number of credit hours taken by a students in a semester, independent variable X=gender (1 for male and 2 for female). The results are shown in Table 7.
Table 7. Gender vs. Number of Credit Hours Earned – Results of Regression p-value correlation sign Significant?
Fall 09 0.000000687 + Yes
Spring 10 0.000000056 + Yes
Fall 10 0.00000014 + Yes
A “+” correlation sign means that number of credit hours earned in a semester is positively correlated with gender. Since 1 represents male and 2 represents female in the data, the “+” correlation shows that female students tend to take more credit hours than male students.
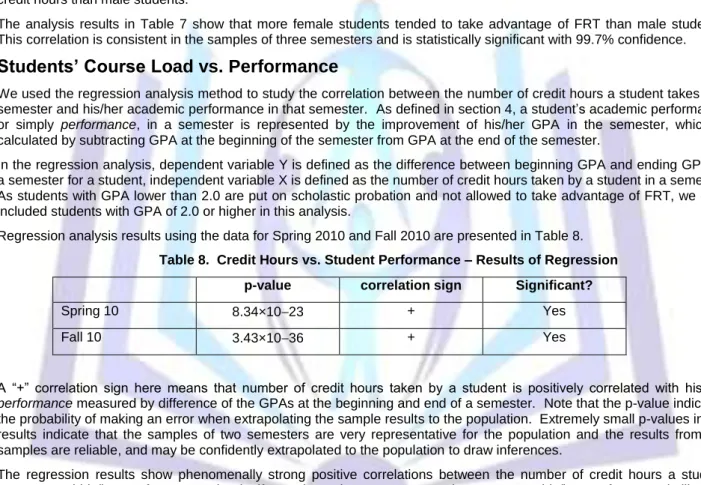
The analysis results in Table 7 show that more female students tended to take advantage of FRT than male students. This correlation is consistent in the samples of three semesters and is statistically significant with 99.7% confidence.
Students’ Course Load vs. Performance
We used the regression analysis method to study the correlation between the number of credit hours a student takes in a semester and his/her academic performance in that semester. As defined in section 4, a student’s academic performance, or simply performance, in a semester is represented by the improvement of his/her GPA in the semester, which is calculated by subtracting GPA at the beginning of the semester from GPA at the end of the semester.
In the regression analysis, dependent variable Y is defined as the difference between beginning GPA and ending GPA of a semester for a student, independent variable X is defined as the number of credit hours taken by a student in a semester. As students with GPA lower than 2.0 are put on scholastic probation and not allowed to take advantage of FRT, we only included students with GPA of 2.0 or higher in this analysis.
Regression analysis results using the data for Spring 2010 and Fall 2010 are presented in Table 8. Table 8. Credit Hours vs. Student Performance – Results of Regression
p-value correlation sign Significant?
Spring 10 8.34×10 23 + Yes
Fall 10 3.43×10 36 + Yes
A “+” correlation sign here means that number of credit hours taken by a student is positively correlated with his/her
performance measured by difference of the GPAs at the beginning and end of a semester. Note that the p-value indicates the probability of making an error when extrapolating the sample results to the population. Extremely small p-values in the results indicate that the samples of two semesters are very representative for the population and the results from the samples are reliable, and may be confidently extrapolated to the population to draw inferences.
The regression results show phenomenally strong positive correlations between the number of credit hours a student attempts and his/her performance. That is, if a student takes more courses in a semester, his/her performance is likely to be better than other students; and on the other hand, if a student’s academic performance is improved then s/he usually has taken a heavier course load. Note that the results only show the strong correlation between academic performance and students’ course load. They do not indicate the causal relation between the two factors. That is, they do not show whether a student’s heavier course load causes his/her higher performance or a student’s higher performance explains the reason for him/her to take a heavier course load.
CONCLUSION
This study has demonstrated a strong correlation between persistence and performance i.e. greater success in persisting
also shows greater success in performance. The study also shows statistical correlations between the students who take advantage of flat rate tuition and their genders, GPAs, class levels, and performances. As noted in the preceding section on implications, these findings may prove useful to inform advising protocols, satisfactory academic progress guidelines and other related institutional policies designed to enhance student persistence and performance.
Further studies may include investigation of the reasons behind the correlations we have discovered. Statistical causal studies may reveal why correlations exist between the pairs of factors such as persistence vs. performance and course
482 |
P a g e
load vs. performance, which will prove useful to institutions who are interested in examining the longitudinal impact on graduation rates.
REFERENCES
[1] Archibald, R.B. and Feldman, D.H. 2006. State higher education spending and the tax revolt. The Journal of Higher Education, 77(4), 618-644.
[2] Bien, P. 2009. Tuition: Towards a fair student contribution for higher education. Ontario Undergraduate Student Alliance Policy Paper. Available: http://www.ousa.ca/wordpress/wp-content/uploads/2010/12/Tuition.pdf [3] Cheslock, J. J. and Hughes, R. P. 2011 Differences across states in higher education finance policy. Journal of
Education Finance, 36(4), 369-393.
[4] Cur, B.R. & Singell, L.D. 2010. Aim high or go low? Pricing strategies and enrollment effects when the net price elasticity varies with need and ability. The Journal of Higher Education, 81(4), 515-543.
[5] Dougherty, K.J., Nienhusser, H.K. and Vega, B.E. 2010. Undocumented immigrants and state higher education policy: The politics of in-state tuition eligibility in Texas and Arizona. The Review of Higher Education, 34(1). [6] Morgan, J. N. 1983. Tuition policy and the interstate migration of college students. Research in Higher Education,
19(2), 183-195.
[7] Selingo, J. 2001. Colleges and lawmakers push students to graduate in 4 years. Chronicle of Higher Education, 48(11), A22-A24.
[8] Shin, J., and Milton, S. 2006. Rethinking tuition effects on enrollment in public four-year colleges and universities. Review of Higher Education, 29(2), 213-237.
[9] Titus, M. 2009. The production of bachelor’s degrees and financial aspects of state higher education policy: A dynamic analysis. The Journal of Higher Education, 80(4), 439-468.
[10] Titus, M. and Pusser, B. 2011. States' potential enrollment of adult students: A stochastic frontier analysis. Research in Higher Education, 52(6), 555-571.
[11] Trout, M. 1983. Deciding tuition structure with linear programming. Research in Higher Education, 18(3), 359-371. [12] US Department of Education. 2011. College Affordability and Transparency Center. Available:
http://collegecost.ed.gov/catc/
[13] Yanikoski, R. and Wilson, R. 1984. Differential pricing of undergraduate education. Journal of Higher Education, 55, 735-750.
Author’ biography with Photo
Gurprit Chhatwal:He earned his Ph.D. in Economics from Kansas State University in 1980. He later received a Masters in Accountancy from DePaul University, Chicago in 1983 and a CPA from Illinois and New Jersey. His research interests are primarily in financial accounting. He has published papers in The Journal of Taxation and Investments, International J. of Intercultural Information Management, Advances in International Accounting
and ABACUS. He has published practice sets and case studies with McGraw Hill Publishers and a book with Academic Publications American Hotel & Lodging Educational Institute. He is currently an Associate
Professor
at Richard Stockton College of New Jersey. Claudine Keenan:
She earned her Ed.D. in Higher Education from the University of Massachusetts, Amherst in 2007. Her research interests are in online learning, K-college collaboration, and higher education management. Dr. Keenan is currently Dean of Education at the Richard Stockton College of New Jersey, USA.
Jinchang Wang:
He received Ph.D. in operations research / information technology at Georgia Institute of Technology in 1990. His research interests are in artificial intelligence, operations research, future of intelligent systems,
cyberbullying, and education assessment. His dozens of research papers have been published in journals
Mathematical Programming, ORSA Journal on Computing, Annals of Mathematics and Artificial Intelligence, J. of Automated Reasoning, J. of Approximate Reasoning, Mathematical and Computer Modelling, Knowledge-based Systems, Computers and Operations Research, J. of Int. Technology and Information Management,
483 |
P a g e
J. of Combinatorial Optimization, Int. J. of Intercultural Information Management, Int. J. of Cyber Criminology, Int. J. of Technoethics, Int. J. of Intelligence Science, Int. J. of Open Problems in Computer Science and Mathematics, etc. He is currently a Professor in School of Business, Richard Stockton College of New Jersey, USA.