ISSN-1843-763X
FOREIGN DIRECT INVESTMENTS AS A FACTOR FOR
ECONOMIC GROWTH IN ROMANIA
Piotr MISZTAL*
Abstract: The main aim of the article is to present the influence of foreign direct investments (FDI) on the economic growth in Romania between 2000 and 2009. The article consists of two parts. The first part presents a theoretical analysis of the FDI-led growth hypothesis. This part overviews empirical research, while the next one analyses the importance of foreign direct investments for economic growth in Romania using the Vector Autoregression Model (VAR). The elasticity coefficients of gross domestic product (GDP) to changes in gross fixed capital formation, employment, exports of goods and services, and foreign direct investments in Romania are estimated on the basis of impulse response function. Finally, the author offers a decomposition of the gross domestic product variance to assess the degree of GDP determination by changes in gross fixed capital formation, employment, exports of goods and services, and foreign direct investments in Romania.
Keywords: Economic growth, foreign direct investments, vector autoregressive model
JEL Codes: F43 – Economic Growth of Open Economies
INTRODUCTION
The main aim of this study is to analyse the factors which determined the growth rate in Romania during 2000-2009, with a special emphasis on the importance of the inflow of foreign direct investments. In this paper, we use methods from literature used in international economics and international finance, as well as econometric methods (vector autoregressive model-VAR). All statistics
* Technical University in Radom Economics Department, Chair of International Economics and Regional Integration, Poland, e-mail: misztal@tkdami.net
used in article come from statistical databases of the International Monetary Fund (International Financial Statistics).
THE ESSENCE AND EFFECTS OF FOREIGN DIRECT INVESTMENT INFLOW
In the economic literature, there are many theories explaining the role of foreign direct investments in the process of the economic growth. According to the theory of development, the foreign direct investments can contribute to increase of the real income of the host country. However, the inflow of foreign direct investments allows the rise of savings in the host country above the level of internal capital accumulation. In this case, the inflow of foreign direct investments stimulates internal investments. Furthermore, the inflow of foreign direct investments, leads to so-called externalities (technology spillover effects) (Carkovic, Levine 2002). Of course, due to new technologies and as a result of investments in infrastructure (e.g. roads and factories), foreign investors may help reduce the distance to highly developed countries (Romer 1993). From this perspective, the inflow of foreign direct investments can contribute to the increase of productivity of all companies, not only those that directly receive foreign capital. In addition, the inflow of foreign direct investments can improve overall economic growth by increasing the degree of competition in the domestic market and greater efficiency of local companies. Furthermore, international capital mobility may contribute to reducing the capacity for national government to continue its erroneous development policy (Adams 2009).
THE IMPORTANCE OF FOREIGN DIRECT INVESTMENTS IN
ACCELERATING ECONOMIC GROWTH IN THE LIGHT OF EMPIRICAL STUDIES
There is relatively small number of empirical analyses in domestic and foreign economic literature concerning the importance of foreign direct investments (FDI) for the host country, carried out using econometric models. Most results of macroeconomic analyses suggest the existence of relatively low and positive impact of FDI on economic development in surveyed countries. These results show that the ability of individual economies to use positive externalities related to the inflow of foreign direct investments are limited by conditions prevailing in the host country, such as the level of development, local financial
markets and the level of education of the population which determines the absorption capacity.Moreover, many empirical studies on the role of foreign direct investments in a host country suggest that the inflow of these investments is an important source of capital, a supplement of national private investments and, usually, it involves a new employment and import technology to the host country, which leads then to a higher growth of the economy (Chowdhury, Mavrotas 2006).
Carkovic and Levine (2002), analyse the relationship between the inflow of foreign direct investments and economic growth on the basis of the panel data, covering 72 developed and developing economies. These studies were carried out using ordinary least squares (OLS) and using generalized method of moments (GMMS). The results of these studies show insignificant connection between the inflow of foreign direct investments and economic growth in analyzed countries. Borensztein, De Gregorio, Lee (1998) and B. Xu (2000) prove that the inflow of foreign direct investments involves the inflow of technology to the host country which leads to higher growth of host country, but only if the country reaches so-called minimum threshold of human capital resources. Alfaro, Chanda, Kalemli-Ozcan, Sayek, (2006), Durham (2004) and Hermes, R. Lensink (2003) provide evidence that only countries with a relatively well-developed financial market system reach substantial benefits from the inflow of foreign direct investments, in the form of faster economic growth.
However, Balasubramanyam, Salisu and Sapsford (1996) analyze the impact of FDI on economic growth in developing economies using ordinary least squares. The results of these tests show the positive impact of foreign direct investments on economic growth in developing countries applying the export promotion strategy. Simultaneously, such relations do not exist in developing countries applying the import substitution strategy. Moreover, Borensztein, De Gregorio, and Lee (1998) conduct studies on the role of foreign direct investments in the diffusion of technology and economic growth. The authors conclude that the inflow of foreign direct investments has a positive impact on economic growth, but the sizes of these benefits depend on human capital resources available in the host country.
Finally, Bengoa and Sanchez-Robles (2003) claim on the basis of studies concerning the link between the inflow of foreign direct investments and economic growth in Latin American countries that the inflow of foreign direct investments has indeed a positive impact on the growth of the country. Both confirmed the hypothesis of Borensztein, De Gregorio, and Lee (1998) that the ultimate impact of
these investments on the rate of economic development of a country depends on many different conditions prevailing in the host country.
MODEL OF ECONOMIC GROWTH
In order to analyze the connection between the inflow of foreign direct investments and the economic growth of the host country, we used the model constructed on the basis of Brocka (2005) model. This model consists of five variables, and presumes that the dynamics of economic growth (GDP) is a function of the country’s labor resources, gross fixed capital formation, the value of national exports of goods and services, and the value of foreign direct investments inflows.
GDPt = f(GFCFt, EMPt, EXPt,, FDIt) (1)
where:
GDP – nominal, gross domestic product;
GFCF – gross fixed capital formation;
EMP – labor resources (employment);
EXP- exports of goods and services;
FDI – the inflow of foreign direct investments;
t – analyzed period.
All the above mentioned time series have the quarterly frequency and cover the period from the first quarter of 2000 to the second quarter of 2009. The series was singled out seasonal factor, because the existence of several temporary seasonal factors could lead to problems in interpreting the changes of variables in the reviewed period. To eliminate seasonal factors, we used used X12-ARIMA procedure. The indexes of analyzed variables in Romania in the period 2000-2009 are presented in Figure 2.
4.5 5 5.5 6 6.5 7 7.5 8 1999 2001 2003 2005 2007 2009 l_GDP_d11 5 5.5 6 6.5 7 7.5 8 8.5 9 1999 2001 2003 2005 2007 2009 l_GFCF_d11 3.7 3.8 3.9 4 4.1 4.2 4.3 4.4 4.5 4.6 4.7 1999 2001 2003 2005 2007 2009 l_EMP_d11 4.5 5 5.5 6 6.5 7 7.5 8 1999 2001 2003 2005 2007 2009 l_EXP_d11 4.5 5 5.5 6 6.5 7 7.5 8 8.5 1999 2001 2003 2005 2007 2009 l_FDI_d11
Figure 2 Dynamics of gross domestic product, labor resources, gross fixed capital
formation, the value of national exports of goods and services, and the value of foreign direct investments inflows in Romania in the period 2000-2009
Source:Own calculations on the basis of International Financial Statistics, (2010).
Correlation coefficient of the gross domestic product and gross fixed capital formation in Romania during 2000-2009 amounts to 0.97, which is a proof of strong linear relationship between these variables. Moreover, there could be observed a high, negative linear interdependence of gross domestic product and employment in Romania. Namely, the correlation coefficient in the examined period is close to -0.87. In turn, the correlation coefficient of the dynamics of the gross domestic product and exports of goods and services is at a higher level and amounts to 0,98, but the correlation coefficient of gross domestic product and inflow of foreign direct investments in Romania equals 0.94. Therefore, on the one hand, calculated correlation coefficients point at the strongest linear relationship between change of the gross domestic product and exports of goods and services, but on the other hand, they point at the weakest linear relationship between the dynamics of the gross domestic product and employment in Romania.
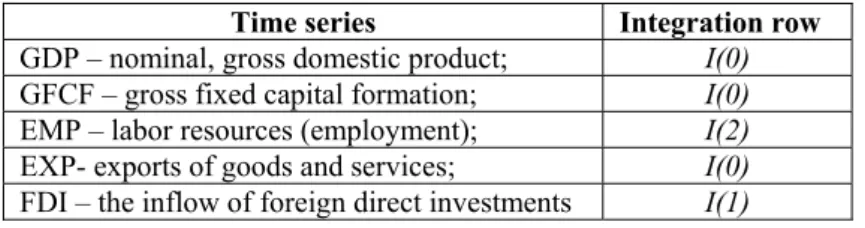
In order to examine the role of foreign direct investments in stimulating the economic growth in Romania, we used the Vector Autoregression Model (VAR). it was necessary to identify stationarity of the analyzed time series. Before using the VAR model assessment, it was necessary to identify stationarity of the analyzed time series. To this purpose, the Augmented Dickey-Fuller Test (ADF) was used.
Results of these tests are shown in following table.
Table 2 Results of stationarity
Time series Integration row
GDP – nominal, gross domestic product; I(0)
GFCF – gross fixed capital formation; I(0)
EMP – labor resources (employment); I(2)
EXP- exports of goods and services; I(0)
FDI – the inflow of foreign direct investments I(1)
Source:Own calculations on the basis of International Financial Statistics, (2010).
The point of departure for the model of economic growth in Romania is an analysis of the so-called distribution chain proposed by Blanchard in 1982. The distribution chain is a series of economic shocks between which a cause and result relation occurs over the same time in which the shock occurred (Blanchard, 1982). In the analyzed VAR model, the distribution chain looks as follows.
FDI → EXP → LAB → GFCF → GDP (2)
Adopted chain distribution stemmed from the fact that the inflow of foreign direct investments contributes to the growth of exports, and this, in turn, generates employment in exporting companies and cooperating firms. Employment growth leads to increase of consumer demand which generates national investments and economic growth.
Naturally, this type of approach has to be revised and in the VAR model an appropriate lag length between variables has to be taken into account, as there is no immediate cause-and-effect relations in economy. For the purposes of the analysis, one lag period (one quarter) between explanatory variables is adopted. The choice of lag lengths is in line with results of the information criteria of the Akaike, Schwartz-Bayesian and the Hannan-Quinn models. According to these criteria, a model with one lag length is characterized by the highest information capacity.
Subsequent step of the analysis is a measurement of the strength of an influence of determining factors on economic growth in Romania. To this purpose, the impulse response function has been used, that is a function of the economic growth response to an impulse of a given factor (gross domestic product, gross fixed capital formation, employment, exports of goods and services, foreign direct investments). The elasticity coefficients of gross domestic product to given determining factors after the period t are defined by the following equation (Cholewiński 2008).
∑
∑
= − = − ∆ ∆ = k i i t k i i t t s z z E 1 1 ) ( (3) where;∆zt-I – change of the gross domestic product, in the period form „t-i” to „t”;
∆st-I – change of gross fixed capital formation, employment, exports of goods and services and foreign direct investments, in the period form „t-i” to „t”.
Change in the gross domestic product equal the values of the impulse response function of the GDP to the shocks in gross domestic product, gross fixed capital formation, employment, exports of goods and services and foreign direct investments.
Sensitivity ratio of gross domestic product to changes in gross fixed capital formation in Romania is 0.05 at the end of the fourth quarter and -0.04 after twentieth quarter, representing a relatively insignificant impact of this factor on growth dynamics in Romania. Much higher is the sensitivity ratio of gross domestic product to changes in employment and it equals 0.10 after the fourth quarter and 0.79 after the twentieth quarter. Moreover, similar is the elasticity of gross domestic product to changes of exports of goods and services and amounts to 0.24 after the fourth quarter and 0.63 after twentieth quarter. Relatively lower is the elasticity coefficient of gross domestic product to foreign direct investments in Romania and equals 0.19 after the fourth quarter and 0.36 after the twentieth quarter.
Table 3 Elasticity coefficients of gross domestic product to changes of gross fixed capital formation, employment, exports of goods and services, foreign direct investments in Romania
The number of quarter
after shock GFCF LAB EXP FDI
1 0,00 0,00 0,00 0,00 2 0,04 0,01 0,12 0,10 3 0,05 0,04 0,18 0,15 4 0,05 0,10 0,24 0,19 5 0,05 0,13 0,29 0,22 6 0,05 0,19 0,33 0,25 7 0,04 0,23 0,37 0,27 8 0,04 0,29 0,40 0,28 9 0,03 0,33 0,44 0,30 10 0,02 0,39 0,46 0,31 11 0,02 0,43 0,49 0,32 12 0,01 0,48 0,51 0,32 13 0,00 0,52 0,53 0,33 14 0,00 0,57 0,55 0,33 15 -0,01 0,61 0,57 0,34 16 -0,02 0,65 0,58 0,34 17 -0,02 0,69 0,59 0,35 18 -0,03 0,72 0,61 0,35 19 -0,04 0,76 0,62 0,35 20 -0,04 0,79 0,63 0,36
Source:Own calculations on the basis of International Financial Statistics, (2010).
On the basis of data presented in the above table, it can be concluded that the most important determining factor of gross domestic product in Romania during 2000-2009 is change of employment, while the smallest impact on gross domestic product during this period has the inflow of foreign direct investments.
Given shock occurrence is connected with each of the distribution chain links. However, only in the case of the first chain link, the original shock occurs and in subsequent links the shock results from the transmission of shocks in the former links. Hence, the shock occurring in subsequent chain links can be decomposed into an autonomous part (occurring in a given chain link) and the one transmitted from earlier links. Chain link decomposition is accomplished with the use of Cholesky decomposition matrix. Establishing the strength of the shock
transmission is indispensable to analyse foreign direct investments, as a factor for economic growth in a more detailed way.
Hence, the last stage of the analysis is the decomposition of the variance residual of subsequent factors which determines the dynamics of growth, in order to estimate the impact of these factors on the variability of the gross domestic product in Romania.
Table 4 The error variance decomposition in the economic growth equation [in %]
The number of
quarter after shock GDP GFCF LAB EXP FDI
1 0,0 100,0 0,0 0,0 0,0 2 0,1 94,9 0,5 0,0 2,7 3 0,1 92,6 0,5 0,1 4,9 4 0,1 90,2 0,4 0,1 7,4 5 0,1 87,9 0,3 0,2 9,8 6 0,1 85,6 0,3 0,3 12,2 7 0,1 83,4 0,3 0,3 14,4 8 0,1 81,5 0,3 0,4 16,4 9 0,1 79,7 0,3 0,4 18,2 10 0,1 78,1 0,3 0,5 19,8 11 0,1 76,7 0,3 0,5 21,2 12 0,1 75,5 0,3 0,6 22,4 13 0,1 74,4 0,3 0,6 23,5 14 0,1 73,4 0,3 0,6 24,5 15 0,1 72,6 0,3 0,6 25,3 16 0,1 71,8 0,3 0,7 26,1 17 0,1 71,2 0,3 0,7 26,7 18 0,1 70,6 0,3 0,7 27,3 19 0,1 70,1 0,3 0,7 27,8 20 0,1 69,6 0,3 0,7 28,3
Source:Own calculations on the basis of International Financial Statistics, (2010).
On the basis of the data from the above Table, it can be noted that changes in the gross domestic product in Romania hardly explain GDP variance in the short-run as well as in the long-short-run. However, the effects of changes in employment and exports of goods and services on gross domestic product variance in the short- and long-run are similar. In the short- and long-run, only 0.3-0.7% of changes in gross domestic product in Romania can be accounted for by a change in employment and exports of goods and services. Much higher is the role of foreign direct investments in accounting for gross domestic product variances in the short- and long-run. In
the short-run, about 7.4% of GDP changes can be explained by changes in the foreign direct investments. This effect increases significantly as the time passed from the moment of change in this factor. In the long-run, the change in foreign direct investments accounts for 28.3% of GDP changes. The highest is the importance of gross fixed capital formation in explaining gross domestic product variances in the short- and long-runs, because more than 94% of GDP changes can be clarified by changes in gross fixed capital formation in the short-run and about 70% in the long-run.
CONCLUDING REMARKS
On the basis of the analysis on the role of foreign direct investments in stimulating economic growth in Romania during 2000-2009, the relatively important linear relationship between the dynamics inflow of foreign direct investment and the dynamics of economic growth in Romania was confirmed Furthermore, on the basis of VAR model estimations, we could affirm that the inflow of foreign direct investments was one of the key factors which substantially determined GDP in Romania during 2000-2009. On the other hand, it was also found that the largest impact on GDP growth in Romania during 2000-2009 has been on the employment changes. Therefore, the positive and significant influence of foreign direct investments on the dynamics of gross domestic product in Romania has been confirmed, but taking into account other determining factors, foreign direct investments were not the most significant cause of economic growth in Romania.
REFERENCES
1. Adams S. (2009), Can foreign direct investments (FDI) help to promote growth in Africa?, African Journal of Business Management, Vol. 3(5).
2. Alfaro L., Chanda A., Kalemli-Ozcan S., Sayek S. (2006), How does foreign direct investments promote economic growth? Exploring the effects of financial markets on linkages, NBER Working Paper Series, No12522.
3. Balasubramanyam, V.N., Salisu, M., Sapsford, D. (1996), Foreign direct investments and growth in EP and IS countries, The Economic Journal, No 106.
4. Barro R.J. (1996), Determinants of economic growth: a cross-country empirical study, NBER Working Paper, No 5698.
5. Bengoa, M., Sanchez-Robles B. (2003), Foreign direct investments, economic freedom and growth: new evidence from Latin America, European Journal of Political Economy, No 19.
6. Borensztein, E., De Gregorio J., Lee J.W. (1998), How Does Foreign Direct Investments Affect Economic Growth?, Journal of International Economics, No 45. 7. Brock, G. (2005), Growth in Russia during the 1990s – What role did FDI play?
Postcommunist economies, No 17.
8. Carkovic M., Levine R. (2002), Does Foreign Direct Investments Accelerate Economic Growth? In: Moran H. T., Graham E., Blomstrom M. (eds.), Does FDI Promote Development?, Institute for International Economics, Washington.
9. Cholewiński R. (2008), Wpływ zmian kursu walutowego na dynamikę procesów inflacyjnych, Materiały i studia, Zeszyt nr 226.
10. Chowdhury A., Mavrotas G. (2006), FDI and growth: What causes what? The World Economy, No 29(1).
11. Colen L., Maertens M., Swinnen J. (2008), Foreign direct investments as an engine for economic growth and human development: A review of the arguments and empirical evidence, K.U. Leuven Working Paper, No. 16.
12. Dritsaki M., Dritsaki Ch., Adamopoulos A. (2004), A Causal Relationship between Trade, Foreign Direct Investments and Economic Growth for Greece, American Journal of Applied Sciences, No 1(3).
13. Durham, K. B. (2004), Absorptive Capacity and the Effects of Foreign Direct Investments and Equity Foreign Portfolio Investments on Economic Growth, European Economic Review, No 48.
14. European Competitiveness Report (2001), European Commission, Luxembourg. 15. Hermes, N. Lensink R. (2003), Foreign Direct Investments, Financial Development and
Economic Growth, Journal of Development Studies, No 40.
16. International Financial Statistics (2010), International Monetary Fund, Washington. 17. Johnson A. (2006), The Effects of FDI Inflows on Host Country Economic Growth,
CESIS Working Paper Series in Economics and Institutions of Innovation, No 58. 18. Maddala G. S. (2008), Ekonometria, PWN, Warszawa.
19. Misala J. (red.) (2006), Makroekonomia gospodarki otwartej, Wydawnictwo Politechniki Radomskiej, Radom.
20. Piłatowska M. (2007), Dynamiczne modele ekonometryczne, X Ogólnopolskie Seminarium Naukowe w Toruniu, Katedra Ekonometrii i Statystyki, Uniwersytet Mikołaja Kopernika, Toruń.
21. Romer M. (1993), Idea Gaps and Object Gaps in Economic development, JJournal of Monetary Economics. No 32(3).
22. Smith A. (2008), Badania nad naturą i przyczynami bogactwa narodów (Inquiry into the nature and causes of the wealth of nationes), tłumaczenie: Wolff S., Einfeld O., Sadowski Z., Prejbisz A., Jasińska B., PWN, Warszawa 2008.
23. Solow R.M. (1967), Teoria kapitału i stopa przychodu, PWN, Warszawa.
24. Swan T. (1956), Economic growth and capital accumulation, Economic Record, Vol 32.
25. Xu, B. (2000), Multinational Enterprises, Technology Diffusion, and Host Country Productivity Growth, Journal of Development Economics, No 62.
Appendix 1. Results of the parameter estimate of the VAR model
VAR system, lag order 1
OLS estimates, observations 1998:4-2009:2 (T = 43) Log-likelihood = 319.76455
Determinant of covariance matrix = 2.3903768e-013 AIC = -13.4774
BIC = -12.2487 HQC = -13.0243
Portmanteau test: LB(10) = 240.457, df = 225 [0.2285] Equation 1: l_GDP_d11
Coefficient Std. Error t-ratio p-value
const 0.393952 0.108116 3.6438 0.00082 *** l_GDP_d11_1 0.703196 0.153465 4.5821 0.00005 *** l_GFCF_d11_1 0.0564912 0.0786279 0.7185 0.47698 d_d_l_EMP_d11_1 -0.0298571 0.0726595 -0.4109 0.68350 l_EXP_d11_1 0.180284 0.0693466 2.5998 0.01332 ** d_l_FDI_d11_1 0.0995082 0.0743121 1.3391 0.18872
Mean dependent var 6.594514 S.D. dependent var 0.746454 Sum squared resid 0.063383 S.E. of regression 0.041389 R-squared 0.997292 Adjusted R-squared 0.996926 F(5, 37) 2724.821 P-value(F) 2.10e-46
rho -0.309660 Durbin-Watson 1.772768
F-tests of zero restrictions:
All lags of l_GDP_d11 F(1, 37) = 20.996 [0.0001] All lags of l_GFCF_d11 F(1, 37) = 0.51619 [0.4770] All lags of d_d_l_EMP_d11 F(1, 37) = 0.16885 [0.6835] All lags of l_EXP_d11 F(1, 37) = 6.7587 [0.0133] All lags of d_l_FDI_d11 F(1, 37) = 1.7931 [0.1887] Equation 2: l_GFCF_d11
Coefficient Std. Error t-ratio p-value
const -0.0247613 0.315583 -0.0785 0.93788 l_GDP_d11_1 0.321187 0.447953 0.7170 0.47787 l_GFCF_d11_1 0.629047 0.229509 2.7408 0.00938 *** d_d_l_EMP_d11_1 -0.0701538 0.212088 -0.3308 0.74268 l_EXP_d11_1 0.0889787 0.202418 0.4396 0.66280 d_l_FDI_d11_1 0.097548 0.216911 0.4497 0.65554
Mean dependent var 7.099016 S.D. dependent var 0.931532 Sum squared resid 0.540028 S.E. of regression 0.120811 R-squared 0.985183 Adjusted R-squared 0.983180 F(5, 37) 492.0135 P-value(F) 9.33e-33
rho -0.427301 Durbin-Watson 1.876176
F-tests of zero restrictions:
All lags of l_GDP_d11 F(1, 37) = 0.51411 [0.4779] All lags of l_GFCF_d11 F(1, 37) = 7.5122 [0.0094] All lags of d_d_l_EMP_d11 F(1, 37) = 0.10941 [0.7427] All lags of l_EXP_d11 F(1, 37) = 0.19323 [0.6628] All lags of d_l_FDI_d11 F(1, 37) = 0.20224 [0.6555] Equation 3: d_d_l_EMP_d11
Coefficient Std. Error t-ratio p-value
const 0.0261932 0.198299 0.1321 0.89563 l_GDP_d11_1 -0.0794836 0.281475 -0.2824 0.77922 l_GFCF_d11_1 0.0232572 0.144214 0.1613 0.87276 d_d_l_EMP_d11_1 -0.594365 0.133267 -4.4600 0.00007 *** l_EXP_d11_1 0.0493635 0.127191 0.3881 0.70016 d_l_FDI_d11_1 0.0141509 0.136298 0.1038 0.91787 Mean dependent var -0.000481 S.D. dependent var 0.088384 Sum squared resid 0.213222 S.E. of regression 0.075913 R-squared 0.350117 Adjusted R-squared 0.262295 F(5, 37) 3.986667 P-value(F) 0.005416
rho -0.115731 Durbin-Watson 2.230057
F-tests of zero restrictions:
All lags of l_GDP_d11 F(1, 37) = 0.07974 [0.7792] All lags of l_GFCF_d11 F(1, 37) = 0.026008 [0.8728] All lags of d_d_l_EMP_d11 F(1, 37) = 19.891 [0.0001] All lags of l_EXP_d11 F(1, 37) = 0.15063 [0.7002] All lags of d_l_FDI_d11 F(1, 37) = 0.010779 [0.9179] Equation 4: l_EXP_d11
Coefficient Std. Error t-ratio p-value
const 0.370955 0.12375 2.9976 0.00484 *** l_GDP_d11_1 0.239356 0.175657 1.3626 0.18123 l_GFCF_d11_1 -0.0811464 0.089998 -0.9016 0.37308 d_d_l_EMP_d11_1 -0.0173912 0.0831666 -0.2091 0.83551 l_EXP_d11_1 0.805575 0.0793746 10.1490 <0.00001 *** d_l_FDI_d11_1 -0.0627659 0.0850581 -0.7379 0.46522
Mean dependent var 6.716354 S.D. dependent var 0.774381 Sum squared resid 0.083039 S.E. of regression 0.047374 R-squared 0.996703 Adjusted R-squared 0.996257 F(5, 37) 2237.036 P-value(F) 8.00e-45
rho 0.309807 Durbin-Watson 1.368310
F-tests of zero restrictions:
All lags of l_GDP_d11 F(1, 37) = 1.8568 [0.1812] All lags of l_GFCF_d11 F(1, 37) = 0.81297 [0.3731] All lags of d_d_l_EMP_d11 F(1, 37) = 0.043728 [0.8355] All lags of l_EXP_d11 F(1, 37) = 103 [0.0000] All lags of d_l_FDI_d11 F(1, 37) = 0.54452 [0.4652] Equation 5: d_l_FDI_d11
Coefficient Std. Error t-ratio p-value
const -0.444225 0.20664 -2.1497 0.03818 ** l_GDP_d11_1 1.02878 0.293315 3.5074 0.00121 *** l_GFCF_d11_1 -0.440988 0.15028 -2.9344 0.00571 *** d_d_l_EMP_d11_1 0.059623 0.138873 0.4293 0.67017 l_EXP_d11_1 -0.466509 0.132541 -3.5197 0.00116 *** d_l_FDI_d11_1 -0.0471735 0.142031 -0.3321 0.74166
Mean dependent var 0.074086 S.D. dependent var 0.086984 Sum squared resid 0.231537 S.E. of regression 0.079106 R-squared 0.271390 Adjusted R-squared 0.172929 F(5, 37) 2.756323 P-value(F) 0.032531
rho 0.055263 Durbin-Watson 1.792404
F-tests of zero restrictions:
All lags of l_GDP_d11 F(1, 37) = 12.302 [0.0012] All lags of l_GFCF_d11 F(1, 37) = 8.6109 [0.0057] All lags of d_d_l_EMP_d11 F(1, 37) = 0.18433 [0.6702] All lags of l_EXP_d11 F(1, 37) = 12.389 [0.0012] All lags of d_l_FDI_d11 F(1, 37) = 0.11031 [0.7417]
Appendix 2. Empirical studies of FDI and economic growth


![Table 4 The error variance decomposition in the economic growth equation [in %]](https://thumb-us.123doks.com/thumbv2/123dok_us/1913933.2780892/9.722.143.581.299.696/table-error-variance-decomposition-economic-growth-equation.webp)
